. 2024 Mar 28;15(1):2720.
doi: 10.1038/s41467-024-46943-z.

A rapid inducible RNA decay system reveals fast mRNA decay in P-bodies

Affiliations

A rapid inducible RNA decay system reveals fast mRNA decay in P-bodies

Lauren A Blake et al. Nat Commun. .

Abstract

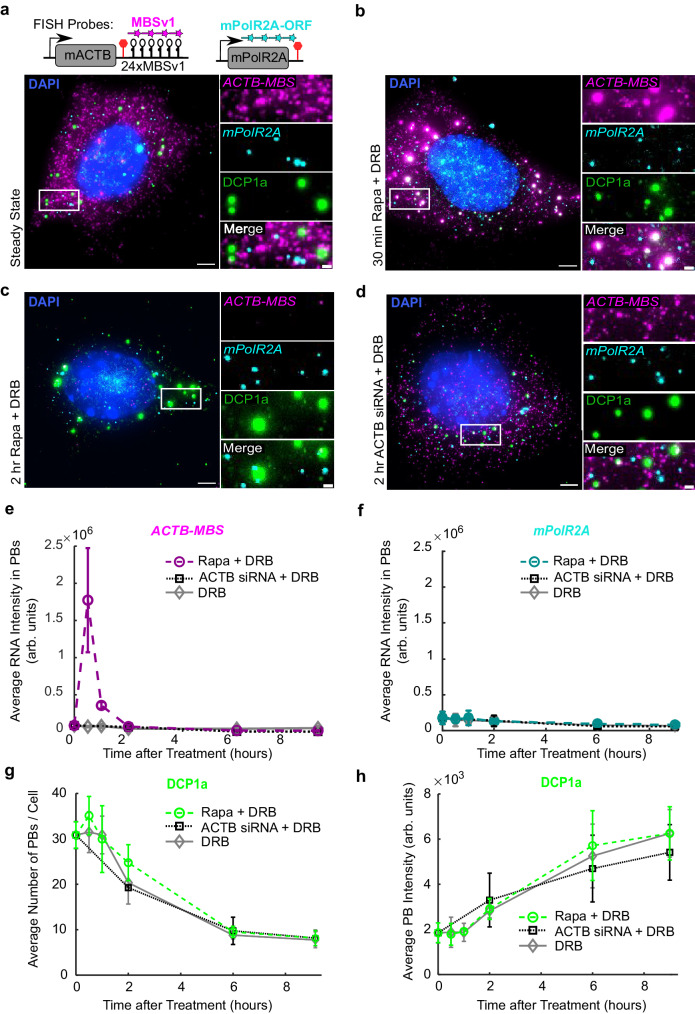
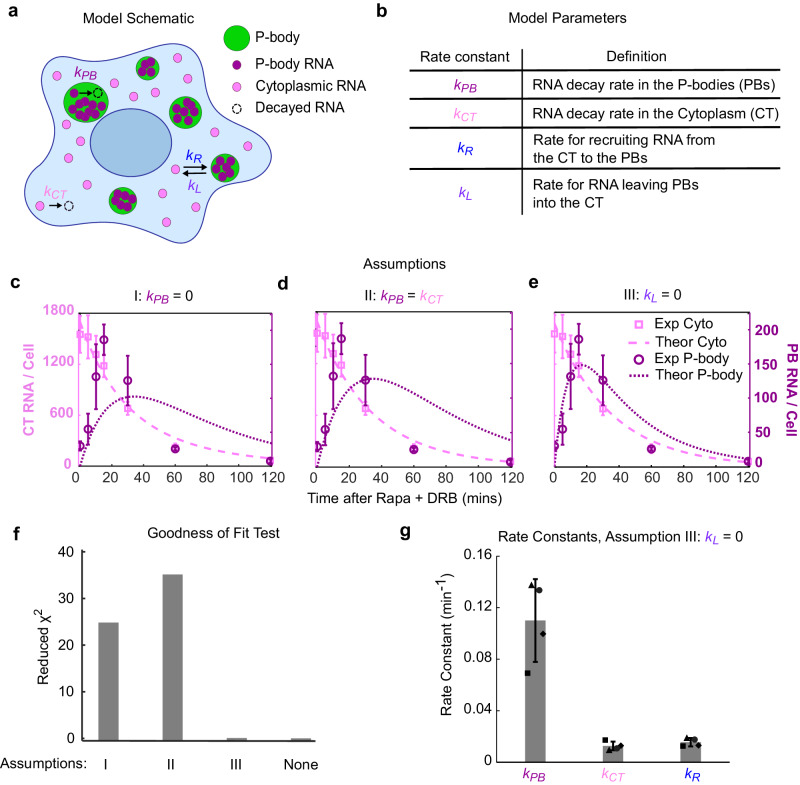
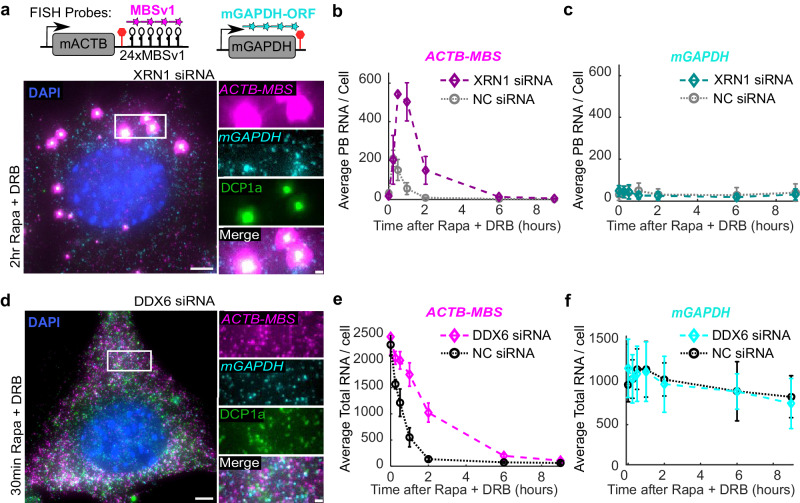
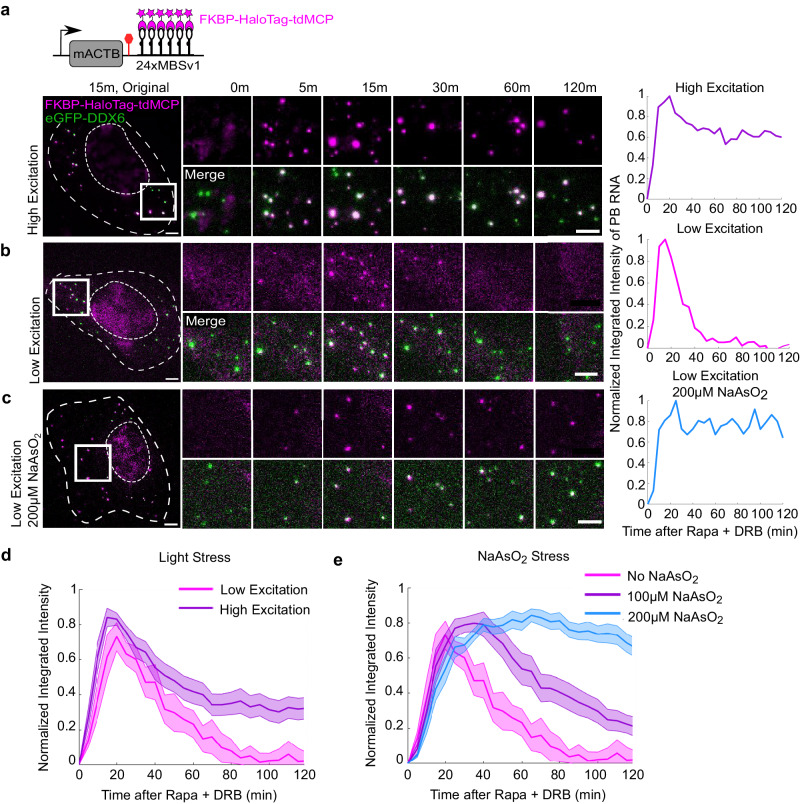
RNA decay is vital for regulating mRNA abundance and gene expression. Existing technologies lack the spatiotemporal precision or transcript specificity to capture the stochastic and transient decay process. We devise a general strategy to inducibly recruit protein factors to modulate target RNA metabolism. Specifically, we introduce a Rapid Inducible Decay of RNA (RIDR) technology to degrade target mRNAs within minutes. The fast and synchronous induction enables direct visualization of mRNA decay dynamics in cells. Applying RIDR to endogenous ACTB mRNA reveals rapid formation and dissolution of RNA granules in pre-existing P-bodies. Time-resolved RNA distribution measurements demonstrate rapid RNA decay inside P-bodies, which is further supported by knocking down P-body constituent proteins. Light and oxidative stress modulate P-body behavior, potentially reconciling the contradictory literature about P-body function. This study reveals compartmentalized RNA decay kinetics, establishing RIDR as a pivotal tool for exploring the spatiotemporal RNA metabolism in cells.


Conflict of interest statement

The authors declare no competing interests.

Figures

Fig. 1
Fig. 1. RIDR system is fast, specific, and inducible.
a Schematic of a generalized inducible mRNA decay system for inducibly targeting an RNA binding motif with an RNA decay factor. b HEK293T cells were transiently transfected with mCherry-MBS and RIDR constructs. Cells were transfected for 12–16 h prior to preparation for flow cytometry. The cells were treated with 100 nM rapamycin (Blue) or DMSO control (Black) at the same time of transfection. FKBP-HaloTag-tdMCP in the RIDR construct was labelled with JF503-Halo-ligand. The fluorescence of single cells was measured by flow cytometry in mCherry and Halo503 and presented as a scatter plot. IRES: Internal Ribosome Entry Site. Raw flow cytometry data from +/− SMG7C and +/− MBS conditions from one replicate are presented. c Knockdown efficiencies of mCherry and HaloTag were quantified from flow cytometry experiments in (b) under conditions listed. The knockdown efficiency is calculated for each condition with respect to itself when Rapa is not added. The HaloTag signal is used as a negative control that does not depend on tethering and Rapa. 1000−3000 HaloTag-positive cells were quantified per condition. Data are presented as mean values across 2, 3 biological replicates. Error bars represent the standard deviation. d, e Representative smFISH images of U-2 OS cells stably expressing mCherry-MBS and RIDR in steady state condition (d) and after 2 h of rapamycin treatment (e). The white box was enlarged on the right. mCherry-MBS FISH: magenta; hPolR2A FISH: cyan; DAPI: blue. Scale bars: 5 µm for original and 1 µm for zoomed images. f, g Quantification of time-resolved two-color smFISH experiment over 9 h after induction with Rapa (circle), mCherry siRNA (square), or DMSO (diamond). DRB was added in all experimental conditions to inhibit transcription. The number of transcripts for mCherry-MBS (f) and hPolR2A (g) were counted in the same cells for all time points. Rapa + DRB: circles; mCherry siRNA + DRB: squares; DRB alone: diamonds. Error bars represent standard deviation of the means of 2 biological replicates. 59−96 cells were quantified per condition across replicates (the precise number of cells per condition per replicate are given in the source data). Source data are provided as a Source Data file.
Fig. 2
Fig. 2. ACTB-MBS transcripts are recruited to P-bodies after RIDR induction.
ac ACTB-MBS MEF cells stably expressing RIDR construct were (a) untreated, (bc) induced by Rapa, or (d) treated with siRNA against ACTB. DRB was added to inhibit transcription at time zero. Cells were fixed at different time points after treatment. smFISH-IF experiments were conducted with FISH probes against ACTB-MBS and mPolR2A, and an antibody against DCP1A. Representative images were shown displaying merged images for FISH and IF channels after (a) no treatment; (b) 30 min Rapa; (c) 2 h Rapa; (d) 2 h ACTB siRNA treatments. The white box was enlarged on the right. ACTB-MBS FISH: magenta; mPolR2A FISH cyan; DCP1a IF: green; DAPI: blue. Scale bars: 5 µm for original images, 1 µm for zoomed images. e, f Quantification of integrated intensities of RNA inside P-bodies after induction, for ACTB-MBS (e) or mPolR2A (f) mRNAs. g, h Quantification of P-body number per cell (g) and average integrated intensity per P-bodies (h). Rapa + DRB: circles; ACTB siRNA + DRB: squares; DRB alone: diamonds. Error bars represent standard deviation of the means of 3-4 biological replicates. 125-253 cells were quantified per condition across replicates (the precise number of cells per condition per replicate are given in the source data).
Fig. 3
Fig. 3. Kinetic Modeling of induced RNA decay in P-bodies and Cytoplasm.
a Schematic of the mathematical model depicting RNA decay, recruitment into and release from P-bodies. The details are described in main text and Supplementary Theory. b Table with definitions of each kinetic rate constant. ce Fitting results under different assumptions (c) I, no decay in P-bodies:, kPB = 0; (d) II, decay in P-bodies and the cytoplasm are the same: kPB = kCT; or (e) III, RNAs recruited into P-bodies do not leave: kL = 0. RNA counts in P-bodies: dark magenta; RNA counts in the cytoplasm: light magenta; Experimental data: symbols; Theoretical fit: lines. Error bars represent standard deviation of the means of 3–4 biological replicates. 150–445 cells were quantified per condition across replicates (the precise number of cells per condition per replicate are given in the source data). f Reduced χ2 values indicating goodness of fit for models in (ce), and with full model (Supplementary Fig. 5b, c). Lower values indicate better fitting. g Model parameters determined from fitting with Assumption III: kL = 0. Data are presented as mean values of the fitted parameters across the 3–4 biological replicates. Error bars represent the standard deviation. Source data are provided as a Source Data file.
Fig. 4
Fig. 4. P-bodies are the site of fast RNA decay.
ACT-MBS MEF cells were treated with siRNA against (ac) XRN1, (df) DDX6, or (bc, ef) scrambled siRNA (NC) for 72 h. Cells were treated with Rapa and DRB, and fixed at different time points. smFISH-IF experiments were conducted with FISH probes against ACTB-MBS and mGAPDH, and antibodies against DCP1a. a Representative image at 2 h post induction for XRN1 siRNA treated cells. The white box was enlarged on the right. ACTB-MBS FISH: magenta; mGAPDH FISH: cyan; DCP1a IF: green; DAPI: blue. Quantification of ACTB-MBS (b) or mGAPDH (c) mRNAs in P-bodies over 9 h time course after induction. XRN1 siRNA: diamonds; NC siRNA: circles. d Representative image for DDX6 siRNA treated cell at 30 min post-induction. The white box was enlarged on the right. ACTB-MBS FISH: magenta; mGAPDH FISH cyan; DCP1a IF: green; DAPI: blue. There are no visible P-bodies under the DDX6 knockdown condition. e, f Quantification of total ACTB-MBS (e) and mGAPDH (f) mRNA levels over 9 h time course after induction. DDX6 siRNA: diamonds; NC siRNA: circles. Scale bars: 5 µm for original images, 1 µm for zoomed images. Error bars represent standard deviation of the means of 3–4 biological replicates. 193–515 cells were quantified per condition across replicates (the precise number of cells per condition per replicate are given in the source data). Source data are provided as a Source Data file.
Fig. 5
Fig. 5. RNA fate in P-bodies is influenced by stress.
Live-cell imaging experiments were performed to track P-bodies (eGFP-DDX6, green) and ACTB-MBS (FKBP-HaloTag-tdMCP, magenta) after induction. ac Representative movie montages under different conditions: a High excitation laser power for single mRNA tracking was used (Supplementary Movie 2); b) minimal laser power sufficient to observe RNA granules colocalized with P-bodies (Supplementary Movie 3); (c) minimal laser power and cells were pretreated with 200 µM NaAsO2 for 30 min (Supplementary Movie 4). The normalized intensity traces of RNA granule intensity of movies (ac) were shown on the right. Scale bars: 5 µm for both original and zoomed images. d Average intensities of RNA granules colocalized with P-bodies under low (magenta) and high (purple) excitation power (number of cells: 8, 14; number of independent experiments: 2, 3; respectively). e Average intensities of RNA granules colocalized with P-bodies under low excitation when cells were pretreated for 30 min with 0 µM (magenta), 100 µM (purple), and 200 µM (blue) NaAsO2 (number of cells: 8, 10, 12; number of independent experiments: 2, 2, 2; respectively). All intensity traces were normalized in each cell before averaging. Data are presented as mean values across each cell. Shaded error bars represent standard error. Source data are provided as a Source Data file.

Update of

Similar articles

Cited by

References

    1. Shoemaker CJ, Green R. Translation drives mRNA quality control. Nat. Struct. Mol. Biol. 2012;19:594–601. doi: 10.1038/nsmb.2301. - DOI - PMC - PubMed
    1. Chang Y-F, Imam JS, Wilkinson MF. The Nonsense-Mediated Decay RNA Surveillance Pathway. Annu. Rev. Biochem. 2007;76:51–74. doi: 10.1146/annurev.biochem.76.050106.093909. - DOI - PubMed
    1. Ilık İA, Aktaş T. Nuclear speckles: dynamic hubs of gene expression regulation. FEBS J. 2022;289:7234–7245. doi: 10.1111/febs.16117. - DOI - PubMed
    1. Tian, S., Curnutte, H. A. & Trcek, T. RNA Granules: A View from the RNA Perspective. Molecules25, 3130 (2020). - PMC - PubMed
    1. Sheth U, Parker R. Decapping and decay of messenger RNA occur in cytoplasmic processing bodies. Science. 2003;300:805–808. doi: 10.1126/science.1082320. - DOI - PMC - PubMed