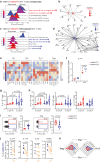
. 2024 Mar 28;15(1):2465.
doi: 10.1038/s41467-024-46606-z.

Autophagy-enhancing ATG16L1 polymorphism is associated with improved clinical outcome and T-cell immunity in chronic HIV-1 infection

Affiliations

Autophagy-enhancing ATG16L1 polymorphism is associated with improved clinical outcome and T-cell immunity in chronic HIV-1 infection

Renée R C E Schreurs et al. Nat Commun. .

Abstract

Chronic HIV-1 infection is characterized by T-cell dysregulation that is partly restored by antiretroviral therapy. Autophagy is a critical regulator of T-cell function. Here, we demonstrate a protective role for autophagy in HIV-1 disease pathogenesis. Targeted analysis of genetic variation in core autophagy gene ATG16L1 reveals the previously unidentified rs6861 polymorphism, which correlates functionally with enhanced autophagy and clinically with improved survival of untreated HIV-1-infected individuals. T-cells carrying ATG16L1 rs6861(TT) genotype display improved antiviral immunity, evidenced by increased proliferation, revamped immune responsiveness, and suppressed exhaustion/immunosenescence features. In-depth flow-cytometric and transcriptional profiling reveal T-helper-cell-signatures unique to rs6861(TT) individuals with enriched regulation of pro-inflammatory networks and skewing towards immunoregulatory phenotype. Therapeutic enhancement of autophagy recapitulates the rs6861(TT)-associated T-cell traits in non-carriers. These data underscore the in vivo relevance of autophagy for longer-lasting T-cell-mediated HIV-1 control, with implications towards development of host-directed antivirals targeting autophagy to restore immune function in chronic HIV-1 infection.


Conflict of interest statement

The authors declare no competing interests.

Figures
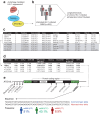
Fig. 1
Fig. 1. Genetic variation in key autophagy gene ATG16L1 impacts the natural course of HIV-1 disease pathogenesis.
a, b Schematic representations of the TRIM5α–ATG16L1–p24 capsid complex involved in autophagy-mediated HIV-1 suppression (a), and the targeted analysis of tagging SNPs in the ATG16L1 gene within a cohort of 304 untreated HIV-1-infected MSM enrolled in the Amsterdam Cohort Studies (ACS) on HIV infection and AIDS (b). c Table depicting the nine ATG16L1 tagging SNPs investigated within the ACS cohort; four were excluded from subsequent analyses (gray shaded) since <10 individuals homozygous for one of the alleles were available for investigation. d Table showing (unadjusted) p-values of univariate survival analyses using Cox regression of the remaining five SNPs with endpoints AIDS diagnosis (CDC 1987), AIDS-related Death, or set-point viral load (SPVL). After Bonferroni correction for multiple testing (adjusted p < 0.01), rs6861 (in bold) was identified to remain strongly associated with delayed HIV-1 disease progression (p = 0.00996). e Schematic representation of the nine tagging SNPs investigated within the ATG16L1 gene, including sequence and allele frequency for rs6861. MSM men-who-have-sex-with-men, Chr. chromosome, MAF minor (less common) allele frequency, RH relative hazard, CI confidence interval, Death AIDS-related death, SPVL set-point viral load. See Supplementary Table 1. b, e Created with Biorender.com.
Fig. 2
Fig. 2. ATG16L1 rs6861(TT) genotype is associated with delayed disease progression, improved AIDS-free survival, decreased set-point viral load and increased CD4 counts in untreated HIV-1 infected individuals.
a,b Kaplan–Meier Survival analyses (Log-rank tests) using the endpoints AIDS diagnosis (CDC1987; a) and AIDS-related death (b). c, d Independent two-tailed t-tests comparing set-point viral load in plasma (c) and CD4 counts (d) of rs6861(TT) HIV-1-infected individuals (n = 27) to the combined rs6861(CC) (n = 122) and rs6861(CT) (n = 155) variants (after Eigenstrat). Minimum-to-maximum whiskers are shown with boxes indicating 25th and 75th percentile ± median. See Supplementary Fig. 1. Source data are provided as a Source Data file.
Fig. 3
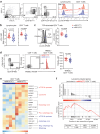
Fig. 3. rs6861(TT) T helper cells display enhanced autophagy flux and upregulated expression of autophagy molecules.
ac Flow-cytometric representation of autophagy flux as measured by saponin extraction of LC3-II accumulation (MFI) in combination with immune cell surface markers upon incubation with bafilomycin A1 (a), showing (relative) increased autophagy flux in lymphocytes (n = 10 per genotype) and CD4+ T cells (n = 4 per genotype) at steady state (b) or upon TCR-mediated stimulation (c) in rs6861(TT) compared to rs6861(CC) CD4+ T cells (n = 4 per genotype). d Increased expression of TRIM5α (MFI) within rs6861(TT) TRIM5α+ CD4+ T cells (TT n = 9, CC n = 8) at steady-state (bd independent two-tailed t-tests). e Targeted RNA-seq. analysis of autophagy-associated genes in steady-state CD4+ T cells, indicating upregulated transcription of core autophagy genes and genes related to positive regulation of autophagy and lysosomes in rs6861(TT) compared to rs6861(CC) CD4+ T cells (n = 4 per genotype). f GSEA (Kolmogorov–Smirnov test, unadjusted p-values) in rs6861(TT) CD4+ T cells corroborating enrichment in lysosome-related genes (n = 4 per genotype). Baf A1 bafilomycin A1, MFI median fluorescence intensity, TCR anti-CD3/CD28 stimulation, pos. positive, reg. regulator, neg. negative, ES enrichment score, NES  normalized enrichment score. See Supplementary Fig. 2. Source data are provided as a Source Data file. RNA-seq. data are accessible through GEO Series accession number GSE253769.
Fig. 4
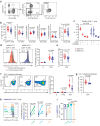
Fig. 4. rs6861(TT) CD4 + T cells display augmented frequencies of T-cell subsets, enhanced proliferative capacity, and enrichment of CCR7+ cells.
a Flow-cytometric representation of the gating strategy used to determine different CD4+ T cell subsets. b Increased frequency of total CD4+, Tn, Temra, and Treg cells and decreased frequency of Tcm cells in rs6861(TT) compared to rs6861(CC) healthy donors (n = 12 per genotype). c TRIM5α+ CD4+ T cells are predominantly restricted to the CCR7+ cell compartment and more prominent in the CCR7+ CD45RA+ Tn cell subset of rs6861(TT) individuals (n = 4 per genotype). d Increased CD4+ T-cell proliferation in response to TCR-stimulation as determined by division of CellTrace reagent over daughter cells (TT n = 11, CC n = 12), e particularly in the CD4+ CCR7+ Tn compartment of rs6861(TT) individuals (n = 7 per genotype). f Increased proliferation of rs6861(TT) CD4+ T cells from genotyped HIV-1-infected individuals in response to stimulation with HIV-1 peptide pool or TCR-engagement (TT n = 6, CC n = 5), g particularly in the CCR7+ compartment (b-g independent two-tailed t-tests) (TT n = 6, CC n = 5). h Treatment with autophagy-enhancing pharmaceuticals carbamazepine (100 µM), everolimus (5 nM), or MK-2206 (1 µM) indicates increased CD4+ T-cell proliferation and i increased percentage of CCR7+ cells in rs6861(CC) donors (h, i n = 5 per genotype, dependent two-tailed t-tests, i mean ± SD is shown). Tn naïve, Tcm central-memory, Tem effector-memory, Temra CD45RA-expressing Tem, Treg regulatory T cells, CTV CellTrace Violet, U untreated, TCR anti-CD3/CD28 stimulation, HIV HIV-1 peptide pool stimulation, Carb. carbamazepine, Eve. everolimus, MK. MK-2206. See Supplementary Fig. 3, Supplementary Fig. 4 and Supplementary Fig. 5a, b. Source data are provided as a Source Data file.
Fig. 5
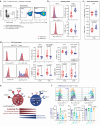
Fig. 5. Enhanced immune responsiveness and reduced exhaustion signatures of rs6861(TT) CD4+ T cells from HIV-1-infected individuals.
a Flow-cytometry plots showing the different CD4+ T-cell states investigated, namely at steady-state (dotted line), and either proliferating (CTV-) HIV-1 peptide pool-stimulated (gray line), or proliferating (CTV-; black line) TCR-activated CD4+ T cells. b, c Decreased frequency of CTLA-4+ cells at steady-state in total CD4+ T cells (n = 5 per genotype) (b) and decreased expression of PD-1 in proliferating (CTV-) CD4+ T cells upon stimulation with HIV-1 peptide pool in rs6861(TT) (n = 5) compared to rs6861(CC) HIV-1-infected individuals (n = 4) (c). d Increased frequency of CTLA-4+ , PD-1+ , CD28+, and increased CD25 MFI of CTV- CD4+ T cells, including in the CCR7+ compartment, in rs6861(TT) HIV-1 infected individuals upon TCR-engagement (TT n = 6, CC n = 5) (bd independent two-tailed t-tests). e Schematic representation of the phenotypical and functional characteristics of the rs6861 genotypes. f Pharmaceutical enhancement of autophagy flux with carbamazepine (100 µM), everolimus (5 nM), or MK-2206 (1 µM) resulted in reduced PD-1 and CTLA-4-expression and increased CD25 expression in rs6861(CC) CD4+ T cells (n = 5) (dependent two-tailed t-tests, mean ± SD is shown). CTV CellTrace Violet, U untreated, HIVp HIV-1 peptide pool stimulation, TCR anti-CD3/CD28 stimulation, MFI median fluorescence intensity, Carb. carbamazepine, Eve. everolimus, MK. MK-2206. See Supplementary Fig. 3 and Supplementary Fig. 5c. Source data are provided as a Source Data file. e Created with Biorender.com.
Fig. 6
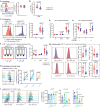
Fig. 6. Augmented CD8+ T cell responses preclude enhanced antiviral immunity in rs6861(TT) individuals during chronic HIV-1 infection.
a, b Flow-cytometric representation of autophagy flux as measured using intracellular LC3-II accumulation (MFI) in CD8+ T cells, showing similar baseline autophagy status between genotypes at steady-state (a), and increased autophagy flux upon TCR-mediated stimulation (b) in rs6861(TT) compared to rs6861(CC) CD8+ T cells (a, b n = 4 per genotype). c Increased CD8+ T-cell proliferation in response to TCR-stimulation (TT n = 11, CC n = 12). d Increased CD8+ T-cell proliferation in cells isolated from HIV-1-infected individuals upon stimulation with HIV-1 peptide pool or TCR-mediated activation. e Particularly the CD8+ Tn cell CCR7+ compartment of rs6861(TT) HIV-1-infected individuals demonstrated increased proliferation in response to TCR-mediated activation as compared to rs6861(CC) cells. f Flow-cytometric representation of CD137+ CD8+ T cells from HIV-1 infected individuals upon TCR-mediated activation, showing increased frequencies of CD137 in rs6861(TT) compared to rs6861(CC) CD8+ T cells (d-f TT n = 6, CC n = 5). g Flow-cytometric representation of CD8+ T cells of HIV-1-infected individuals during chronic infection, demonstrating reduced expression of CLTA-4 but not PD-1 as well as increased expression of CD28 and CD127 at steady-state (n = 5 per genotype) (ag independent two-tailed t-tests). h Treatment with autophagy-enhancing drugs carbamazepine (100 µM), everolimus (5 nM), or MK-2206 (1 µM) resulted in increased CD8+ T-cell proliferative capacity as compared to TCR-activation in the absence of drug treatment and i increased CCR7 as well as reduced frequency of CTLA-4 and PD-1-expressing CD8+ T cells isolated from rs6861(CC) individuals (h-i n = 5, dependent two-tailed t-tests, mean ± SD is shown). Baf A1 bafilomycin A1, MFI median fluorescence intensity, CTV CellTrace Violet, U untreated, TCR anti-CD3/CD28 stimulation, HIV HIV-1 peptide stimulation, Carb. carbamazepine, Eve. everolimus, MK. MK-2206. See Supplementary Fig. 3, Supplementary Fig. 5d, e and Fig. 8. Source data are provided as a Source Data file.
Fig. 7
Fig. 7. Transcriptomics and Th profiling identifies immune-regulatory inflammation signatures and augmented Treg:Th17 ratio in rs6861(TT) CD4+ T cells.
ad GSEA ridgeplots and CNET plots of T-cell-related GO Biological processes visualizing expression distribution of enriched gene sets (unadjusted p-values) in FACSorted rs6861(TT) CD4+ T cells obtained through next-generation RNA-sequencing analyses at steady-state (untreated; a-b), or upon TCR/IL-15-stimulation (c, d), using rs6861(CC) cells as reasonable baseline. The CNET-plots depict the enriched genes associated with (regulation of) acute response to antigenic stimuli signatures in rs6861(TT) steady-state CD4+ T cells (b), or the enriched genes associated with (regulation) of IL-1 and IL-1β production signatures in rs6861(CC) TCR/IL15 stimulated CD4+ T cells (d). e Targeted analysis of 26 Th-associated genes at steady-state indicates upregulated transcription of Treg-related genes and downregulation of Th17-related genes in rs6861(TT) CD4+ T cells at steady-state. f Single gene expression analysis (CPM) of IL17F (af n = 4 per genotype) upon TCR + IL-7-stimulation g and intracellular flow-cytometric analysis of IL-17F-protein expression indicates reduced IL-17F levels in rs6861(TT) compared to rs6861(CC) CD4+ T cells. h Frequency of Th17 cytokine-producing IL-17A+ and IL-22+ cells are reduced in rs6861(TT) compared to rs6861(CC) CD4+ T cells, while IL-10+ cell frequency is similar between genotypes as measured by intracellular flow cytometry. i Intracellular flow cytometry showing that Th17-transcription factor RORγτ is reduced and Treg-transcription factor FoxP3 is increased in rs6861(TT) compared to rs6861(CC) CD4+ T cells at steady-state (fi independent two-tailed t-tests). j Pharmaceutical treatment of rs6861(CC) CD4+ T cells with autophagy-enhancing compound MK-2206 (1 µM) reduces Th17-cell characteristics (dependent two-tailed t-tests). k Spider graphs displaying distribution of Th profiles according to transcription factors expression and cytokines produced by rs6861(TT) compared to rs6861(CC) CD4+ T cells at steady-state displaying an augmented Treg:Th17 ratio in rs6861(TT) genotyped individuals (gk: n = 5 per genotype). Reg. regulation, infl. inflammation, res. response, stim. stimulus, sign. signaling, pos. positive, diff. differentiation, prolif. proliferation, neg. negative, Imm. immune, CPM counts per million, U steady-state, untreated, TCR anti-CD3/CD28, act. activated, PI PMA/Ionomycin, TFs Transcription factors, MK. MK-2206. See Supplementary Tables 2 and 3, and Supplementary Fig. 9. Source data are provided as a Source Data file. RNA-seq. data are accessible through GEO Series accession number GSE253769.

References

    1. Maartens G, Celum C, Lewin SR. HIV infection: epidemiology, pathogenesis, treatment, and prevention. Lancet. 2014;384:258–271. doi: 10.1016/S0140-6736(14)60164-1. - DOI - PubMed
    1. Trickey A, et al. Survival of HIV-positive patients starting antiretroviral therapy between 1996 and 2013: a collaborative analysis of cohort studies. Lancet HIV. 2017;4:e349–e356. doi: 10.1016/S2352-3018(17)30066-8. - DOI - PMC - PubMed
    1. Taiwo B, Barcena L, Tressler R. Understanding and controlling chronic immune activation in the HIV-infected patients suppressed on combination antiretroviral therapy. Curr. HIV/AIDS Rep. 2013;10:21–32. doi: 10.1007/s11904-012-0147-3. - DOI - PubMed
    1. Schouten J, et al. Cross-sectional comparison of the prevalence of age-associated comorbidities and their risk factors between hiv-infected and uninfected individuals: the age HIV cohort study. Clin. Infect. Dis. 2014;59:1787–1797. doi: 10.1093/cid/ciu701. - DOI - PubMed
    1. Ribeiro CMS, et al. Receptor usage dictates HIV-1 restriction by human TRIM5α in dendritic cell subsets. Nature. 2016;540:448–452. doi: 10.1038/nature20567. - DOI - PubMed

Substances