. 2024 Mar 28;15(1):2707.
doi: 10.1038/s41467-024-46746-2.

The IL-33/ST2 axis is protective against acute inflammation during the course of periodontitis

Affiliations

The IL-33/ST2 axis is protective against acute inflammation during the course of periodontitis

Anhao Liu et al. Nat Commun. .

Abstract

Periodontitis, which is induced by repeated bacterial invasion and the ensuing immune reactions that follow, is the leading cause of tooth loss. Periodontal tissue is comprised of four different components, each with potential role in pathogenesis, however, most studies on immune responses focus on gingival tissue. Here, we present a modified ligature-induced periodontitis model in male mice to analyze the pathogenesis, which captures the complexity of periodontal tissue. We find that the inflammatory response in the peri-root tissues and the expression of IL-6 and RANKL by Thy-1.2- fibroblasts/stromal cells are prominent throughout the bone destruction phase, and present already at an early stage. The initiation phase is characterized by high levels of ST2 (encoded by Il1rl1) expression in the peri-root tissue, suggesting that the IL-33/ST2 axis is involved in the pathogenesis. Both Il1rl1- and Il33-deficient mice exhibit exacerbated bone loss in the acute phase of periodontitis, along with macrophage polarization towards a classically activated phenotype and increased neutrophil infiltration, indicating a protective role of the IL-33/ST2 axis in acute inflammation. Thus, our findings highlight the hidden role of the peri-root tissue and simultaneously advance our understanding of the etiology of periodontitis via implicating the IL-33/ST2 axis.


Conflict of interest statement

All authors declare no competing interests.

Figures
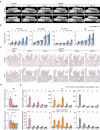
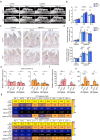
Fig. 1
Fig. 1. Comparison of the two types of ligature models and temporal mRNA expression profiling of cytokines.
a Representative maxillary μCT images. Scale bar, 1 mm. b Temporal change of bone loss on different tooth regions. From left to right: the first molar, the second molar, the third molar, and their sum (n = 4 mice per group). c Representative TRAP staining images. Scale bar, 300 μm. d mRNA expression of Il6 and the Tnfsf11/Tnfrsf11b ratio on the control side of the three tissues (on Day 1; GT = 1; n = 4 mice per group except for the group highlighted in Source Data file, which was n = 3 mice). e Temporal changes in mRNA expression of Il6 and the Tnfsf11/Tnfrsf11b ratio in the three tissues (control Day 1 of each tissue = 1; n = 4 mice per group except for the groups highlighted in Source Data file, which were n = 3 mice per group). GT gingival tissue, PRT peri-root tissue, BT bone tissue, D1 Day 1, D3 Day 3, D5 Day 5, D8 Day 8, D14 Day 14. Data are presented as the mean ± SEM. *P < 0.05; **P < 0.01; ***P < 0.001; ****P < 0.0001; ns (not significant), P > 0.05; by one-way ANOVA with multiple comparisons via Tukey’s test (d); and two-way ANOVA with multiple comparisons via Šídák’s method (b, e). The obvious outliers were evaluated and excluded by Grubb’s test (α = 0.05). Exact P values are presented in Supplementary Data. 1. Source data are provided as a Source Data file.
Fig. 2
Fig. 2. Verification of the local and systemic source of inflammation-related cytokines in initiation phase.
a, Changes in IL-6+ (a) and RANKL+ (d) cells in the GT and PRT with or without ligature placement. A representative contour plot is shown, and the percentages presented in the gates are the mean of three independent mouse experiments. be Heat map of the positive percentage of different IL-6+ (b) and RANKL+ (e) lineages in the ligated GT and PRT. The data from three independent experiments are shown (n = 3 mice per group, GT/PRT 1, 2, 3). c, f MFI (median fluorescence intensity) of different levels of IL-6+ (c) and RANKL+ (f) in the ligated GT and PRT (n = 3 mice per group). g, i Changes in RANKL+ (g) and IL-10+ (i) cells in the PBMC with or without ligature placement. The percentages shown in the gates are the mean of three independent mouse experiments, and a representative contour plot is shown. h, j Left: Heat map of the positive percentage of different RANKL+ (h) and IL-10+ (j) lineages in the ligated PBMC. Data from three independent experiments are shown (n = 3 mice per group, PBMC 1, 2, 3). Right: MFI of the different RANKL+ (h) and IL-10+ (j) lineage in the ligated PBMC (n = 3 mice per group). GT gingival tissue, PRT peri-root tissue, PBMC Peripheral blood mononuclear cell. Data are presented as the mean ± SEM except for (a, d, g, i). *P < 0.05; **P < 0.01; ***P < 0.001; ****P < 0.0001; ns (not significant), P > 0.05; by one-way ANOVA with multiple comparisons via Tukey’s test (c, f, j). The related gating strategy was presented in Supplementary Fig. 29. Exact P values are presented in Supplementary Data. 1. Source data are provided as a Source Data file.
Fig. 3
Fig. 3. Comprehensive analysis of three tissues in the initiation phase and the discovery of the involvement of the IL-33/ST2 axis.
a KEGG pathway enrichment analysis based on the upregulated DEGs in the GT and PRT using GO/KEGG enrichment analysis tools based on clusterProfiler in Hiplot (Benjamini & Hochberg-method adjusted P value < 0.05; false discovery rate < 0.1; fold-change of normalized counts ≥ 2). The top 20 pathways are shown with their expression counts and adjusted (Benjamini & Hochberg method) P value. b Volcano plots of DEGs in the GT and PRT. The top 5 genes with the highest adjusted P value were annotated. DEG differentially expressed gene. ceg mRNA expression level of Il1rl1 (c), Il1rl1 variant 1 (e), and Il33 (g) on the control side of three tissues (on Day 1; GT = 1; n = 4 mice per group except for the groups highlighted in Source Data file, which were n = 3 mice per group). d, f, h Temporal change in the mRNA expression of Il1rl1 (d), Il1rl1 variant 1 (f), and Il33 (h) in the three tissues (control Day 1 of each tissue = 1; n = 4 mice per group except for the groups highlighted in Source Data file, which were n = 3 mice per group). GT gingival tissue, PRT peri-root tissue, BT bone tissue, D1 Day 1, D3 Day 3, D5 Day 5, D8 Day 8, D14 Day 14. Data are presented as the mean ± SEM. *P < 0.05; **P < 0.01; ***P < 0.001; ****P < 0.0001; ns (not significant), P > 0.05; by one-way ANOVA with multiple comparisons via Tukey’s test (c, e, g); and two-way ANOVA with multiple comparisons via Šídák’s method (d, f, h). The obvious outliers were evaluated and excluded by Grubb’s test (α = 0.05). Exact P values are presented in Supplementary Data. 1. Source data are provided as a Source Data file.
Fig. 4
Fig. 4. Verification of the source of ST2 and IL-33 in initiation phase.
a, b Changes in ST2+ (a) and IL-33+ (b) cells in the GT and PRT with or without ligature placement. A representative contour plot is shown, and the percentages in the gates are the mean of three independent mouse experiments. cd Sunburst map showing the composition of ST2+CD45 (c) and IL-33+CD45 (d) cells in the GT and PRT. The percentages of the populations shown are the mean of three independent mouse experiments. e, f MFI (Median fluorescence intensity) of the different ST2+CD45 (e) and IL-33+CD45 (f) lineages in the ligated GT and PRT (n = 3 mice per group). g, h Representative immunofluorescence staining images of three independent experiments of ST2 (g) and IL-33 (h) are shown with membrane marker proteins in the second molar region. Scale bar, 300 μm. T Tooth, NS nonspecific signal, GT gingival tissue, PRT peri-root tissue, BT bone tissue. Data are presented as the mean ± SEM for (e, f). *P < 0.05; **P < 0.01; ***P < 0.001; ****P < 0.0001; ns (not significant), P > 0.05; by one-way ANOVA with multiple comparisons via Dunnett’s test (e, f). The related gating strategy is shown in Supplementary Fig. 29 (a, b), 30 (cf). Exact P values are presented in Supplementary Data 1. Source data are provided as a Source Data file.
Fig. 5
Fig. 5. Ligature placement of knockout mice indicating that the IL-33/ST2 axis plays a protective role in acute phase.
a Representative maxillary μCT images of four independent mouse experiments on day 5, 8 and 14. Scale bar, 1 mm. b Total bone loss in knockout mice compared to WT mice (n = 4 mice per group). c Representative TRAP staining images of four independent mouse experiments on day 5 and 8. Scale bar, 300 μm. d Upper: Temporal change in the osteoclast number per bone surface in the second molar region (n = 4 mice per group); Lower: Temporal change in the eroded surface per bone surface in the second molar region (n = 4 mice per group). ef Temporal change in the Tnfsf11/Tnfrsf11b ratio (e) and Il6 (f) in the GT and PRT between mouse strains (control Day 5 of each tissue in each strain = 1; n = 4 mice per group except for the groups highlighted in Source Data file, which were n = 3 mice per group). g Heat map of the positive percentage of different IL-6+ lineages in the ligated GT and PRT. The data from three independent experiments are shown (n = 3 mice per group, GT/PRT 1, 2, 3). GT gingival tissue, PRT peri-root tissue. Data are presented as the mean ± SEM. *P < 0.05; **P < 0.01; ***P < 0.001; ****P < 0.0001; ns (not significant), P > 0.05; by two-way ANOVA with multiple comparisons via Dunnett’s test (b, e, d, f). The obvious outliers were evaluated and excluded by Grubb’s test (α = 0.05). The related gating strategy is shown in Supplementary Fig. 29 (g). Exact P values are presented in Supplementary Data. 1. Source data are provided as a Source Data file.
Fig. 6
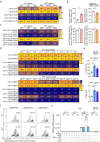
Fig. 6. mST2 positive cell populations and alteration of cell composition in mice lacking Il33 or Il1rl1.
a, c Heat map of the percentage of different mST2+ lineages in the ligated GT and PRT with two gating strategies (a, in live cells; c, in mST2+CD11b+ cells). The data from three independent experiments are shown (n = 3 mice per group, GT/PRT 1, 2, 3). b Changes in the cell number and percentages (in mST2+CD45+ cells) of mST2+CD45+CD11b+MHCII+ lineages in the GT and PRT (n = 3 mice per group). d Heat map of the percentage of different myeloid sublineages (in CD11b+ cells) in the ligated GT and PRT. The data from three independent experiments are shown (n = 3 mice per group, GT/PRT 1, 2, 3). e Changes in the ratio of M1 macrophage (CD11b+MHCII+CD11cCD86+CD206 cells) number to M2 macrophage (CD11b+MHCIICD11cCD86CD206+ cells) number in the ligated GT and PRT (n = 3 mice per group). f Changes in Ly-6G+ neutrophils in the ligated GT and PRT with ligature placement. A representative contour plot of three independent mouse experiments is shown, and the percentages presented in the gates are the mean of them. g mRNA expression of Arg1 of the in vitro polarized macrophages differentiated from the BMDM of WT and Il1rl1–/– mice. WT M0 Control (no treatment with rmIL-33) = 1; n = 3 mice per group. GT gingival tissue, PRT peri-root tissue, BMDM bone marrow-derived macrophage. Data are presented as the mean ± SEM. *P < 0.05; **P < 0.01; ***P < 0.001; ****P < 0.0001; ns (not significant), P > 0.05; by two-side unpaired t-test with Welch’s correction (b, e); and by two-way ANOVA with multiple comparisons via Tukey’s test (g). The related gating strategy was shown in Supplementary Fig. 29 (a, b), 31 (c–e), 32 (f). Exact P values are presented in Supplementary Data. 1. Source data are provided as a Source Data file.
Fig. 7
Fig. 7. Schematic illustration of inflammatory gene expression profiles in the course of periodontitis and the role of the IL-33/ST2 axis against acute inflammation.
a Visualization of the mRNA expression of key cytokines throughout the pathogenetic process of periodontitis in the three tissues. The scale of the cytokine circles is based on the minimum expression tissue on the control side on day 1. The size ratio of the circles in the normal part is disproportionate to the subsequent parts to show the expression differences between the tissues more clearly. b Visualization of the possible mechanism of the pathogenesis in IP and the possible working mechanism of the IL-33/ST2 axis. The diagram was divided by dot line into two parts: the left side represents the normal situation, and the right side represents the Il33- or Il1rl1-deficient situation. mST2 membrane form of ST2, sST2 soluble form of ST2, GT gingival tissue, PRT peri-root tissue, BT bone tissue.

References

    1. Hajishengallis G, Chavakis T. Local and systemic mechanisms linking periodontal disease and inflammatory comorbidities. Nat. Rev. Immunol. 2021;21:426–440. doi: 10.1038/s41577-020-00488-6. - DOI - PMC - PubMed
    1. World Health Organization. Global Oral Health Status Report: Towards Universal Health Coverage for Oral Health by 2030. (World Health Organization, 2022).
    1. Hajishengallis G. Periodontitis: from microbial immune subversion to systemic inflammation. Nat. Rev. Immunol. 2015;15:30–44. doi: 10.1038/nri3785. - DOI - PMC - PubMed
    1. Beck JD, Papapanou PN, Philips KH, Offenbacher S. Periodontal medicine: 100 years of progress. J. Dent. Res. 2019;98:1053–1062. doi: 10.1177/0022034519846113. - DOI - PubMed
    1. Brkić Z, Pavlić V. Periodontology – the historical outline from ancient times until the 20th century. Vojnosanit Pregl. 2017;74:193–199. doi: 10.2298/VSP150612169B. - DOI