. 2024 Mar 28;15(1):2722.
doi: 10.1038/s41467-024-46707-9.

A midbrain GABAergic circuit constrains wakefulness in a mouse model of stress

Affiliations

A midbrain GABAergic circuit constrains wakefulness in a mouse model of stress

Shuancheng Ren et al. Nat Commun. .

Abstract

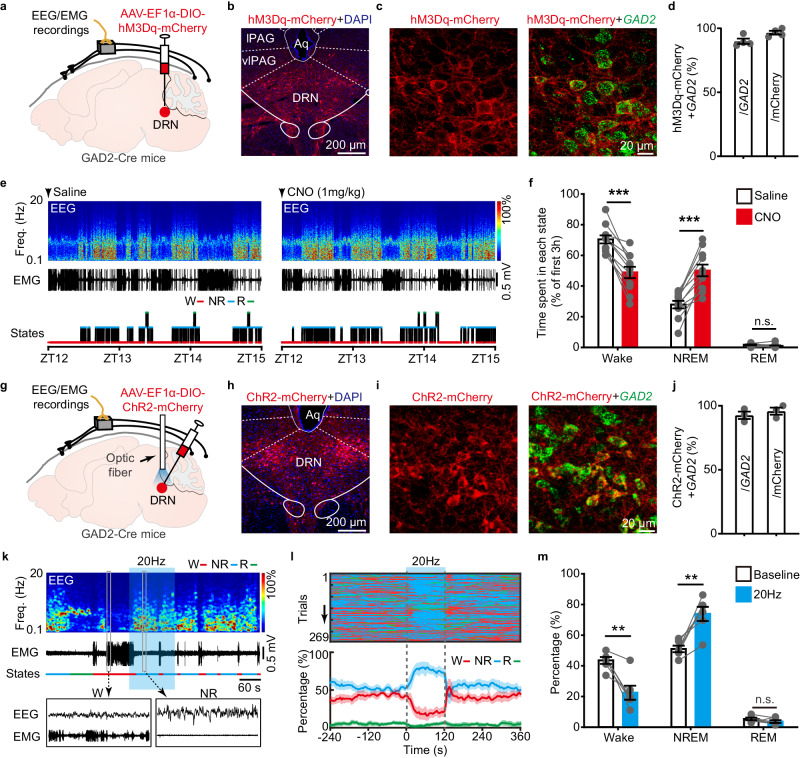
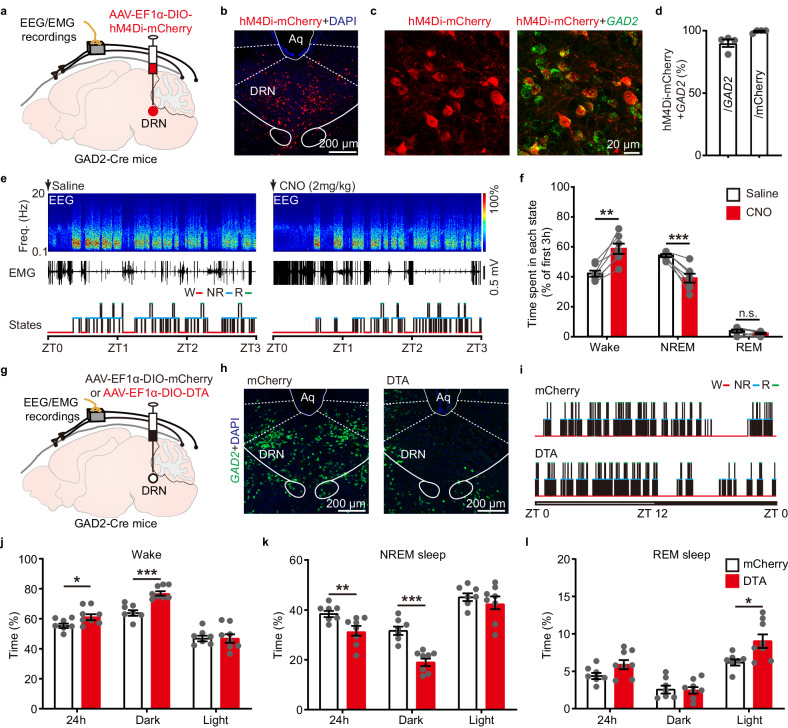
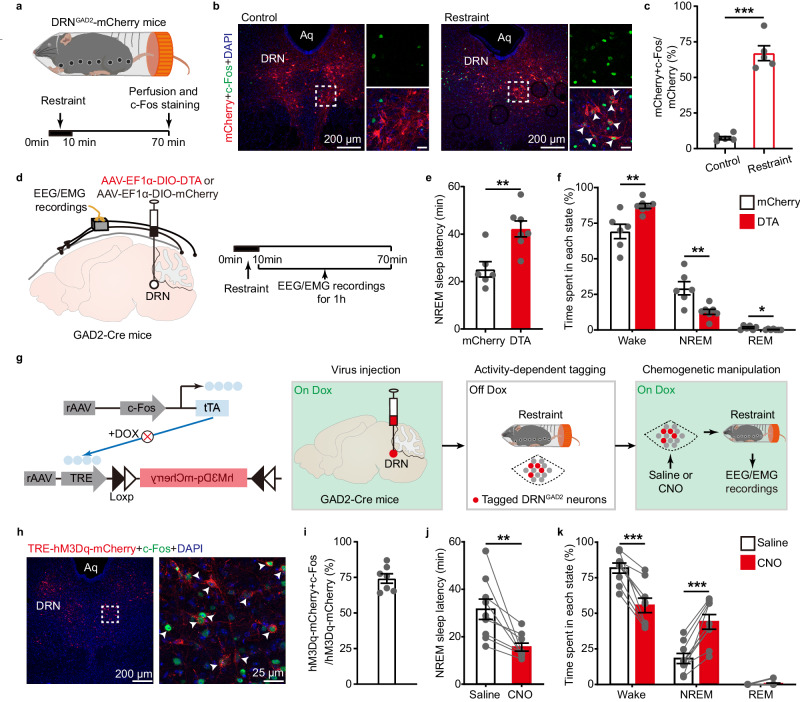
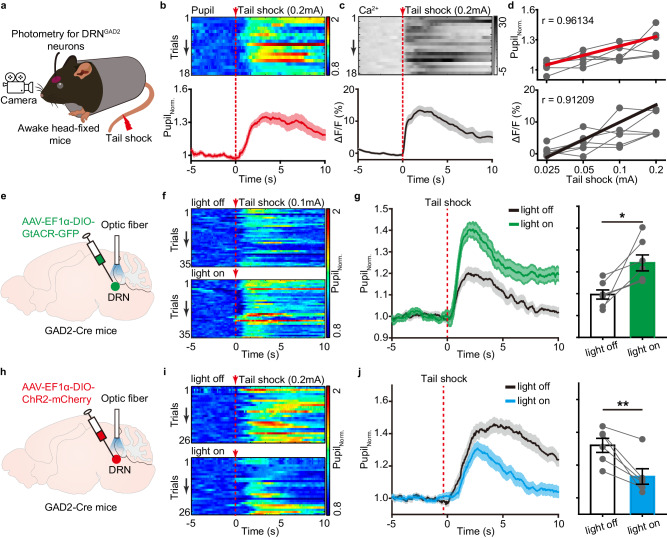
Enhancement of wakefulness is a prerequisite for adaptive behaviors to cope with acute stress, but hyperarousal is associated with impaired behavioral performance. Although the neural circuitries promoting wakefulness in acute stress conditions have been extensively identified, less is known about the circuit mechanisms constraining wakefulness to prevent hyperarousal. Here, we found that chemogenetic or optogenetic activation of GAD2-positive GABAergic neurons in the midbrain dorsal raphe nucleus (DRNGAD2) decreased wakefulness, while inhibition or ablation of these neurons produced an increase in wakefulness along with hyperactivity. Surprisingly, DRNGAD2 neurons were paradoxically wakefulness-active and were further activated by acute stress. Bidirectional manipulations revealed that DRNGAD2 neurons constrained the increase of wakefulness and arousal level in a mouse model of stress. Circuit-specific investigations demonstrated that DRNGAD2 neurons constrained wakefulness via inhibition of the wakefulness-promoting paraventricular thalamus. Therefore, the present study identified a wakefulness-constraining role DRNGAD2 neurons in acute stress conditions.


Conflict of interest statement

The authors declare no competing interests.

Figures

Fig. 1
Fig. 1. Chemogenetic or optogenetic activation of DRNGAD2 neurons decreases wakefulness.
a Schematic of viral injection and EEG/EMG recordings. AAV-EF1α-DIO-hM3Dq-mCherry was injected into the DRN of GAD2-Cre mice for chemogenetic activation. b, c Representative images showing the expression of hM3Dq-mCherry in the DRN (b) and the colocalization of hM3Dq-mCherry with GAD2 mRNA (c). lPAG, lateral periaqueductal gray; vlPAG, ventrolateral periaqueductal gray; Aq, aqueduct. d Quantitative analysis of the efficiency and specificity of hM3Dq-mCherry to label DRNGAD2 neurons. n = 4 mice. e EEG power spectrogram, EMG traces, and hypnograms from a DRNGAD2-hM3Dq mouse during 3 h post saline (left) or CNO (1 mg/kg, right) injection. Freq., frequency; W, wake; NR: NREM; R: REM. f Time spent in each state during the first 3 h after saline or CNO injection. n = 11 mice, two tailed paired t test, wake: t10 = 7.248, P = 2.76 × 10−5; NREM: t10 = 7.128, P = 3.19 × 10−5; REM: t10 = 1.703, P = 0.119. g Schematic of viral injection and EEG/EMG recordings. AAV-EF1α-DIO-ChR2-mCherry was injected into the DRN of GAD2-Cre mice for optogenetic activation. h, i Example images showing the expression of ChR2-mCherry in the DRN (h) and the colocalization of ChR2-mCherry with GAD2 mRNA (i). j Quantitative analysis of the efficiency and specificity of ChR2-mCherry to label DRNGAD2 neurons. n = 3 mice. k EEG power spectrogram, EMG trace, and hypnogram showing optogenetic activation of DRNGAD2 neurons from a DRNGAD2-ChR2 mouse during the light phase. Laser stimulation is indicated by blue stripe. l Top, brain states of recorded trials from DRNGAD2-ChR2 mice. Bottom, percentage of wake, NREM, or REM sleep around 20 Hz stimulation of DRNGAD2-ChR2 mice. Shading represents ±SEM. m Quantification of time spent in each state 120 s before and during optogenetic stimulation of DRNGAD2 neurons. n = 6 mice, two tailed paired t test, wake: t5 = 4.775, P = 0.00499; NREM: t5 = 5.243, P = 0.00335; REM: t5 = 1.425, P = 0.214. **P < 0.01, ***P < 0.001, n.s., not significant. Data (d, f, j, m) are presented as mean ± SEM.
Fig. 2
Fig. 2. Inhibition or ablation of DRNGAD2 neurons increases wakefulness.
a Schematic of viral injection and EEG/EMG recordings. AAV-EF1α-DIO-hM4Di-mCherry was injected into the DRN of GAD2-Cre mice for chemogenetic inhibition. b, c Representative images showing the expression of hM4Di-mCherry in the DRN (b) and the colocalization of hM4Di-mCherry with GAD2 mRNA (c). Aq, aqueduct. d Quantitative analysis of the efficiency and specificity of hM4Di-mCherry to label DRNGAD2 neurons. n = 4 mice. e EEG power spectrogram, EMG traces, and hypnograms from a DRNGAD2-hM4Di mouse during 3 h post saline (left) or CNO injection (2 mg/kg, right). Freq., frequency; W, wake; NR: NREM; R: REM. f Time spent in each state during the first 3 h after saline or CNO injection. n = 7 mice, two tailed paired t test for wake and NREM, wake: t7 = 5.85, P = 0.0011; NREM: t7 = 5.971, P = 0.00099. For REM, Wilcoxon signed rank test, W = 11, P = 0.313. g Schematic of viral injection and EEG/EMG recordings. AAV-EF1α-DIO-DTA or AAV-EF1α-DIO-mCherry was injected into the DRN of GAD2-Cre mice. h Images showing the expression of GAD2 mRNA in GAD2-Cre mice injected with mCherry or DTA. i Examples of hypnograms from a mCherry mouse or DTA mouse across 24 h light/dark cycle. jl Quantitative analysis of percentage of time spent in wakefulness (j), NREM sleep (k) and REM sleep (l) during 24 h, dark, and light phase. n = 7 for mCherry mice and n = 8 for DTA mice, two tailed unpaired t test. For wakefulness in (j), 24 h: t13 = 2.221, P = 0.0447; dark: t13 = 5.685, P = 7.48×10⁻⁵; light: t13 = 0.25, P = 0.807. For NREM sleep in (k), 24 h: t13 = 3.031, P = 0.00965; dark: t13 = 5.662, P = 7.77 × 105; light: t13 = 0.914, P = 0.377. For REM sleep in (l), 24 h: t13 = 1.992, P = 0.0678; dark: t13 = 0.175, P = 0.864; light: t13 = 2.715, P = 0.0177. *P < 0.05, **P < 0.01, ***P < 0.001, n.s., not significant. Data (d, f, jl) are presented as mean ± SEM.
Fig. 3
Fig. 3. DRNGAD2 neurons display wakefulness-dependent populational activities.
a Schematic of fiber photometry and simultaneous EEG/EMG recordings. AAV-EF1α-DIO-jGCaMP7b was injected into the DRN of GAD2-Cre mice. b, c Representative images showing the expression of jGCaMP7b in the DRN (b) and the colocalization of jGCaMP7b with GAD2 mRNA (c). Aq, aqueduct. d Quantitative analysis of the efficiency and specificity of jGCaMP7b to label DRNGAD2 neurons. n = 3 mice. e Representative EEG spectrogram, EEG/EMG traces, color-coded brain states and Ca2+ fluorescence trace across different wakefulness/sleep states. Freq., frequency; W, wake; NR: NREM; R: REM. f Quantification of ΔF/F during wake, NREM sleep and REM sleep. n = 9 mice, one way ANOVA followed by Tukey post hoc test, F2,24 = 8.38, wake vs NREM: P = 0.032, wake vs REM: P = 0.002. g Comparison of ΔF/F during long- and short-bout wakefulness. n = 9 mice, two tailed paired t test, t8 = 4.687, P = 0.00157. hk Ca2+ activities of DRNGAD2 neurons during transitions from wake to NREM sleep (h), NREM sleep to wake (i), NREM to REM sleep (j), and REM sleep to wake (k). n = 9 mice, two tailed paired t test (hj). For (h), t8 = 12.075, P = 2.04 × 10–6; for (i), t8 = 5.865, P = 3.76 × 104; for (j), t8 = 1.273, P = 0.251. For k, Wilcoxon signed rank test, W = 45, P = 0.004. Shading represents ±SEM. l Schematic experimental setup for simultaneous photometry and pupil recording in awake head-fixed mice. m Representative pupil (top) and Ca2+ (bottom) traces during spontaneous pupil size recording. PupilMax, max pupil size. n Heatmaps showing all pupil dilation bouts (top) and corresponding Ca2+ signals (bottom) extracted from 6 recorded mice. The vertical red lines indicate the onset of pupil dilation. PupilNorm., normalized pupil size. o Average traces of pupil size (red) and Ca2+ signals (dark) aligned to onset of pupil dilation. Shading represents ±SEM. p Cumulative probability distribution of all the Pearson correlation coefficients of Ca2+ signals of DRNGAD2 neurons with pupil size. The gray area indicates the non-significant Pearson correlation coefficients. *P < 0.05, **P < 0.01, ***P < 0.001, n.s., not significant. Data (d, fk) are presented as mean ± SEM.
Fig. 4
Fig. 4. DRNGAD2 neurons constrain wakefulness in acute stress condition.
a Schematic of a 10 min restraint stress session following c-Fos staining in DRNGAD2-mCherry mice. b Representative images showing c-Fos expression in DRNGAD2-mCherry mice from control (left) or restraint group (right). Zoomed images are enlarged views of the dashed areas. Arrowheads indicate mCherry and c-Fos co-labeled neurons. Scale bars in the right panels are 25 μm. Aq, aqueduct. c Number of mCherry and c-Fos co-labeled neurons in control and restraint group. n = 5 mice for each group, two tailed unpaired t test, t8 = 11.056, P = 3.99 × 10−6. d Schematic of a 10 min restraint stress session and the following EEG/EMG recordings in DRNGAD2-mCherry or DRNGAD2-DTA mice. e NREM sleep onset latency following a 10 min restraint session. n = 6 for mCherry mice and n = 7 for DTA mice, two tailed unpaired t test, t11 = 3.638, P = 0.0039. f Time spent in wake, NREM sleep and REM sleep. n = 6 for mCherry mice and n = 7 for DTA mice, two tailed unpaired t test, wake: t11 = 3.554, P = 0.00452, NREM: t11 = 3.561, P = 0.00446; REM: t11 = 2.374, P = 0.0369. g Schematic of experimental protocol for c-Fos-based activity tagging method to label restraint stress-activated DRNGAD2 neurons with TRE-hM3Dq-mCherry. h, i Representative images (h) and quantification (i) of the specificity of TRE-hM3Dq-mCherry to label restraint stress-activated DRNGAD2 neurons. Arrowheads indicate TRE-hM3Dq-mCherry and c-Fos co-labeled neurons. n = 7 mice in (i). j NREM sleep onset latency following a 10 min restraint session. n = 9 mice, Wilcoxon signed rank test, W = 45, P = 0.004. k Time spent in wake, NREM sleep and REM sleep post saline or CNO injections in restraint stress conditions. n = 9 mice, two tailed paired t test, wake: t8 = 6.708, P = 1.51 × 104; NREM: t8 = 6.618, P = 1.66×10⁻⁴. *P < 0.05, **P < 0.01, ***P < 0.001. Data (c, e, f, ik) are presented as mean ± SEM.
Fig. 5
Fig. 5. DRNGAD2 neurons control the arousal responses to tail shock.
a Schematic of experimental setup for photometry recording and delivery of tail shock in awake head-fixed mice. b, c Heatmaps (top) and average traces (bottom) of pupil size (b) or Ca2+ activities of DRNGAD2 neurons (c) aligned to the onset of tail shock (vertical red lines). PupilNorm., normalized pupil size. d The effects of different amplitude of tail shock on pupil size (top) and Ca2+ activities of DRNGAD2 neurons (bottom). n = 6 mice. e Schematic of viral injection for optogenetic inhibition of DRNGAD2 neurons. AAV-EF1α-DIO-GtACR-GFP was injected into the DRN of GAD2-Cre mice. f Heatmaps showing tail shock induced-changes of pupil size in DRNGAD2-GtACR mice. g Tail shock with simultaneous inhibition of DRNGAD2 neurons induces more pronounced increase of pupil size. n = 7 mice, Wilcoxon signed rank test, W = 28, P = 0.016. Shading in line graph represents ±SEM. h Schematic of viral injection for optogenetic activation of DRNGAD2 neurons. AAV-EF1α-DIO-ChR2-mCherry was injected into the DRN of GAD2-Cre mice. i Heatmaps showing the effects of optogenetic stimulation on tail shock induced-changes of pupil size in DRNGAD2-ChR2 mice. j Optogenetic activation of DRNGAD2 neurons attenuates tail shock-induced increase of pupil size. n = 6 mice, two tailed unpaired t test, t5 = 4.391, P = 0.00708. Shading in line graph represents ±SEM. *P < 0.05, **P < 0.01. Data (bar graphs in g, j) are presented as mean ± SEM.
Fig. 6
Fig. 6. DRNGAD2 neurons send monosynaptic inhibitory inputs to PVT neurons.
a AAV-EF1α-DIO-EGFP expression in the DRN. Aq, aqueduct. b Representative images showing the distribution of axon fibers of DRNGAD2 neurons in the PVT. D3V, dorsal third ventricle. c Quantification of relative projection density of DRNGAD2 neurons along rostral to caudal axis of the PVT. n = 4 mice, Kruskal-Wallis one way ANOVA on ranks, H = 20.46, P = 0.001. d Schematic of viral injection for retrograde tracing the presynaptic inputs of PVT glutamatergic neurons. e Representative images showing the location of start cells in the PVT. Scale bar in the right panel is 20 μm. f Images showing the RV-dsRed-labeled DRN neurons and their co-localization with GAD2. Arrowheads indicate dsRed and GAD2 co-labeled neurons. Scale bar in the right panels is 20 μm. g Quantification the percentage of GAD2-, Tph2-, or TH-positive DRN neurons projecting to PVT glutamatergic neurons. n = 4 mice, Kruskal-Wallis one way ANOVA on ranks following Student-Newman-Keuls multiple comparisons test, H = 9.881, GAD2 vs Tph2: P = 0.021; GAD2 vs TH: P = 0.005. h Schematic diagram of whole-cell recording in the PVT. AAV-DIO-EF1α-ChR2-mCherry was injected into the DRN of GAD2-Cre mice. Recordings were made from PVT neurons with simultaneous optogenetic stimulation of terminals of DRNGAD2 neurons. i Light-evoked action potentials of DRNGAD2 neurons verify the expression efficacy of ChR2-mCherry. j Light-evoked postsynaptic currents in recorded PVT neurons. The dark lines indicate average traces and gray lines indicate responses of individual cells. n = 10 cells. ACSF artificial cerebrospinal fluid, TTX tetrodotoxin, 4-AP 4-Aminopyridine. k Latency (left) and amplitude (right) of light-evoked postsynaptic currents in ASCF conditions. n = 10 cells. l Summary of the amplitude of light-evoked currents normalized to that in ACSF. n = 10 cells, Friedman repeated measures ANOVA on ranks following Student-Newman-Keuls multiple comparisons test, H = 33.515, ACSF vs TTX: P = 5.4 × 10−5; TTX + 4AP vs TTX + 4AP+ bicuculine: P = 5.4 × 10−5; TTX vs TTX + 4AP: P = 0.9. Norm., normalized. m Bicuculine blocks the 10 Hz and 20 Hz light pulses-induced postsynaptic currents. n = 6 cells. *P < 0.05, ***P < 0.001, n.s., not significant. Data (c, g, k, l) are presented as mean ± SEM.
Fig. 7
Fig. 7. The DRNGAD2-PVT circuit constrains wakefulness in acute stress condition.
a Schematic of chemogenetic activation of PVT-projecting DRNGAD2 neurons and EEG/EMG recordings. Retro-AAV-FLExloxP-FLP was injected into the PVT and AAV-FLExFRT-hM3Dq-GFP was injected into the DRN of GAD2-Cre mice, respectively. b Representative image showing the expression of hM3Dq-GFP in the DRN. Aq, aqueduct. c EEG power spectrogram, EMG traces, and hypnograms from a DRNGAD2-PVT-hM3Dq mouse during 3 h post saline or CNO (1 mg/kg) injection. Freq., frequency; W, wake; NR: NREM; R: REM. d, Chemogenetic activation of PVT-projecting DRNGAD2 neurons decreases wakefulness. n = 6 mice, two tailed paired t test, wake: t5 = 3.701, P = 0.014; NREM: t5 = 3.48, P = 0.017; REM: t5 = 2.123, P = 0.0872. e Schematic of a 10 min restraint session and following EEG/EMG recordings in DRNGAD2-PVT-hM3Dq mice. f NREM sleep onset latency following a 10 min restraint session. n = 7 mice, two tailed paired t test, t6 = 4.2, P = 0.00569. g Time spent in wake, NREM and REM sleep of DRNGAD2-PVT-hM3Dq mice following restraint. n = 7 mice, two tailed paired t test, wake: t6 = 4.555, P = 0.00387; NREM: t6 = 4.653, P = 0.00349. h Schematic of optogenetic activation of DRNGAD2-PVT circuit. AAV-EF1α-DIO-ChR2-mCherry was injected into the DRN of GAD2-Cre mice and an optic fiber was placed above the PVT. i Heatmaps showing the effects of optogenetic stimulation on tail shock-induced changes of pupil size. j, k Optogenetic activation of DRNGAD2-PVT circuit attenuates tail shock-induced increase of pupil size. n = 6 mice, two tailed paired t test, t5 = 8.63, P = 3.45 × 104. Shading in j represents ±SEM. *P < 0.05, **P < 0.01, ***P < 0.001, n.s., not significant. Data (d, f, g, k) are presented as mean ± SEM.

References

    1. Saper CB, Fuller PM, Pedersen NP, Lu J, Scammell TE. Sleep state switching. Neuron. 2010;68:1023–1042. doi: 10.1016/j.neuron.2010.11.032. - DOI - PMC - PubMed
    1. Scammell TE, Arrigoni E, Lipton JO. Neural circuitry of wakefulness and sleep. Neuron. 2017;93:747–765. doi: 10.1016/j.neuron.2017.01.014. - DOI - PMC - PubMed
    1. Anafi RC, Kayser MS, Raizen DM. Exploring phylogeny to find the function of sleep. Nat. Rev. Neurosci. 2019;20:109–116. doi: 10.1038/s41583-018-0098-9. - DOI - PubMed
    1. McGinley MJ, et al. Waking state: rapid variations modulate neural and behavioral responses. Neuron. 2015;87:1143–1161. doi: 10.1016/j.neuron.2015.09.012. - DOI - PMC - PubMed
    1. Aime M, Adamantidis AR. Sleep to survive predators. Neurosci. Bull. 2022;38:1114–1116. doi: 10.1007/s12264-022-00875-0. - DOI - PMC - PubMed

LinkOut - more resources