. 2024 Mar 28;10(1):157.
doi: 10.1038/s41420-024-01924-5.

Macrophage migration inhibitory factor blockade reprograms macrophages and disrupts prosurvival signaling in acute myeloid leukemia

Affiliations

Macrophage migration inhibitory factor blockade reprograms macrophages and disrupts prosurvival signaling in acute myeloid leukemia

Caroline Spertini et al. Cell Death Discov. .

Abstract

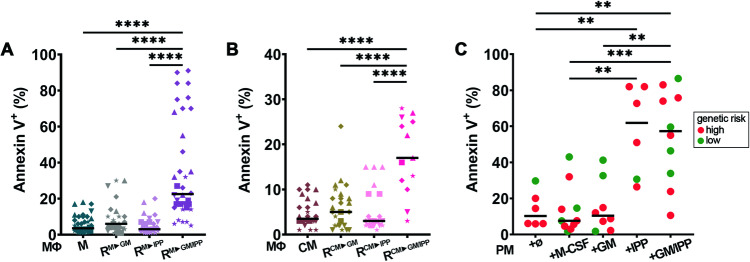
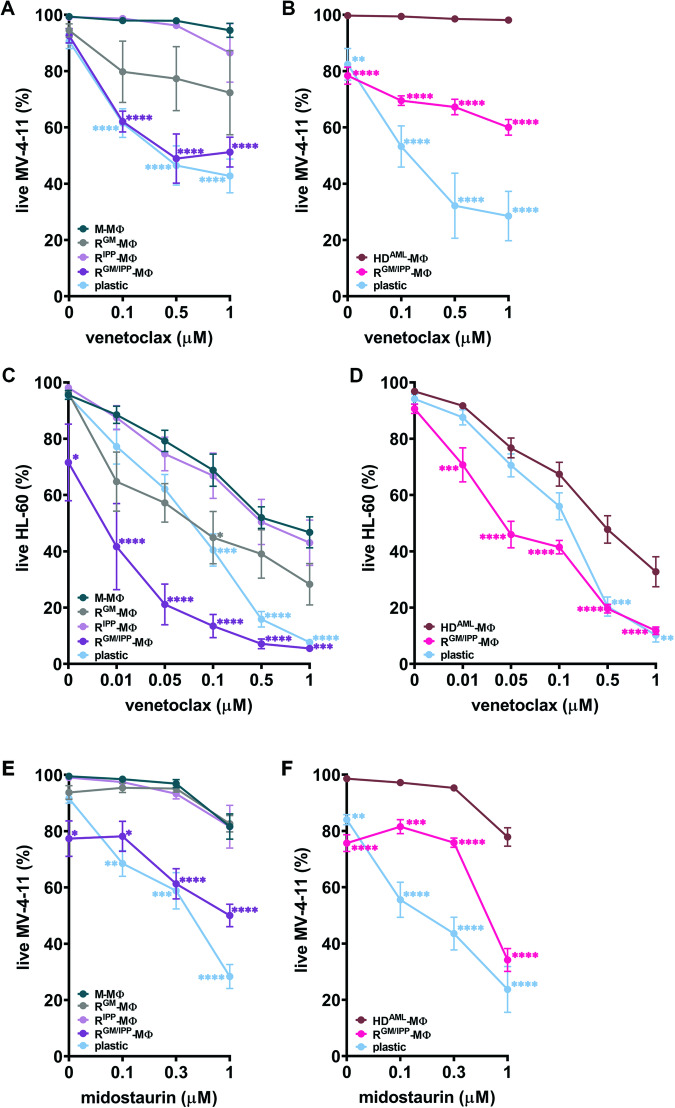
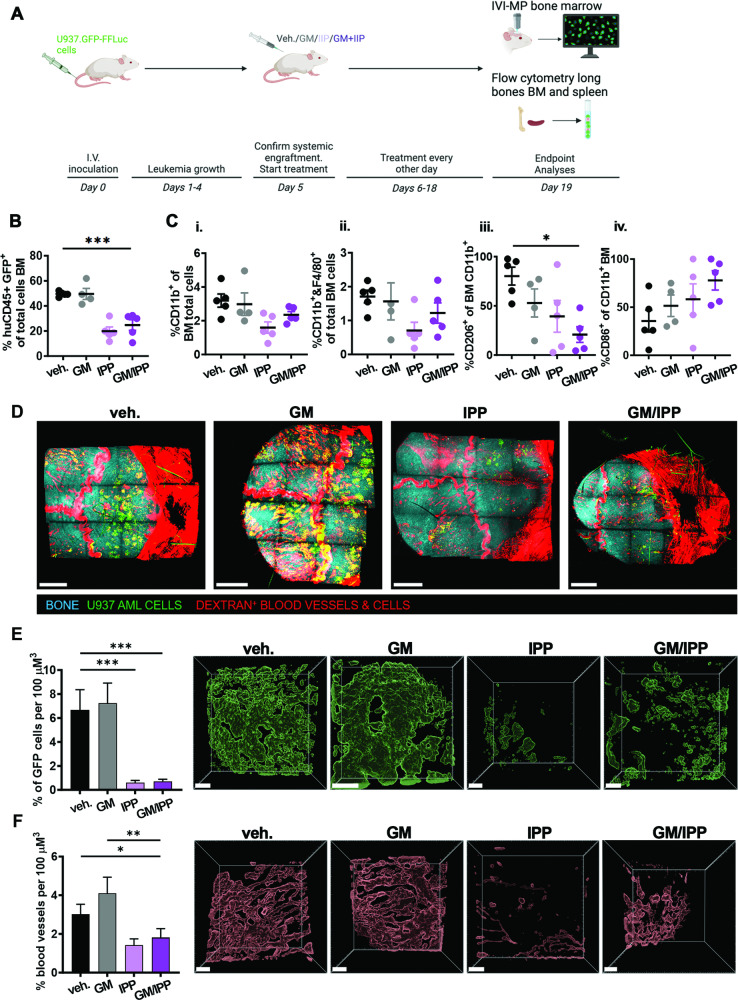
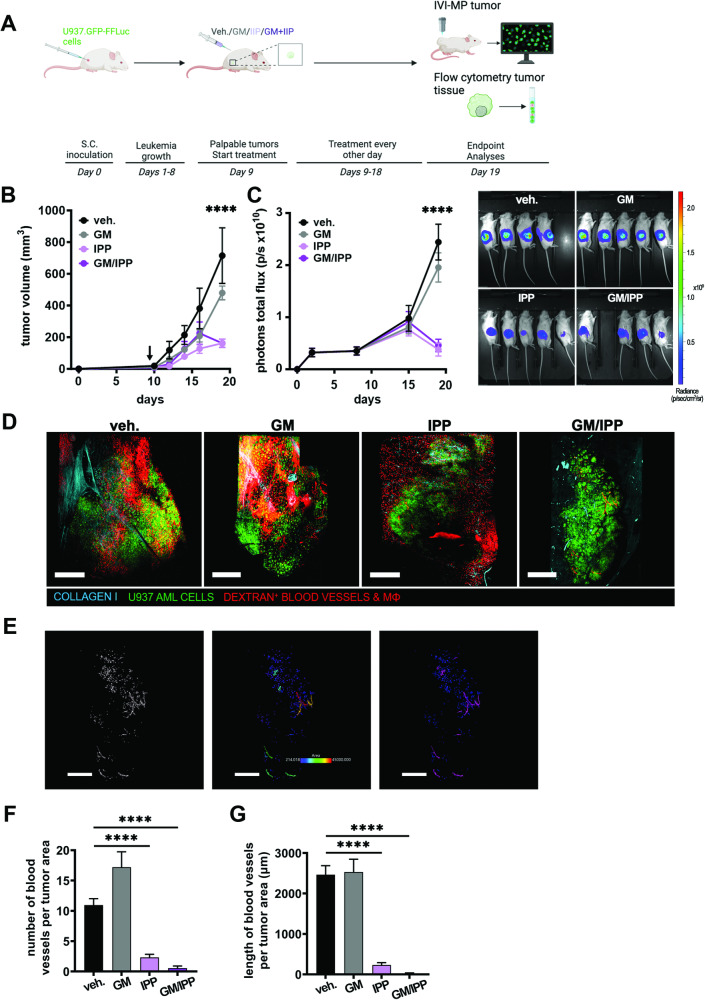
The malignant microenvironment plays a major role in the development of resistance to therapies and the occurrence of relapses in acute myeloid leukemia (AML). We previously showed that interactions of AML blasts with bone marrow macrophages (MΦ) shift their polarization towards a protumoral (M2-like) phenotype, promoting drug resistance; we demonstrated that inhibiting the colony-stimulating factor-1 receptor (CSF1R) repolarizes MΦ towards an antitumoral (M1-like) phenotype and that other factors may be involved. We investigated here macrophage migration inhibitory factor (MIF) as a target in AML blast survival and protumoral interactions with MΦ. We show that pharmacologically inhibiting MIF secreted by AML blasts results in their apoptosis. However, this effect is abrogated when blasts are co-cultured in close contact with M2-like MΦ. We next demonstrate that pharmacological inhibition of MIF secreted by MΦ, in the presence of granulocyte macrophage-colony stimulating factor (GM-CSF), efficiently reprograms MΦ to an M1-like phenotype that triggers apoptosis of interacting blasts. Furthermore, contact with reprogrammed MΦ relieves blast resistance to venetoclax and midostaurin acquired in contact with CD163+ protumoral MΦ. Using intravital imaging in mice, we also show that treatment with MIF inhibitor 4-IPP and GM-CSF profoundly affects the tumor microenvironment in vivo: it strikingly inhibits tumor vasculature, reduces protumoral MΦ, and slows down leukemia progression. Thus, our data demonstrate that MIF plays a crucial role in AML MΦ M2-like protumoral phenotype that can be reversed by inhibiting its activity and suggest the therapeutic targeting of MIF as an avenue towards improved AML treatment outcomes.


Conflict of interest statement

The authors declare no competing interests.

Figures

Fig. 1
Fig. 1. MIF inhibitors induce blast apoptosis, but BM cells are protective.
A and B The indicated leukemia cell lines were cultured for 72 h with increasing doses of A 4-iodo-6-phenylpyrimidine (4-IPP) or B ISO-1 and then analyzed for apoptosis by flow cytometry staining with Annexin V. Mean ± SEM of at least three independent experiments is illustrated. C Each curve represents one experiment with blasts from 6 acute myeloid leukemia patients with high (#19, 23, 29, 38; red curves) or intermediate (#10, 13; blue curves) genetic risk was exposed to increasing concentrations of 4-IPP for 4–7 days. Blast cell death was identified by Annexin V staining and analyzed by flow cytometry. D U937 cell line was cultured in plastic wells or co-cultured on M-MΦ or HS-5 or EA.hy926 monolayers ±50 μM 4-IPP (or vehicle = DMSO) ± Transwells (TW) for 72 h, after which apoptosis was detected with Annexin V staining. The median is represented by a horizontal line. n = 3–23 technical repeats from n ≥ 3 biological repeats. ****p < 0.0001.
Fig. 2
Fig. 2. CD163 expression on macrophages is downregulated with 4-IPP and reprogramming conditions.
A HD monocytes were cultured for 7 days in a conditioned medium from primary patient blasts (red) or leukemia cell lines (black symbols), supplemented with DMSO or 50 μM 4-IPP (IPP) before analyzing CD163 expression by flow cytometry. The conditioned medium was from ★ = HL-60, ▲ = NB4, and ♦ = U937, red dots symbolize primary acute myeloid leukemia of high genetic risk; n = 16. (B) Expression of CD163 on healthy donor macrophages cultured a first week in plain medium supplemented with M-CSF and for a second week in medium containing the reagents indicated on the bottom axis. Measurements from n = 6 different HD. C Same as in B but with CM-MΦ exposed for 1 week to blast culture medium before switching, for week#2, to the indicated reprogramming conditions. n = 13–26 HD. D Primary bone marrow patient samples containing all cell types, including blasts and macrophages, were cultured for 7 days in plain medium supplemented as indicated. Autologous macrophages were then analyzed by flow cytometry for CD163 expression. The horizontal line represents the median percentage of CD163 expression. n = 5–9 patient samples. *p < 0.05, ***p < 0.0005, ****p < 0.0001.
Fig. 3
Fig. 3. Reprogrammed MΦ and 4-IPP induce myeloblast apoptosis in co-culture experiments.
A, B AML cell lines were cultured for 4 days on monolayers of M-, or R-MΦ (A) or monolayers of CM- or R-MΦ (B) and analyzed by flow cytometry for apoptosis with Annexin V staining. A n = 25–38 on 13 different HD; B n = 13–26 on 3 different HD. ★ = HL-60, ■ = MV-4-11, ▲ = NB4, ▼ = OCI-AML3, and ♦ = U937. C Primary myeloblast apoptosis induced after 4–7 days in indicated BM co-culture conditions. n = 6–10. Horizontal lines in AC panels represent the median apoptosis frequency. **p < 0.005, ***p < 0.0005, ****p < 0.0001.
Fig. 4
Fig. 4. Macrophage reprogramming reverses myeloblast resistance to venetoclax and midostaurin.
A and B MV-4–11 or C, D HL-60 were cultured in plastic or on indicated macrophage monolayer with increasing concentration of venetoclax for 48 h after which the percentage of live cells was measured by flow cytometry with Annexin V and/or 7-aminoactinomycin D staining. E and F MV-4-11 were cultured in plastic or on indicated macrophage monolayer with increasing concentration of midostaurin for 48 h after which the percentage of live cells was measured by flow cytometry with Annexin V and/or 7-aminoactinomycin D staining. *p < 0.05, **p < 0.005, ***p < 0.0005, ****p < 0.0001 compared to M-macrophages (A, C, E) or to CM-macrophages (B, D, F); n = 3–8 different HD.
Fig. 5
Fig. 5. MIF inhibition significantly reduces leukemia burden in the bone marrow and affects the microenvironment in vivo.
A Schematic representation of the experimental setup, created with BioRender. B Flow cytometry analyses at the end of the experiment (days 19–23 post-inoculation) of proportions of i.v. engrafted U937.GFP-FFLuc cells in bone marrow from long bones of NSG mice treated with vehicle (veh.), GM-CSF (GM, 3000 U/kg), 4-IPP (IPP, 80 mg/kg), and GM-CSF + 4-IPP (GM/IPP, administered at 3000 U/kg and 80 mg/kg body weight, respectively) starting on day 5 of engraftment. C Flow cytometry analysis was performed on bone marrow from femurs and tibias from mice treated as indicated for (i) % of total CD11b+ cells, (ii) % of CD11b+ and F4/80+ double-positive cells, (iii) % CD206+ M2-like macrophages, and (iv) % CD86+ M1-like macrophages in the CD11b+ population, respectively. Data are shown as the mean ± SEM (n = 4–5 mice per group), *p < 0.05, ***p < 0.001. D Representative mosaics from multiple 3-D z-stacks of whole top skull bone marrow from intravital imaging by multiphoton microscopy in mice from each treatment group show U937.GFP-FFLuc cells (green), dextran-labeled blood vessels and positive cells (red), and second harmonic generation imaging identified bone structures (cyan); scale bars = 1000 µm. E Quantification (mean ± SEM) of the percentage of U937.GFP-FFLuc cells per 100 µm3 volume of calvaria bone marrow, analyzed from 6 to 8 3-D z-stacks, n = 3 mice per treatment group, acquired by intravital multiphoton microscopy, using software analyses tools for surface rendering in the green channel as described in methods; to the right of the plot are representative 3-D image stacks of rendered GFP+ cells in calvaria bone marrow, scale bars = 200 µm. ***p < 0.001. F Quantification dextran+ vessels normalized per 100 µm3 bone marrow tissue volume, using 3-D surface rendering in the red channel; bars are means ± SEM (analyzed from 3 mice per group); to the right of the plot are representative 3-D image stacks of rendered dextran + vessels in calvaria bone marrow, scale bars = 200 µm. *p < 0.05, **p < 0.005.
Fig. 6
Fig. 6. MIF inhibition attenuates extramedullary leukemia progression and affects tumor vascularization in vivo.
A Schematic representation of the experimental setup, created with BioRender. B, C Subcutaneous U937.GFP-FFLuc leukemia cell tumor growth progression in NSG mice, day 0 (cell inoculation) until day 19 (end of the experiment); black vertical arrow indicates the start of mouse treatments with vehicle (veh.), GM-CSF (GM, 3000 U/kg), 4-IPP (IPP, 80 mg/kg), and GM-CSF + 4-IPP (GM/IPP, administered at 3000 U/kg and 80 mg/kg body weight, respectively) on day 9 of tumor growth. A Curves are the mean tumor volumes ± SEM (n = 4–5 mice per group) measured by calipers. C Curves are the mean total photons flux ± SEM (n = 4–5 mice per group) measured by bioluminescence; images show radiance at the same scale of all the tumor-bearing mice from the 4 treatment groups at the end of the experiment on day 19. ****p < 0.0001 compared to the vehicle on day 19 (B, C); n = 4–5 (D). Representative whole tumor image mosaics from intravital imaging by multiphoton microscopy of mice from each treatment group show U937-GFP leukemia cells (green), dextran-labeled blood vessels, and positive cells (red), and second harmonic generation imaging identified collagen I fibers (cyan); scale bars = 500 µm. E A representative illustration of image analysis approach from IVI-MP of a tumor mosaic from a GM-CSF + 4-IPP treated mouse, same tumor as in (D); first panel shows 3-D surface rendering in the red/dextran channel, second panel shows size classification and third (right) panel shows the separation of tumor blood vessels (purple) and phagocytic macrophages (blue); scale bars = 500 µm. F, G Quantification of the numbers (F) and lengths (G) of blood vessels normalized by tumor areas; bars are means ± SEM (images analyzed from ≥3 mice per group). ****p < 0.0001.
Fig. 7
Fig. 7. MIF inhibition in combination with GM-CSF reduces the proportion of protumoral macrophages in vivo.
A Quantification (mean ± SEM) of numbers of dextran-positive macrophages per 100 µm3 of tumor tissue, analyzed from 3-D z-stacks acquired by intravital multiphoton microscopy, using software analyses tools for surface rendering and size classification as described in the “Methods” section and Fig. 6. Panels right of plot show representative examples of 3-D surface rendering in the red/dextran channel of dextran-positive macrophages classified by size from each treatment group; scale bars = 100 µm. B Flow cytometry analysis was performed on U937 tumors from mice treated as indicated, for (I) % of total CD11b+ cells, (ii) % of CD11b+ and F4/80+ double-positive cells, (iii) and % CD206+ M2-like macrophages and (iv) % CD86+ M1-like macrophages in the CD11b+ population, respectively. Data are shown as the mean ± SEM (n = 4–5 mice per group), *p < 0.05.

References

    1. Burnett AK, Hills RK, Russell N. Twenty five years of UK trials in acute myeloid leukaemia: what have we learned? Br J Haematol. 2020;188:86–100. doi: 10.1111/bjh.16359. - DOI - PubMed
    1. Döhner H, Wei AH, Appelbaum FR, Craddock C, DiNardo CD, Dombret H, et al. Diagnosis and management of AML in adults: 2022 recommendations from an international expert panel on behalf of the ELN. Blood. 2022;140:1345–77. doi: 10.1182/blood.2022016867. - DOI - PubMed
    1. Morita K, Wang F, Jahn K, Hu T, Tanaka T, Sasaki Y, et al. Clonal evolution of acute myeloid leukemia revealed by high-throughput single-cell genomics. Nat Commun. 2020;11:5327. doi: 10.1038/s41467-020-19119-8. - DOI - PMC - PubMed
    1. Gurnari C, Pagliuca S, Visconte V. Deciphering the therapeutic resistance in acute myeloid leukemia. Int J Mol Sci. 2020;21:8505. doi: 10.3390/ijms21228505. - DOI - PMC - PubMed
    1. Davidson-Moncada J, Viboch E, Church SE, Warren SE, Rutella S. Dissecting the immune landscape of acute myeloid leukemia. Biomedicines. 2018;6:110. doi: 10.3390/biomedicines6040110. - DOI - PMC - PubMed