. 2024 Mar 28;14(1):7444.
doi: 10.1038/s41598-024-57493-1.

Contribution of pudendal nerve injury to stress urinary incontinence in a male rat model

Affiliations

Contribution of pudendal nerve injury to stress urinary incontinence in a male rat model

Shaimaa Maher et al. Sci Rep. .

Abstract

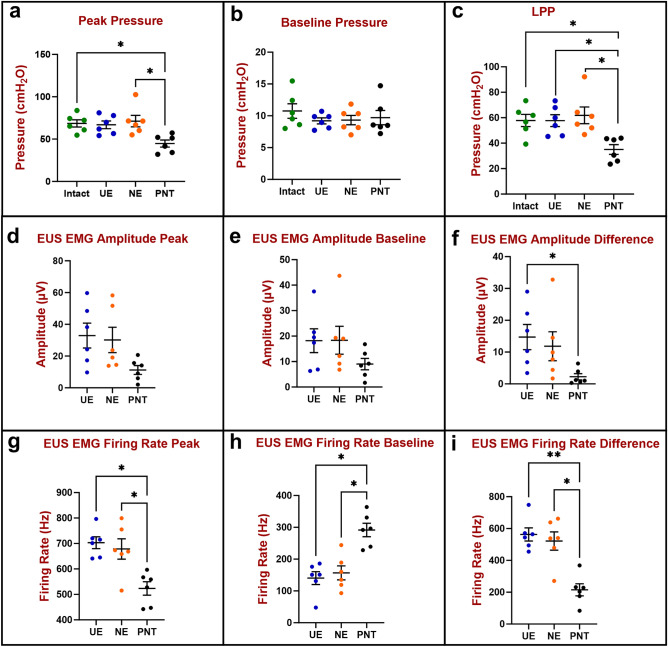
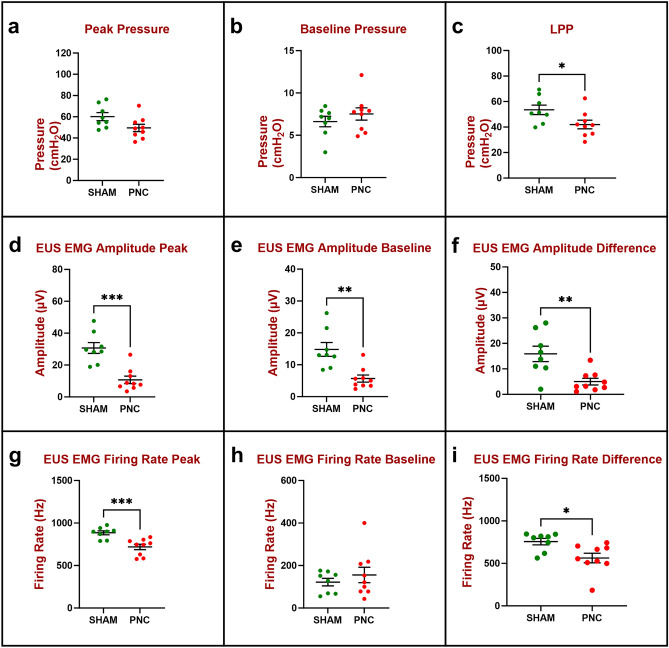
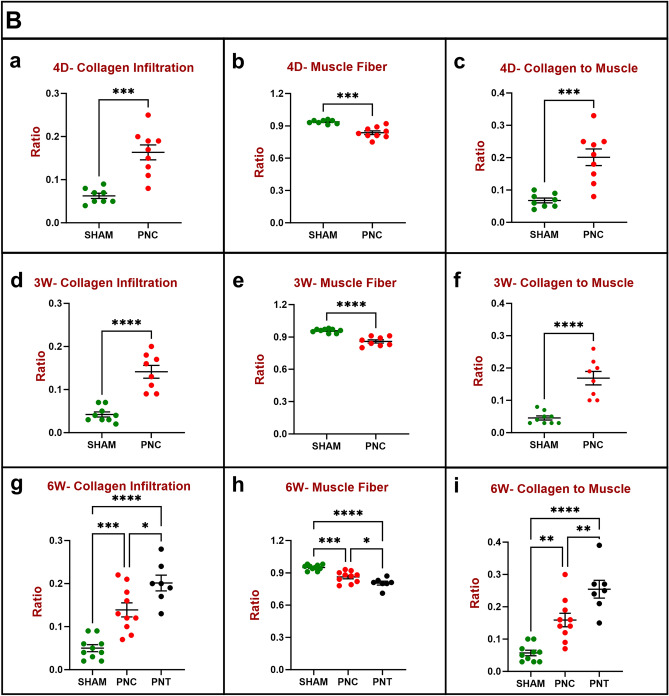
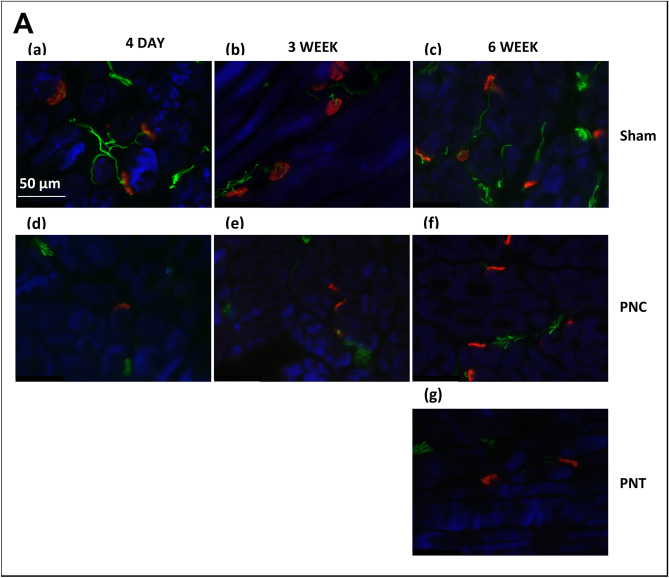
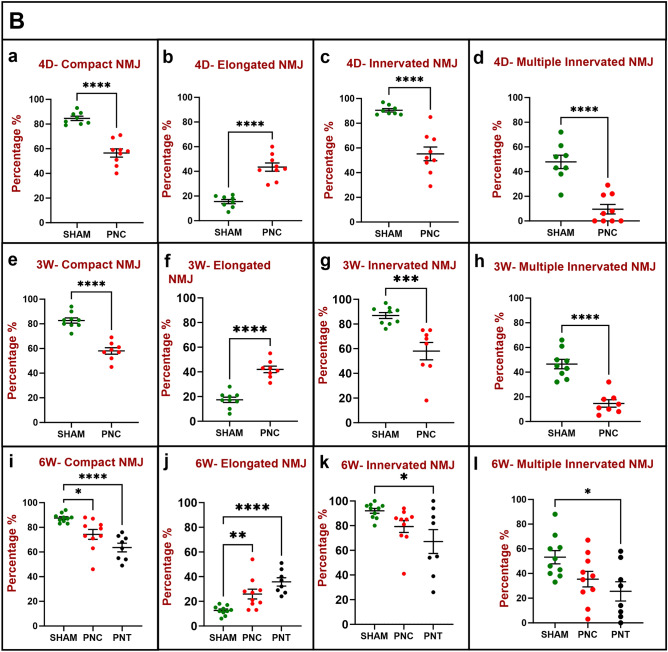
Urinary incontinence is a common complication following radical prostatectomy, as the surgery disturbs critical anatomical structures. This study explored how pudendal nerve (PN) injury affects urinary continence in male rats. In an acute study, leak point pressure (LPP) and external urethral sphincter electromyography (EMG) were performed on six male rats with an intact urethra, the urethra exposed (UE), the PN exposed (NE), and after PN transection (PNT). In a chronic study, LPP and EMG were tested in 67 rats 4 days, 3 weeks, or 6 weeks after sham PN injury, PN crush (PNC), or PNT. Urethras were assessed histologically. Acute PNT caused a significant decrease in LPP and EMG amplitude and firing rate compared to other groups. PNC resulted in a significant reduction in LPP and EMG firing rate 4 days, 3 weeks, and 6 weeks later. EMG amplitude was also significantly reduced 4 days and 6 weeks after PNC. Neuromuscular junctions were less organized and less innervated after PNC or PNT at all timepoints compared to sham injured animals. Collagen infiltration was significantly increased after PNC and PNT compared to sham at all timepoints. This rat model could facilitate preclinical testing of neuroregenerative therapies for post-prostatectomy incontinence.


Conflict of interest statement

The authors declare no competing interests.

Figures

Figure 1
Figure 1
Urethral resistance to leakage in the acute study (n = 6) was evaluated by measuring peak and baseline bladder pressure during leak point pressure (LPP) testing with simultaneous external urethral sphincter electromyography (EUS EMG) recordings. The difference between peak (a) and baseline (b) bladder pressure is the LPP (c). EUS EMG was quantified as amplitude (df) and firing rate (gi) at baseline (e,h) and peak (d,g) during LPP testing as well as the difference between them (f,i) which shows response to LPP testing. The scatter plots show individual data points, mean, and standard error of the mean (SEM). The Kruskal–Wallis test followed by Dunn’s multiple comparisons test was used to compare LPP (ac), EUS EMG amplitude (df), and EUS EMG firing rate (gi) between four groups: Intact (green), urethra exposed (UE, blue), nerve exposed (NE, orange) and pudendal nerve transected (PNT, black). *p < 0.05, **p < 0.01.
Figure 2
Figure 2
Urethral resistance to leakage in the chronic study 4 days after injury (n = 8 Sham, green and n = 9 PNC, red) was evaluated by measuring peak and baseline bladder pressure during leak point pressure (LPP) testing with simultaneous external urethral sphincter electromyography (EUS EMG) recordings. The difference between peak (a) and baseline (b) bladder pressure is the LPP (c). EUS EMG was quantified as amplitude (df) and firing rate (gi) at baseline (e,h) and peak (d,g) during LPP testing as well as the difference between them (f,i) which shows response to LPP testing. The scatter plot graphs show individual data points, mean, and standard error of the mean (SEM). Unpaired two-tailed t-test was used to compare LPP (ac), EUS EMG amplitude (df), and EUS EMG firing rate (gi) between two groups (Sham, PNC). *p < 0.05, **p < 0.01, and ***p < 0.001. PNC pudendal nerve crush.
Figure 3
Figure 3
Urethral resistance to leakage in the chronic study 3 weeks after injury (n = 10 Sham, green and n = 8 PNC, red) was evaluated by measuring peak and baseline bladder pressure during leak point pressure (LPP) testing with simultaneous external urethral sphincter electromyography (EUS EMG) recordings. The difference between peak (a) and baseline (b) bladder pressure is the LPP (c). EUS EMG was quantified as amplitude (df) and firing rate (gi) at baseline (e,h) and peak (d,g) during LPP testing as well as the difference between them (f,i) which shows response to LPP testing. The scatter plot graphs show individual data points, mean, and standard error of the mean (SEM). Unpaired two-tailed t-test was used to compare LPP (ac), EUS EMG amplitude (df), and EUS EMG firing rate (gi) between two groups (Sham, PNC). *p < 0.05. PNC pudendal nerve crush.
Figure 4
Figure 4
Urethral resistance to leakage in the chronic study 6 weeks after injury (n = 10 Sham, green; n = 10 PNC, red; and n = 9 PNT, black) was evaluated by measuring peak and baseline bladder pressure during leak point pressure (LPP) testing with simultaneous external urethral sphincter electromyography (EUS EMG) recordings. The difference between peak (a) and baseline (b) bladder pressure is the LPP (c). EUS EMG was quantified as amplitude (df) and firing rate (gi) at baseline (e,h) and peak (d,g) during LPP testing as well as the difference between them (f,i) which shows response to LPP testing. The scatter plot graphs show individual data points, mean, and standard error of the mean (SEM). Ordinary one-way analysis of variance (ANOVA) followed by Tukey’s multiple comparisons test was used to compare LPP (ac), EUS EMG amplitude (df), and EUS EMG firing rate (gi) between three groups (Sham, PNC, PNT). *p < 0.05, **p < 0.01, ***p < 0.001, and ****p < 0.0001. PNC pudendal nerve crush, PNT pudendal nerve transected.
Figure 5
Figure 5
Urethral Masson’s trichrome stain results for chronic study. (A) Representative images of Masson’s trichrome-stained sections of urethral cross-sections. 4 days (1st column), 3 weeks (2nd column) and 6 weeks (3rd column). After sham injury (1st row), the images depict densely packed striated muscle fibers with minimal collagen infiltration. After pudendal nerve crush (PNC; 2nd row), there are atrophied striated muscle fibers with increased collagen infiltration. After pudendal nerve transection (PNT; 3rd row), striated muscle fibers of the EUS are atrophied and are accompanied by increased collagen infiltration. (B) Ratio of collagen (a,d,g) and muscle (b,e,h) to total area, and ratio of collagen to muscle (c,f,i) at each time point. Histology was assessed 4 days [(ac) (n = 8 Sham, green and n = 9 PNC, red)], 3 weeks [(df) (n = 9 Sham, green and n = 8 PNC, red)], and 6 weeks [(gi) (n = 10 Sham, green; n = 10 PNC, red; and n = 7 PNT, black)] after injury. The scatter plot graphs show individual data points, mean, and standard error of the mean (SEM). Unpaired two-tailed t-test was used to compare outcomes between the sham and PNC groups for both the 4-day and 3-week time points. Ordinary one-way analysis of variance (ANOVA) followed by Tukey’s multiple comparisons test was used to compare outcomes among the sham, PNC, and PNT groups at the 6-week time point. *p < 0.05, **p < 0.01. ***p < 0.001, ****p < 0.0001.
Figure 5
Figure 5
Urethral Masson’s trichrome stain results for chronic study. (A) Representative images of Masson’s trichrome-stained sections of urethral cross-sections. 4 days (1st column), 3 weeks (2nd column) and 6 weeks (3rd column). After sham injury (1st row), the images depict densely packed striated muscle fibers with minimal collagen infiltration. After pudendal nerve crush (PNC; 2nd row), there are atrophied striated muscle fibers with increased collagen infiltration. After pudendal nerve transection (PNT; 3rd row), striated muscle fibers of the EUS are atrophied and are accompanied by increased collagen infiltration. (B) Ratio of collagen (a,d,g) and muscle (b,e,h) to total area, and ratio of collagen to muscle (c,f,i) at each time point. Histology was assessed 4 days [(ac) (n = 8 Sham, green and n = 9 PNC, red)], 3 weeks [(df) (n = 9 Sham, green and n = 8 PNC, red)], and 6 weeks [(gi) (n = 10 Sham, green; n = 10 PNC, red; and n = 7 PNT, black)] after injury. The scatter plot graphs show individual data points, mean, and standard error of the mean (SEM). Unpaired two-tailed t-test was used to compare outcomes between the sham and PNC groups for both the 4-day and 3-week time points. Ordinary one-way analysis of variance (ANOVA) followed by Tukey’s multiple comparisons test was used to compare outcomes among the sham, PNC, and PNT groups at the 6-week time point. *p < 0.05, **p < 0.01. ***p < 0.001, ****p < 0.0001.
Figure 6
Figure 6
Urethral neuromuscular junction (NMJ) immunostaining results for chronic study. (A) Representative images of immunofluorescence-stained sections of urethral cross-sections. 4 days (1st column), 3 weeks (2nd column) and 6 weeks (3rd column). After sham injury (1st row), the images demonstrate well-defined, organized motor endplates [compact NMJ; (ac)] accompanied by well innervated NMJ. After pudendal nerve crush (PNC; 2nd row), the NMJ became less organized and less well innervated [elongated NMJ; (df)]. After pudendal nerve transection (PNT; 3rd row), the images display less organization and less innervation (g). Green color indicates neurofilament, red color indicates NMJ, and blue color indicates striated muscle. (B) EUS NMJ quantitative assessments based on percentage of the specified criteria (compact, elongated, innervated, and multiple innervated) to total NMJ in 12 different fields per each specimen. Percentage compact NMJs (a,e,i), elongated NMJs (b,f,j), innervated NMJs (c,g,k), and multiple innervated NMJs (d,h,l) at each time point. Data presented at 4 days [(ad) (n = 8 Sham, green and n = 9 PNC, red)], 3 weeks [(eh) (n = 9 Sham, green and n = 8 PNC, red)], and 6 weeks [(il) (n = 10 Sham, green; n = 10 PNC, red; and n = 7 PNT, black)]. The scatter plot graphs show individual data points, mean, and standard error of the mean (SEM). Unpaired two-tailed t-test was used to compare outcomes between the sham and PNC groups 4 days and 3 weeks after injury. Ordinary one-way analysis of variance (ANOVA) followed by Tukey’s multiple comparisons test was used to compare outcomes among the sham, PNC, and PNT groups at the 6 weeks after injury. *p < 0.05, **p < 0.01, ***p < 0.001, ****p < 0.0001.
Figure 6
Figure 6
Urethral neuromuscular junction (NMJ) immunostaining results for chronic study. (A) Representative images of immunofluorescence-stained sections of urethral cross-sections. 4 days (1st column), 3 weeks (2nd column) and 6 weeks (3rd column). After sham injury (1st row), the images demonstrate well-defined, organized motor endplates [compact NMJ; (ac)] accompanied by well innervated NMJ. After pudendal nerve crush (PNC; 2nd row), the NMJ became less organized and less well innervated [elongated NMJ; (df)]. After pudendal nerve transection (PNT; 3rd row), the images display less organization and less innervation (g). Green color indicates neurofilament, red color indicates NMJ, and blue color indicates striated muscle. (B) EUS NMJ quantitative assessments based on percentage of the specified criteria (compact, elongated, innervated, and multiple innervated) to total NMJ in 12 different fields per each specimen. Percentage compact NMJs (a,e,i), elongated NMJs (b,f,j), innervated NMJs (c,g,k), and multiple innervated NMJs (d,h,l) at each time point. Data presented at 4 days [(ad) (n = 8 Sham, green and n = 9 PNC, red)], 3 weeks [(eh) (n = 9 Sham, green and n = 8 PNC, red)], and 6 weeks [(il) (n = 10 Sham, green; n = 10 PNC, red; and n = 7 PNT, black)]. The scatter plot graphs show individual data points, mean, and standard error of the mean (SEM). Unpaired two-tailed t-test was used to compare outcomes between the sham and PNC groups 4 days and 3 weeks after injury. Ordinary one-way analysis of variance (ANOVA) followed by Tukey’s multiple comparisons test was used to compare outcomes among the sham, PNC, and PNT groups at the 6 weeks after injury. *p < 0.05, **p < 0.01, ***p < 0.001, ****p < 0.0001.

Similar articles

References

    1. Bauer RM, Bastian PJ, Gozzi C, Stief CG. Postprostatectomy incontinence: All about diagnosis and management. Eur. Urol. 2009;55:322–333. doi: 10.1016/j.eururo.2008.10.029. - DOI - PubMed
    1. Rahnama’i MS, Marcelissen T, Geavlete B, Tutolo M, Hüsch T. Current management of post-radical prostatectomy urinary incontinence. Front. Surg. 2021;8:875–881. - PMC - PubMed
    1. Lee R, Te AE, Kaplan SA, Sandhu JS. Temporal trends in adoption of and indications for the artificial urinary sphincter. J. Urol. 2009;181:2622–2627. doi: 10.1016/j.juro.2009.01.113. - DOI - PubMed
    1. Haglind E, et al. Urinary incontinence and erectile dysfunction after robotic versus open radical prostatectomy: A prospective, controlled nonrandomised trial. Eur. Urol. 2015;68:216–225. doi: 10.1016/j.eururo.2015.02.029. - DOI - PubMed
    1. Hamdy FC, Donovan JL, Lane JA. 10-Year outcomes after monitoring, surgery, or radiotherapy for localized prostate cancer. N. Engl. J. Med. 2016;375:1415–1424. doi: 10.1056/NEJMoa1606220. - DOI - PubMed