. 2024 Mar 28;8(1):78.
doi: 10.1038/s41698-024-00567-0.

A multiparameter liquid biopsy approach allows to track melanoma dynamics and identify early treatment resistance

Affiliations

A multiparameter liquid biopsy approach allows to track melanoma dynamics and identify early treatment resistance

Maria Chiara Scaini et al. NPJ Precis Oncol. .

Abstract

Melanoma heterogeneity is a hurdle in metastatic disease management. Although the advent of targeted therapy has significantly improved patient outcomes, the occurrence of resistance makes monitoring of the tumor genetic landscape mandatory. Liquid biopsy could represent an important biomarker for the real-time tracing of disease evolution. Thus, we aimed to correlate liquid biopsy dynamics with treatment response and progression by devising a multiplatform approach applied to longitudinal melanoma patient monitoring. We conceived an approach that exploits Next Generation Sequencing (NGS) and droplet digital PCR, as well as the FDA-cleared platform CellSearch, to analyze circulating tumor DNA (ctDNA) trend and circulating melanoma cell (CMC) count, together with their customized genetic and copy number variation analysis. The approach was applied to 17 stage IV melanoma patients treated with BRAF/MEK inhibitors, followed for up to 28 months. BRAF mutations were detected in the plasma of 82% of patients. Single nucleotide variants known or suspected to confer resistance were identified in 70% of patients. Moreover, the amount of ctDNA, both at baseline and during response, correlated with the type and duration of the response itself, and the CMC count was confirmed to be a prognostic biomarker. This work provides proof of principle of the power of this approach and paves the way for a validation study aimed at evaluating early ctDNA-guided treatment decisions in stage IV melanoma. The NGS-based molecular profile complemented the analysis of ctDNA trend and, together with CMC analysis, revealed to be useful in capturing tumor evolution.


Conflict of interest statement

MCS received a travel grant from Agilent Technologies, all the other authors declare no competing interests.

Figures

Fig. 1
Fig. 1. Multiplatform approach overview.
To longitudinally track the evolution of the disease, a multiplatform approach was devised that encompasses the use of ddPCR, NGS and CellSearch system on serial blood samples. Both cfDNA and CMCs were analyzed at different time points from the same blood specimen. BRAF/pTERT mutant allele fractions were longitudinally tracked by ddPCR as biomarkers of disease evolution and response to treatment, while a customized NGS panel was exploited to identify tumor genetic landscape and mutations responsible for resistance. In parallel, CMCs were phenotypically characterized and counted through the CellSearch System, and then isolated by laser capture microdissection for genetic landscape identification through NGS analysis. The workflow was created with BioRender (https://biorender.com/).
Fig. 2
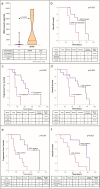
Fig. 2. Correlation of ctDNA and CMC with response to treatment, PFS and OS.
a Violin plot illustrating the amount of ctDNA (copies/ml of plasma) at T0 in responders vs non-responders/early progressing patients (Mann–Whitney U test, p = 0.039). First and third quartile, together with the median (middle line) are indicated in the plot. Contingency table with corresponding Fisher’s exact test p value is indicated below the graph. R, responding; NR, not responding; EP, early progressing patients (PFS ≤ 6 months). Kaplan–Meier plots of (b) OS according to BRAF-mutant ctDNA clearance at the first observational point after treatment start (range 2–6 months); (c) PFS and (d) OS according to baseline pTERT-mutant ctDNA amount; (e) PFS and (f) OS according to CMC count at baseline. The violin plot was performed using GraphPad version 8.0 for Windows (GraphPad Software Inc., San Diego, CA, USA).
Fig. 3
Fig. 3. Longitudinal ctDNA dynamics and correlation between lack of clearance in the first 6 months and response to treatment.
a Longitudinal monitoring of BRAF ctDNA MAF, shown for every patient, and (b) violin plot of BRAF-mutant ctDNA amount (copies/ml of plasma) evaluated at the first observational point after the beginning of therapy (range 2–6 months). ctDNA amount is significantly different between responders and non-responders/early progressing patients (Mann–Whitney U test p = 0.015). T0, baseline; 6 mo w/o prog: 6-month follow-up without antecedent progression; *:not responding and/or early progressing patients; MAF, mutant allele fraction; R, responding; NR, not responding; EP, early progressing patients (progressed before 6 months of treatment). The graph and the violin plot were performed using GraphPad version 8.0 for Windows (GraphPad Software Inc., San Diego, CA, USA).
Fig. 4
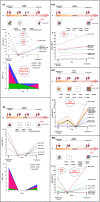
Fig. 4. Liquid biopsy dynamics.
Timeline (a) and longitudinal plot (b) of SNV MAFs detected in ctDNA of patients #3, #9, #19, #27, #28. CMC count dynamics (c) is shown for patients #3 and #9. The timeline was created with BioRender (https://biorender.com/); the plot was performed using GraphPad version 8.0 for Windows (GraphPad Software Inc., San Diego, CA, USA).
Fig. 5
Fig. 5. Summary of SNVs and CNVs detected by NGS in cfDNA at the baseline and type of response.
Patients are sorted by PFS (days). δPatients still responding when data were collected. SNVs are classified according to Association for Molecular Pathology (AMP) guidelines. AMP classifications were obtained from Franklin website (https://franklin.genoox.com - Franklin by Genoox).

References

    1. Saginala K, Barsouk A, Aluru JS, Rawla P, Barsouk A. Epidemiology of Melanoma. Med Sci. (Basel) 2021;9:63. - PMC - PubMed
    1. Long GV, et al. Adjuvant Dabrafenib plus Trametinib in stage III BRAF-mutated melanoma. N. Engl. J. Med. 2017;377:1813–1823. doi: 10.1056/NEJMoa1708539. - DOI - PubMed
    1. Robert C, et al. Five-year outcomes with Dabrafenib plus Trametinib in metastatic melanoma. N. Engl. J. Med. 2019;381:626–636. doi: 10.1056/NEJMoa1904059. - DOI - PubMed
    1. Kozar I, Margue C, Rothengatter S, Haan C, Kreis S. Many ways to resistance: how melanoma cells evade targeted therapies. Biochim. Biophys. Acta Rev. Cancer. 2019;1871:313–322. doi: 10.1016/j.bbcan.2019.02.002. - DOI - PubMed
    1. Gorges K, et al. Intra-patient heterogeneity of circulating tumor cells and circulating tumor DNA in blood of melanoma patients. Cancers (Basel) 2019;11:E1685. doi: 10.3390/cancers11111685. - DOI - PMC - PubMed