. 2024 May;26(5):698-709.
doi: 10.1038/s41556-024-01393-z. Epub 2024 Mar 28.

A cell fate decision map reveals abundant direct neurogenesis bypassing intermediate progenitors in the human developing neocortex

Affiliations

A cell fate decision map reveals abundant direct neurogenesis bypassing intermediate progenitors in the human developing neocortex

Laure Coquand et al. Nat Cell Biol. 2024 May.

Abstract

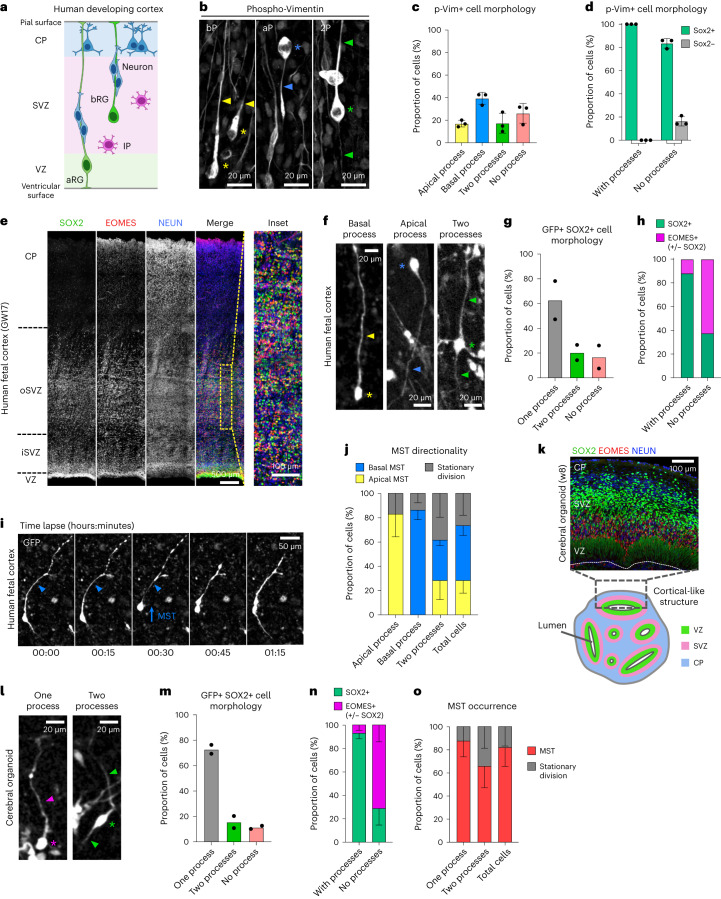
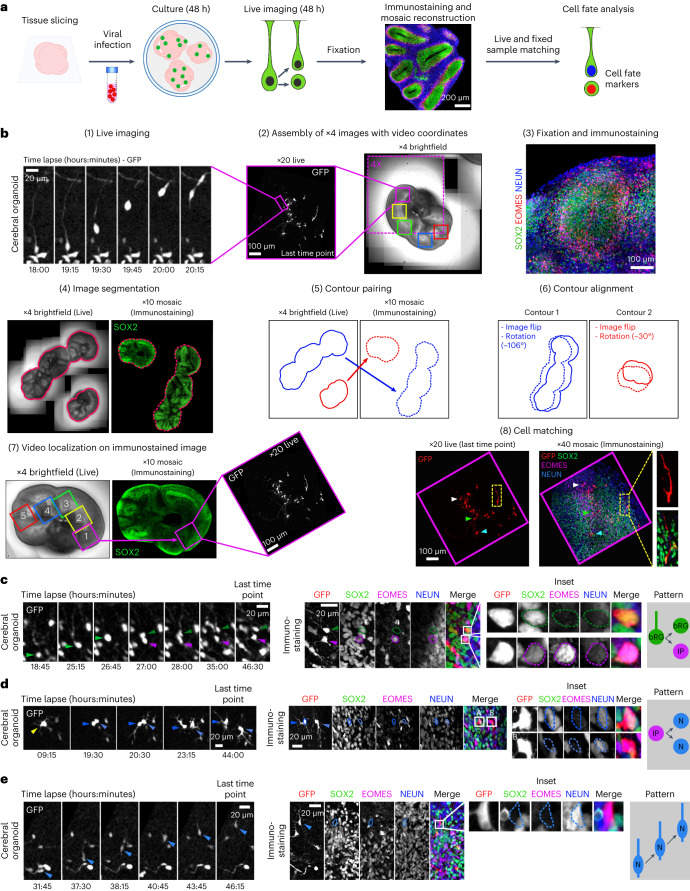
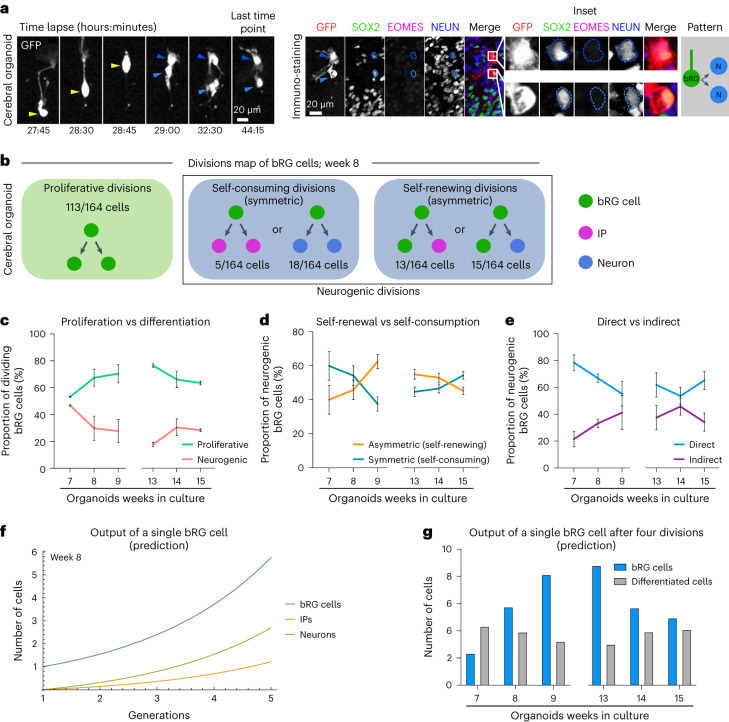
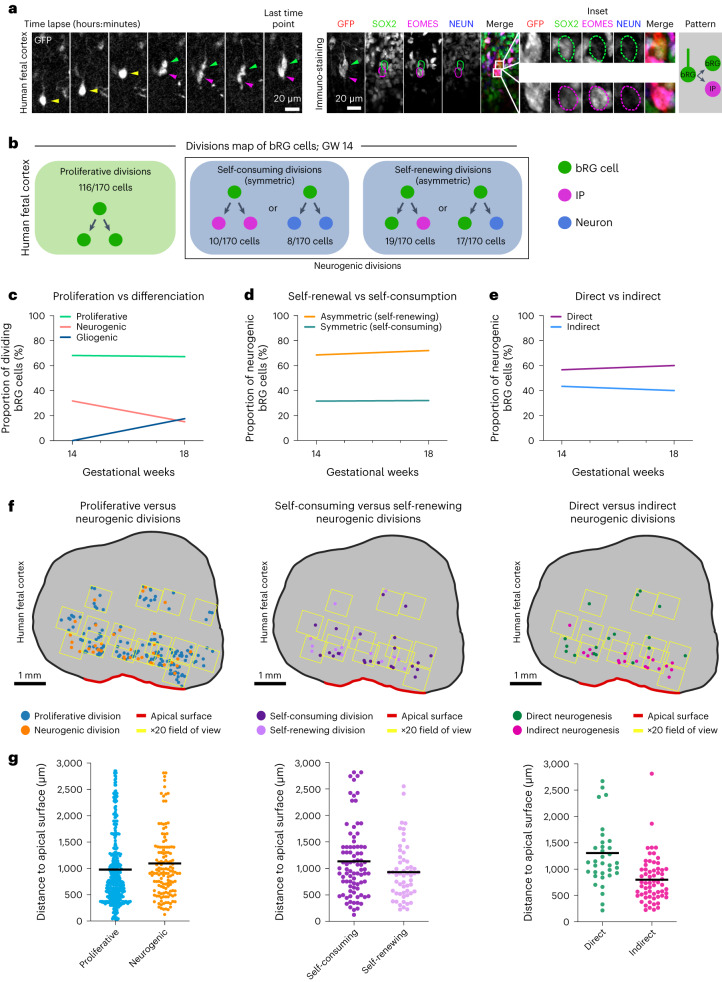
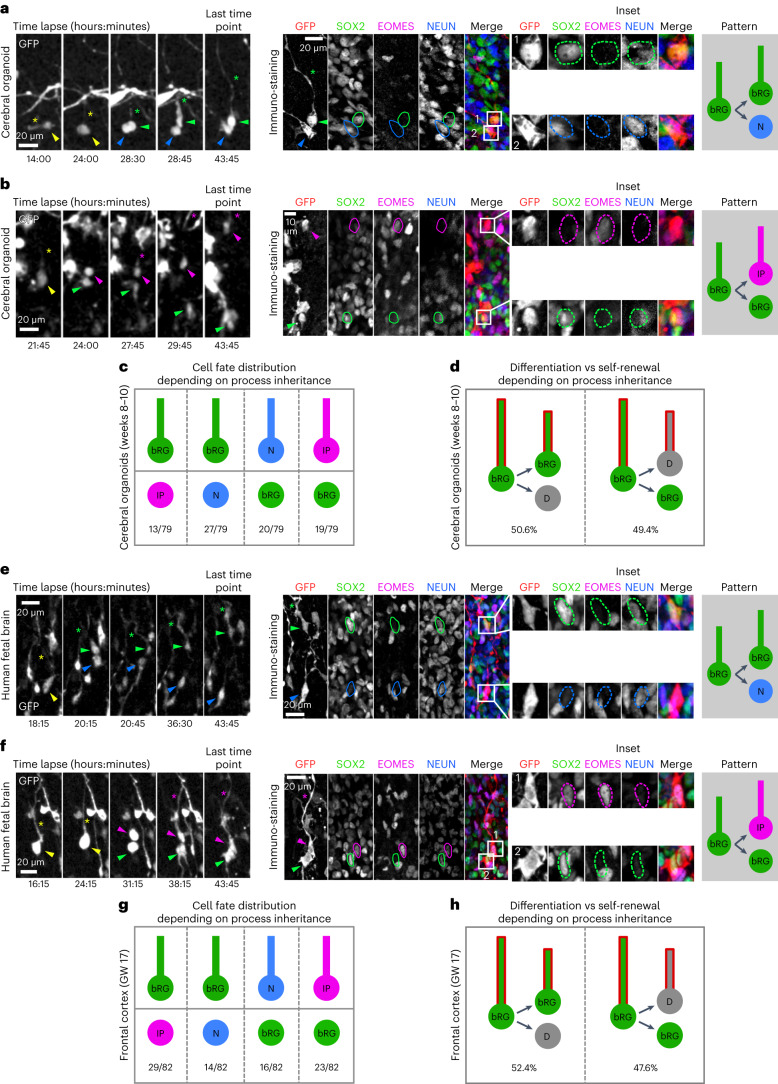
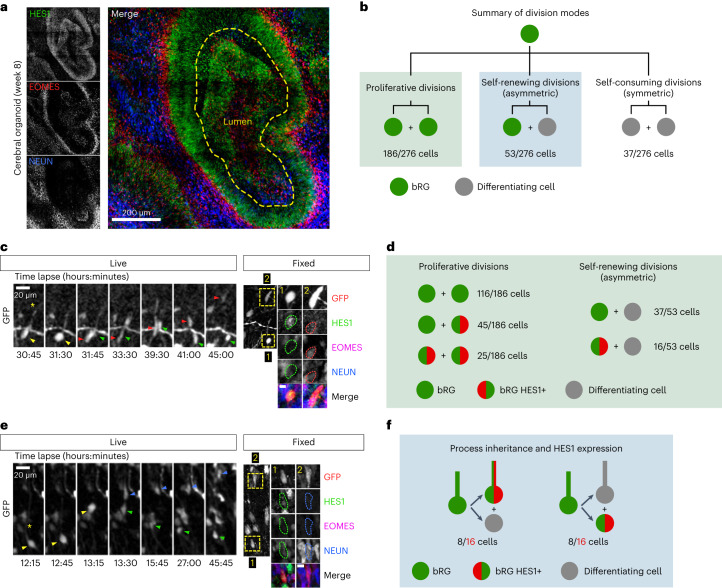
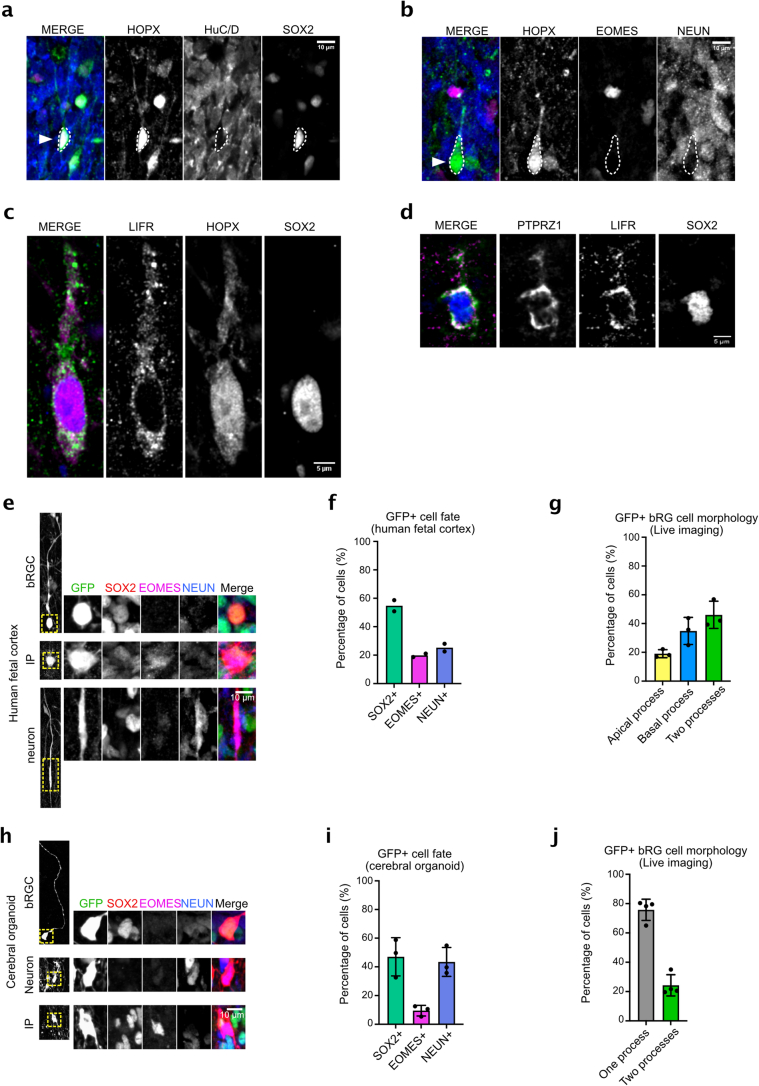
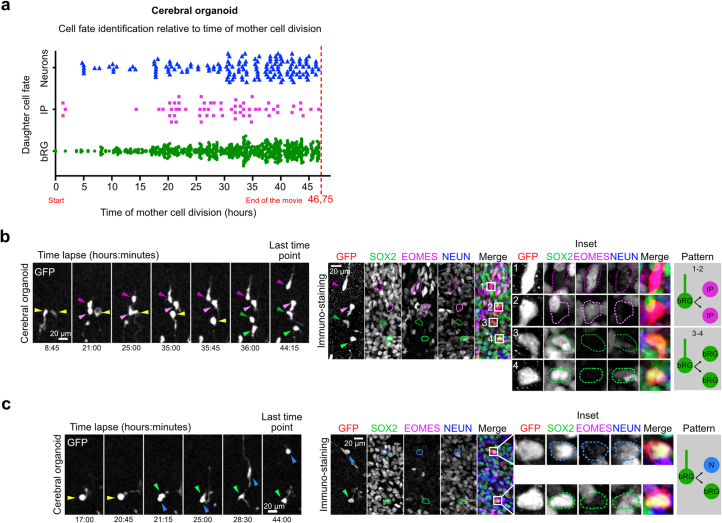
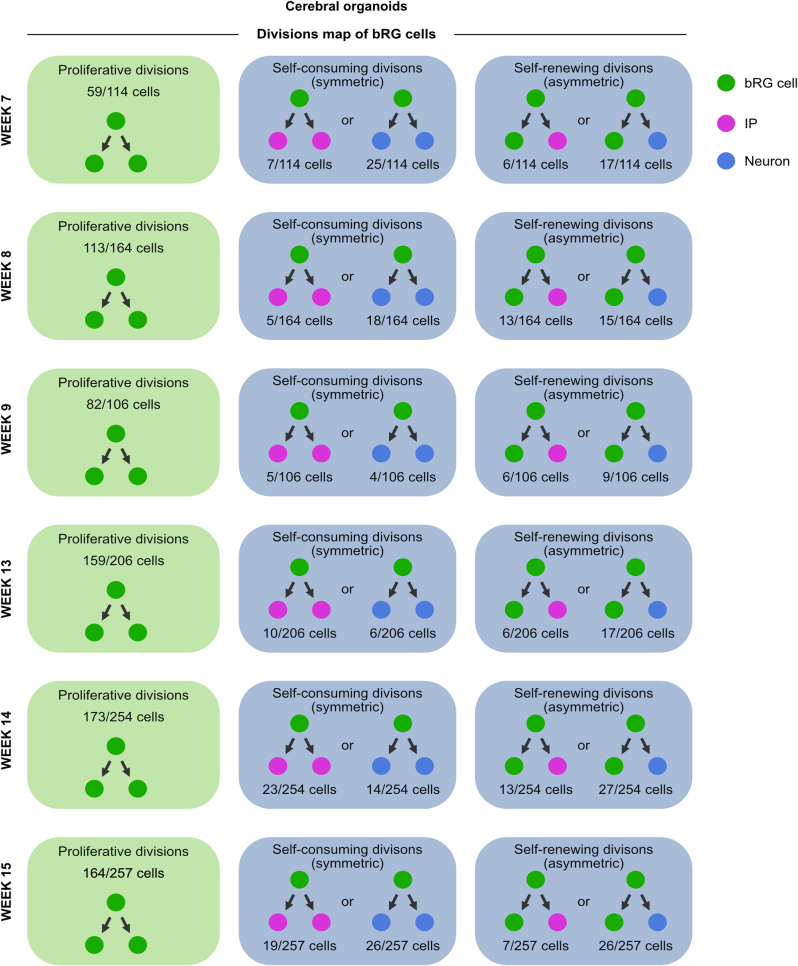
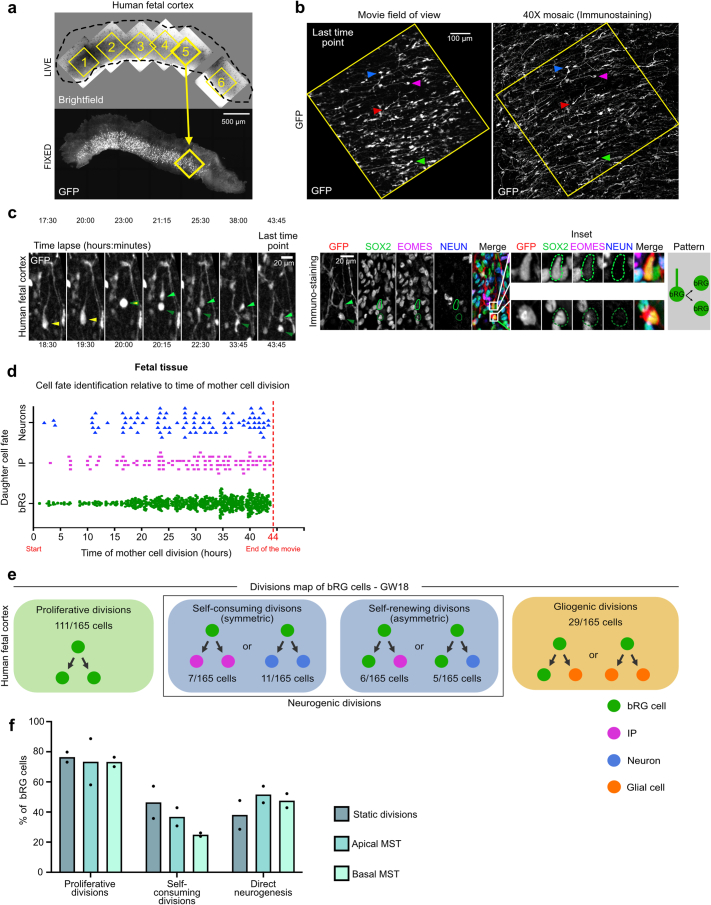
The human neocortex has undergone strong evolutionary expansion, largely due to an increased progenitor population, the basal radial glial cells. These cells are responsible for the production of a diversity of cell types, but the successive cell fate decisions taken by individual progenitors remain unknown. Here we developed a semi-automated live/fixed correlative imaging method to map basal radial glial cell division modes in early fetal tissue and cerebral organoids. Through the live analysis of hundreds of dividing progenitors, we show that basal radial glial cells undergo abundant symmetric amplifying divisions, and frequent self-consuming direct neurogenic divisions, bypassing intermediate progenitors. These direct neurogenic divisions are more abundant in the upper part of the subventricular zone. We furthermore demonstrate asymmetric Notch activation in the self-renewing daughter cells, independently of basal fibre inheritance. Our results reveal a remarkable conservation of fate decisions in cerebral organoids, supporting their value as models of early human neurogenesis.


Conflict of interest statement

The authors declare no competing interests.

Figures

Fig. 1
Fig. 1. Morphological characterization of bRG cells in human cerebral organoids and fetal tissue.
a, Schematic representation of human neocortex development. CP, cortical plate. b, Phospho-Vimentin immunostaining of human frontal cortex at GW 18. Image is overexposed to visualize processes, revealing cells with basal process (bP), apical process (aP) and both processes (2P). c, Quantification of mitotic bRG cell morphologies in GW 14–18 frontal cortex. N = 3 brains, 338 cells. d, Proportion of p-VIM+ cells positive for SOX2, depending on morphology. N = 3 brains, 456 cells. e, SOX2, EOMES and NEUN immunostaining in human frontal cortex at GW 17. f, Morphologies of GFP-expressing SOX2+ cells in human frontal cortex at GW 17. g, Quantification of morphologies of GFP-expressing SOX2+ cells in human frontal cortex at GW 14–17. N = 2 brains, 350 cells. h, Proportion of SOX2+/EOMES– and EOMES+ (with or without SOX2) progenitors, depending on morphology in human frontal cortex at GW 14–17. N = 2 brains, 204 cells. i, Live imaging of bRG cell performing MST in human fetal tissue. The arrowhead indicates basal process. j, Directionality of MST depending on bRG cell morphology in human frontal cortex at GW 14–18. N = 3 brains, 242 cells. k, SOX2, EOMES and NEUN immunostaining in week 8 cerebral organoids (top). Schematic representation of week 8–10 cerebral organoids (bottom). l, Morphologies of GFP-expressing SOX2+ cells in cerebral organoids at weeks 7–10. m, Quantification of morphologies of GFP-expressing SOX2+ cells in cerebral organoids at weeks 7–8. N = 2 batches, 104 cells. n, Proportion of SOX2+/EOMES– and EOMES+ (with or without SOX2) progenitors, depending on morphology in cerebral organoids at weeks 8–10. N = 3 batches, 205 cells. o, Directionality of MST depending on bRG cell morphology cerebral organoids at weeks 8–9. N = 4 batches, 260 cells. Arrowheads indicate bRG processes and asterisks indicate soma. Data are presented as mean values +/− s.d. Source data
Fig. 2
Fig. 2. A semi-automated correlative imaging method to identify cell fate decisions in cerebral organoids.
a, Schematic representation of correlative microscopy pipeline. b, Step-by-step protocol for semi-automated correlative microscopy. (1) bRG cells are live imaged at 20X for 48 hours. (2) 4X brightfield images containing the video coordinates are assembled. (3) Organoid slices are fixed, immunostained for SOX2, EOMES and NEUN, and imaged. (4) Images are automatically segmented to outline slices from live and fixed samples. (5) Slice contours are automatically paired based on shape and area and (6) aligned (including a horizontal flip if needed). (7) Video fields of view are automatically annotated on the immunostaining images. (8) Regions of interest are re-imaged at higher resolution (×40) and cells from live and fixed samples are manually matched. c, Live/fixed correlative analysis of a dividing bRG cell generating a self-renewing bRG daughter and a differentiating IP daughter. d, Live/fixed correlative analysis of a dividing IP cell generating two neuronal daughters. e, Live/fixed correlative analysis of a migrating neuron. All images are representative examples of experiments performed at least three times independently (N = 1,101 bRG cells).
Fig. 3
Fig. 3. A map of cell fate decisions in human cerebral organoids.
a, Live/fixed correlative analysis of a dividing bRG cell generating two neuronal daughters. b, Summary of all division patterns identified in bRG cells in week 8 cerebral organoids (N = 164 bRG cells). c, Proportion of proliferative versus neurogenic divisions of bRG cells in week 7–9 and 13–15 cerebral organoids. d, Proportion of asymmetric (self-renewing) versus symmetric (self-consuming) neurogenic divisions of bRG cells in week 7–9 and 13–15 cerebral organoids. e, Proportion of direct versus indirect neurogenic divisions of bRG cells in week 7–9 and 13–15 cerebral organoids. ce, Week 7, N = 114 bRG cells and two independent live-imaged slices; week 8, N = 164 bRG cells and two independent live-maged slices; week 9, N = 106 bRG cells and two independent live-imaged slices; week 13, N = 206 bRG cells and two independent live-imaged slices; week 14, N = 254 bRG cells and three independent live-imaged slices; week 15, N = 257 bRG cells and two independent live-imaged slices. f, Simulation of the output of a single bRG cell after one to five generations, based on week 8 fate decision probabilities. g, Simulation of the output of a single bRG cell after four divisions (five generations) in week 7–9 and 13–15 cerebral organoids. All images are representative examples of experiments performed in at least two independent fetal brains. Data are presented as mean +/− s.d. Source data
Fig. 4
Fig. 4. A map of cell fate decisions in fetal human frontal cortex.
a, Live/fixed correlative analysis of a dividing bRG cell generating a bRG daughter and an IP daughter. b, Summary of all division patterns identified in bRG cells at GW 14 (N = 170 bRG cells) human frontal cortex. c, Proportion of proliferative versus neurogenic divisions of bRG cells in GW 14 and 18 human fetal tissue. d, Proportion of asymmetric (self-renewing) versus symmetric (self-consuming) neurogenic divisions of bRG cells in GW 14 and 18 human fetal tissue. e, Proportion of direct versus indirect neurogenic divisions of bRG cells in GW 14 and 18 human fetal tissue. f, Spatial distribution of proliferative versus neurogenic (left), self-consuming versus asymmetric self-renewing (middle) and direct versus indirect neurogenic divisions (right) in GW 17 human frontal cortex. g, Quantification of proliferative versus neurogenic (left), self-consuming versus asymmetric self-renewing (middle) and direct versus indirect neurogenic divisions (right) in GW 17–18 human frontal cortex (N = 355 cells for GW 17 and 172 cells for GW 18). Data are presented as mean values. Images are representative examples of experiments performed in at least two independent fetal brains. Source data
Fig. 5
Fig. 5. Basal process inheritance does not predict bRG fate on asymmetric division.
a, Live/fixed correlative analysis of basal process inheritance in a dividing bRG cell generating a process-inheriting bRG daughter and neuron, within a cerebral organoid. b, Live/fixed correlative analysis of basal process inheritance in a dividing bRG cell generating a process-inheriting IP daughter and a bRG daughter, within a cerebral organoid. c, Distribution of cell fates depending on process inheritance upon asymmetric cell division in week 8–10 cerebral organoids (N = 79 asymmetrically dividing cells from five experiments). d, Proportion of self-renewing versus differentiating daughter cells upon asymmetric division, depending on process inheritance in week 8–10 cerebral organoids (N = 79 asymmetrically dividing cells from five experiments). e, Live/fixed correlative analysis of basal process inheritance in a dividing bRG cell generating a process-inheriting bRG daughter and a neuron, within fetal frontal cortex. f, Live/fixed correlative analysis of basal process inheritance in a dividing bRG cell generating a process-inheriting IP daughter and a bRG daughter, within fetal frontal cortex. g, Distribution of cell fates depending on process inheritance upon asymmetric cell division in GW 14–17 human frontal cortex (N = 82 asymmetrically dividing cells from two experiments). h, Proportion of self-renewing versus differentiating daughter cells upon asymmetric division, depending on process inheritance in GW 14–17 human frontal cortex (N = 82 asymmetrically dividing cells from two experiments). All images are representative examples of experiments performed in at least three independent organoid batches and two independent fetal brains. N, neuron; D, differentiating daughter.
Fig. 6
Fig. 6. HES1 is preferentially expressed in bRG daughters, irrespective of process inheritance.
a, HES1, EOMES and NEUN immunostaining in human cerebral organoid at week 8. b, Distribution of division modes identified in bRG cells within week 8–11 cerebral organoids. bRG daughter (EOMES− and NEUN−), differentiating daughter (EOMES+ or NEUN+) (N = 276 bRG cells from three batches of organoids). c, Live/fixed correlative analysis of an asymmetrically dividing bRG cell revealing HES1 expression specifically in self-renewing daughter (EOMES− and NEUN−). d, Summary of HES1 expression in daughter cells depending on division modes (N = 239 cells from three batches of organoids). e, Live/fixed correlative analysis in asymmetrically dividing bRG cells revealing lack of correlation between HES1 expression and basal process inheritance. f, Summary of HES1 expression depending on process inheritance in asymmetrically dividing bRG cells, within week 8–11 cerebral organoids (N = 16 cells from three batches of organoids). All images are representative examples of experiments performed in at least three independent organoid batches.
Extended Data Fig. 1
Extended Data Fig. 1. Fate and shape of cells in cerebral organoids and fetal tissue.
a, Immunostaining for HOPX, HuC/D and SOX2 in human fetal cortex at GW18. b, Immunostaining for HOPX, EOMES and NEUN in human fetal cortex at GW18. c, Immunostaining for LIFR, HOPX and SOX2 in cortical organoids at week 15. d, Immunostaining for PTPRZ1, LIFR and SOX2 in cortical organoids at week 15.e, Immunostaining for SOX2, EOMES and NEUN in GFP-infected human fetal cortex at GW17. f, Fate of GFP+ cells in human fetal cortex at GW 14-18 (N = 2 brains, 245 cells). g, Morphology of GFP+ bRG cells in live imaged human fetal samples at GW 14-18 (N = 3 brains, 284 cells). h, Immunostaining for SOX2, EOMES and NEUN in GFP-infected cerebral organoids at week 8. i, Fate of GFP+ cells in cerebral organoids at week 8-10 (N = 3 organoid batches, 176 cells). j, Morphology of GFP+ bRG cells in live imaged cerebral organoids at week 8-10 (N = 3 organoid batches, 205 cells). Data are presented as mean values +/- SD. All images are representative examples of experiments performed in at least 3 independent organoid batches and 2 independent fetal brains. Source data
Extended Data Fig. 2
Extended Data Fig. 2. Live/fixed correlative examples and cell fate identification timing in cerebral organoids.
a, Detection of bRG, IP or neuronal cell fate relative to the time of division of the bRG mother cell in cerebral organoids at week 8-10 (873 cells from N = 5 organoid batches). b, (Top) Live/fixed correlative analysis of a dividing bRG cell generating two IP daughters. (Bottom). Live/fixed correlative analysis of a dividing bRG cell generating two bRG daughters. c, Live/fixed correlative analysis of a dividing bRG cell generating a bRG daughter and a neuronal daughter. Data are presented as mean values +/- SD. All images are representative examples of experiments performed in at least 3 independent organoid batches. Source data
Extended Data Fig. 3
Extended Data Fig. 3. Cell fate decision patterns in W7-15 cerebral organoids.
Summary of all division patterns identified in bRG cells in week 7, 8, 9, 13, 14 and 15 cerebral organoids. Week 7 (N = 114 bRG cells), week 8 (N = 164 bRG cells), week 9 (N = 106 bRG cells), week 13 (N = 206 bRG cells), week 14 (N = 254 bRG cells) and week 15 (N = 257 bRG cells).
Extended Data Fig. 4
Extended Data Fig. 4. bRG cells output in week 7-15 cerebral organoids.
a, Simulation of the output of a single bRG cell after 1-5 generations, in week 7-9 and 13-15 cerebral organoids. b, Simulation of the output of a single bRG cell after 1-5 generations in week 8 cerebral organoids (dashed lines) compared to the output of a single bRG cell that underwent 20% less symmetric amplifying divisions in favour of asymmetric indirect divisions (full lines).
Extended Data Fig. 5
Extended Data Fig. 5. Cell fate decisions, timing and division modes in fetal tissue.
a, Automated pairing of live and fixed samples and annotation of the video fields of view on the immunostained fixed samples. b, GFP+ cell matching between the live images and the fixed images. Arrowheads indicate equivalent cells. c, Live/fixed correlative analysis of a dividing bRG cell generating two bRG daughters. d, Detection of bRG, IP or neuronal cell fate relative to the time of division of the bRG mother cell in human fetal samples at GW 14-18 (1058 cells from N = 2 fetal brains). e, Summary of all division patterns identified in bRG cells at GW 18 (N = 165 bRG cells) human frontal cortex. f, Percentage of bRG cells performing proliferative divisions, of neurogenic bRG cells performing self-consuming divisions and of neurogenic bRG cells performing direct neurogenic divisions, depending on their division mode (static, apical MST or basal MST) (N = 2 fetal brains, 415 cells). Data are presented as mean values. All images are representative examples of experiments performed in at least 2 independent fetal brains. Source data
Extended Data Fig. 6
Extended Data Fig. 6. SOX2+bRG daughter cells regrow a basal process if at birth.
Live/fixed correlative analysis of a dividing bRG cell generating two bRG daughters. Asterix indicates cell soma and arrowhead indicates basal process. Mother cell (yellow) divides into a process-inheriting cell (red) and a cell that regrows a basal process (green). Representative example of an experiments performed in 3 independent organoid batches.
Extended Data Fig. 7
Extended Data Fig. 7. Notch inhibition induces RG depletion and IP generation.
a, Immunostaining for SOX2, EOMES and NEUROD2 in GFP-infected week 8 cerebral organoids, following incubation with DMSO or 5 µM DAPT for 48 hours. b. Percentage of bRG (SOX2 + ) (p = 0,0047), IPs (EOMES + ) (p = 0,0026) and Neurons (NEUROD2 + ) (p = 0,1221) newborn GFP+ cells after 48 hour treatment with DMSO or 5 µM DAPT (N = 3 organoid batches, 2422 cells). Data are presented as mean values +/- SD. **p < 0,01, by two-tailed t-test. Source data

References

    1. Cadwell CR, Bhaduri A, Mostajo-Radji MA, Keefe MG, Nowakowski TJ. Development and arealization of the cerebral cortex. Neuron. 2019;103:980–1004. doi: 10.1016/j.neuron.2019.07.009. - DOI - PMC - PubMed
    1. Nowakowski TJ, Pollen AA, Sandoval-Espinosa C, Kriegstein AR. Transformation of the radial glia scaffold demarcates two stages of human cerebral cortex development. Neuron. 2016;91:1219–1227. doi: 10.1016/j.neuron.2016.09.005. - DOI - PMC - PubMed
    1. Smart IHM, Dehay C, Giroud P, Berland M, Kennedy H. Unique morphological features of the proliferative zones and postmitotic compartments of the neural epithelium giving rise to striate and extrastriate cortex in the monkey. Cereb. Cortex. 2002;12:37–53. doi: 10.1093/cercor/12.1.37. - DOI - PMC - PubMed
    1. Hansen DV, Lui JH, Parker PRL, Kriegstein AR. Neurogenic radial glia in the outer subventricular zone of human neocortex. Nature. 2010;464:554–561. doi: 10.1038/nature08845. - DOI - PubMed
    1. Fietz SA, et al. OSVZ progenitors of human and ferret neocortex are epithelial-like and expand by integrin signaling. Nat. Neurosci. 2010;13:690–699. doi: 10.1038/nn.2553. - DOI - PubMed

Publication types