. 2024 Jun;9(6):1499-1512.
doi: 10.1038/s41564-024-01672-3. Epub 2024 Mar 28.

Crimean-Congo haemorrhagic fever virus uses LDLR to bind and enter host cells

Affiliations

Crimean-Congo haemorrhagic fever virus uses LDLR to bind and enter host cells

Vanessa M Monteil et al. Nat Microbiol. 2024 Jun.

Abstract

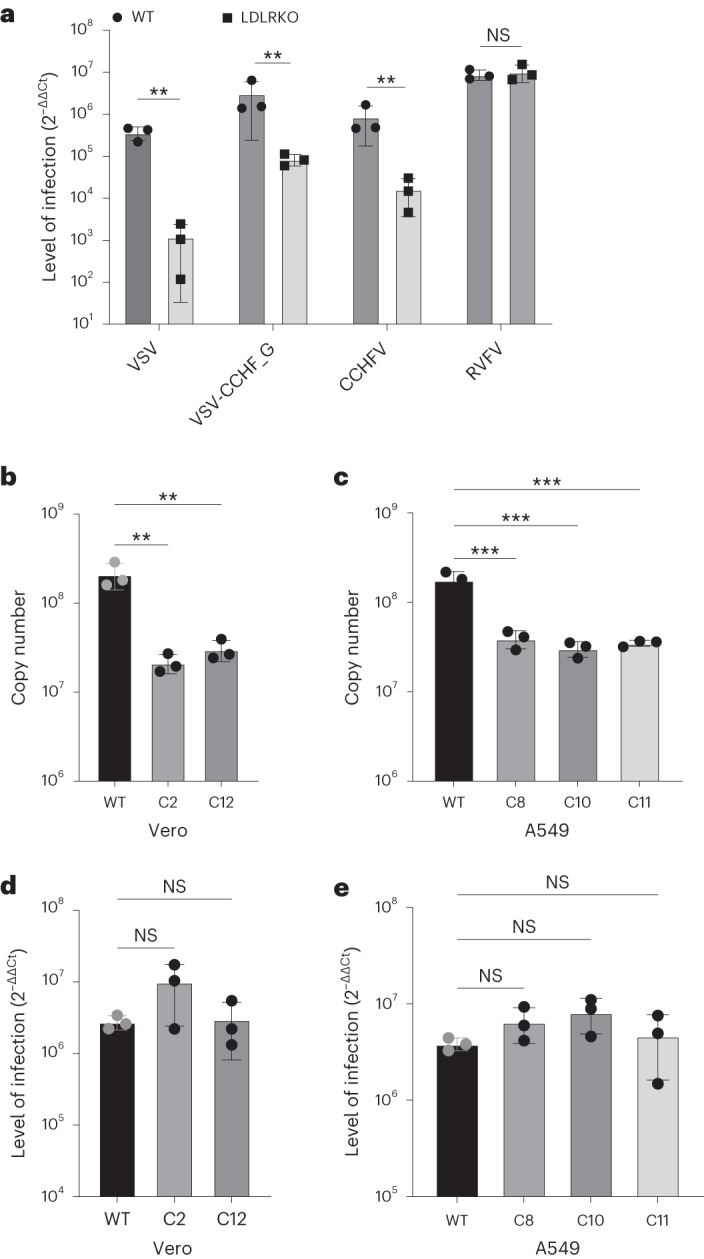
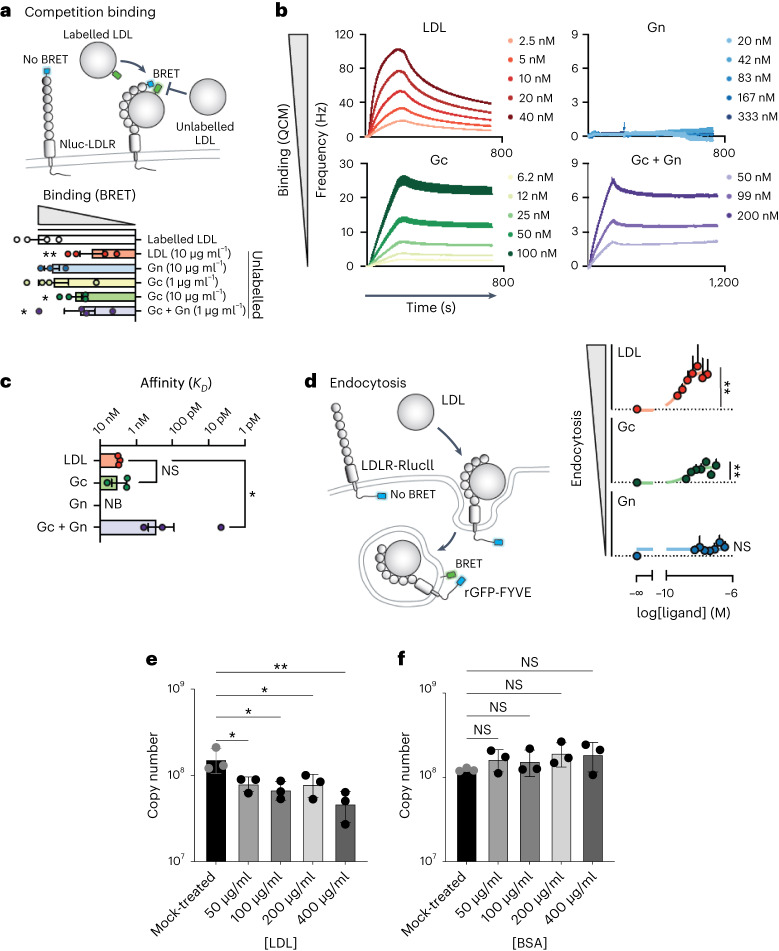
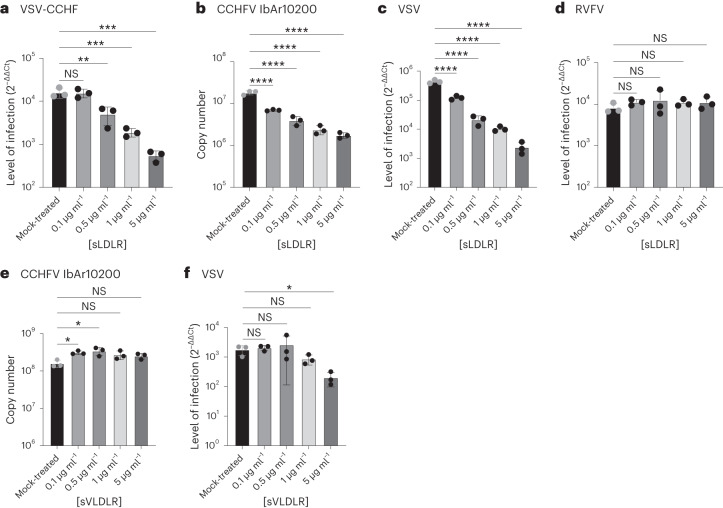
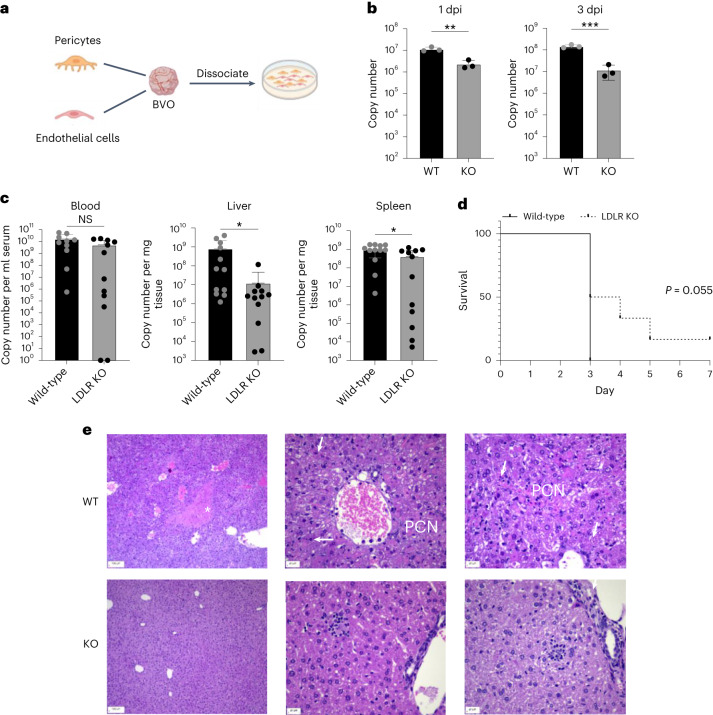
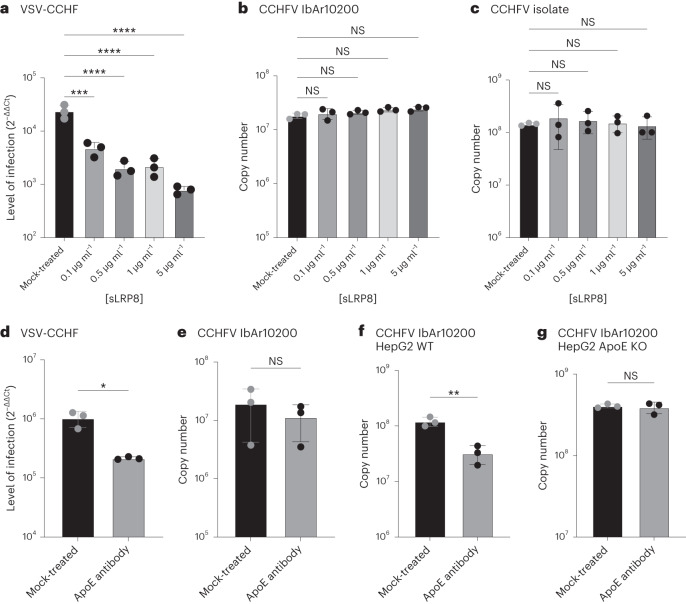
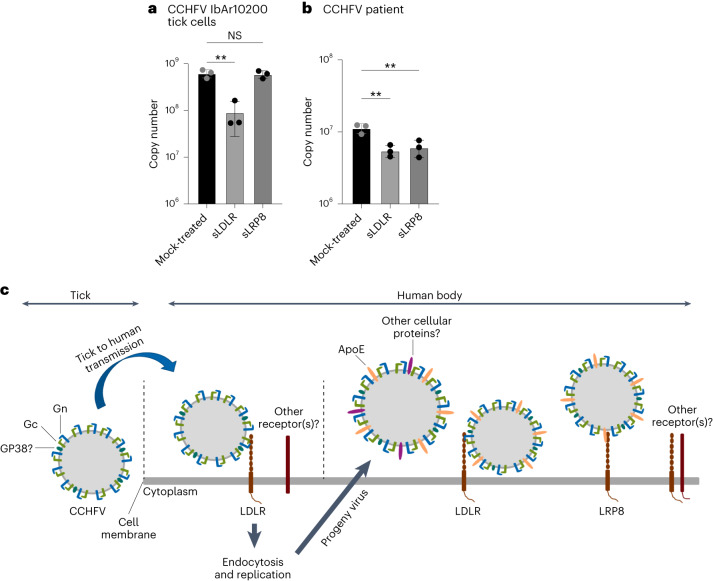
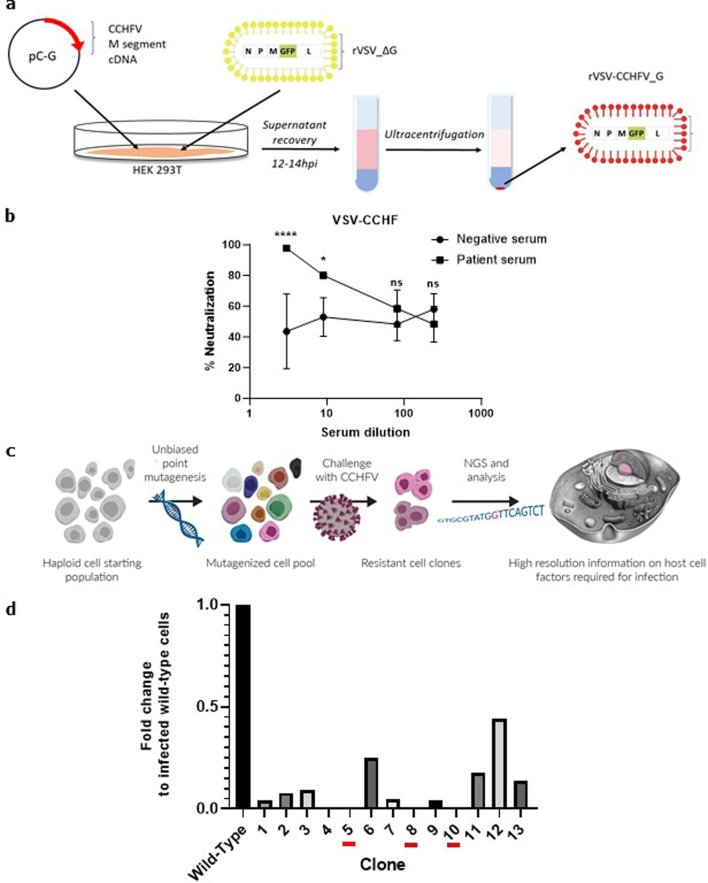
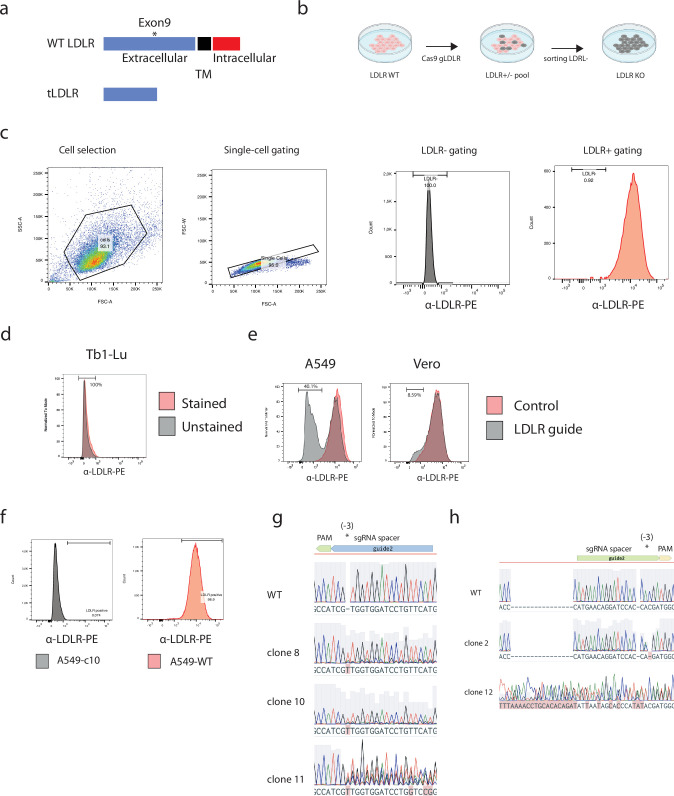
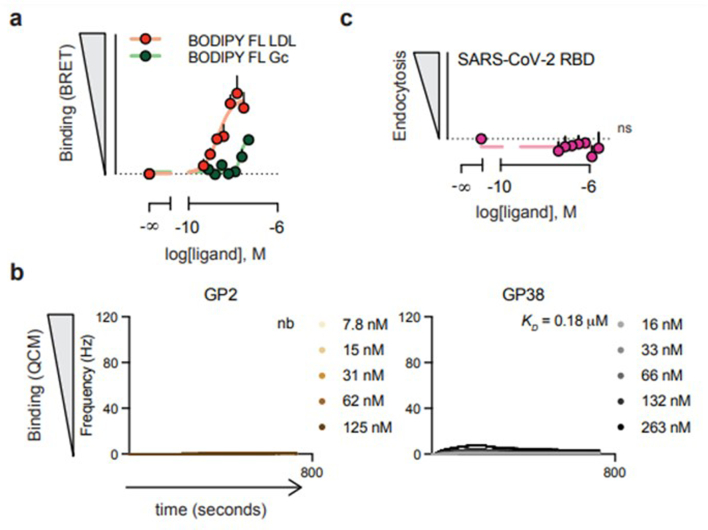
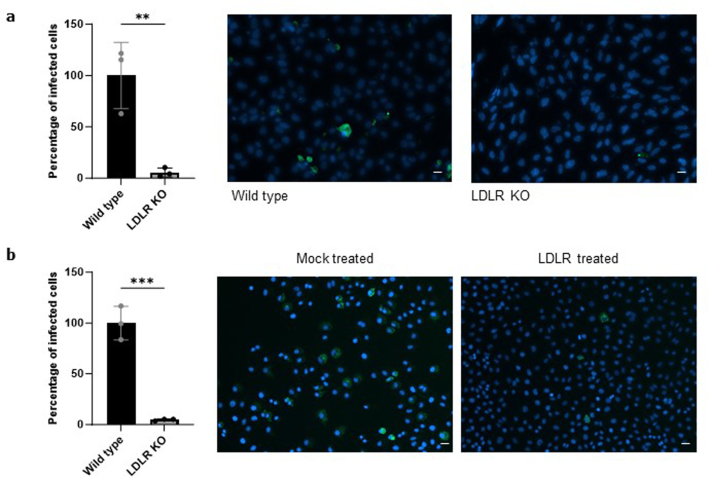
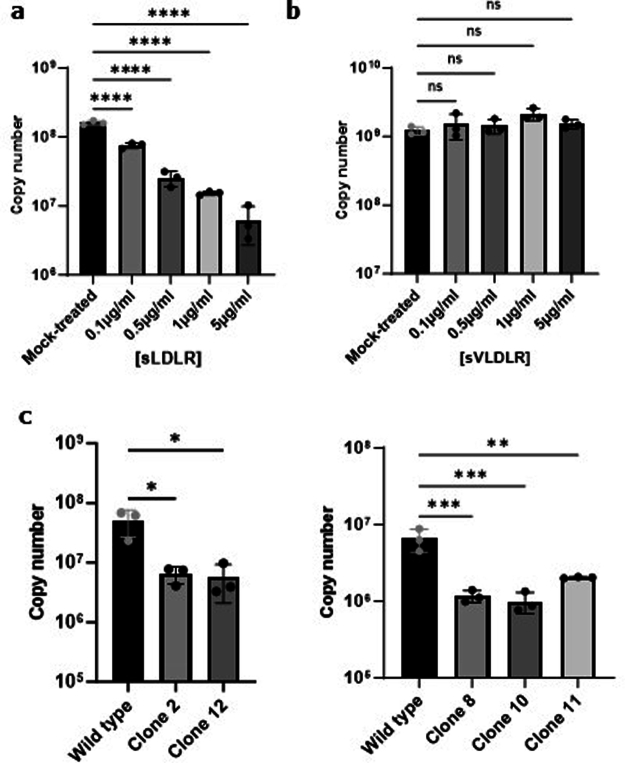
Climate change and population densities accelerated transmission of highly pathogenic viruses to humans, including the Crimean-Congo haemorrhagic fever virus (CCHFV). Here we report that the Low Density Lipoprotein Receptor (LDLR) is a critical receptor for CCHFV cell entry, playing a vital role in CCHFV infection in cell culture and blood vessel organoids. The interaction between CCHFV and LDLR is highly specific, with other members of the LDLR protein family failing to bind to or neutralize the virus. Biosensor experiments demonstrate that LDLR specifically binds the surface glycoproteins of CCHFV. Importantly, mice lacking LDLR exhibit a delay in CCHFV-induced disease. Furthermore, we identified the presence of Apolipoprotein E (ApoE) on CCHFV particles. Our findings highlight the essential role of LDLR in CCHFV infection, irrespective of ApoE presence, when the virus is produced in tick cells. This discovery holds profound implications for the development of future therapies against CCHFV.


Conflict of interest statement

J.M.P. is a founder and shareholder of JLP. V.M.L. is co‐founder, CEO and shareholder of HepaPredict AB, as well as co-founder and shareholder of PersoMedix AB, and discloses consultancy work for Enginzyme AB. M.H. is co‐founder, CEO and shareholder of Acus Laboratories GmbH and CSO of JLP Health GmbH. M.D. is an employee of Acus Laboratories GmbH and JLP Health GmbH. A.I. is an employee of Attana AB and T.A. is CSO of Attana AB. A patent application has been filed (PCT application, 2023, European patent EP 23 174 811.2). All other authors declare no competing interests.

Figures

Fig. 1
Fig. 1. CCHFV infections in Ldlr-knockout cells.
a, Levels of infection in control wild-type AN3-12 haploid and sister knockout (KO) cells infected with VSV, VSV-CCHF_G, CCHFV IbAr10200 and RVFV (MOI 0.1, 48 h post infection (h.p.i.)). Level of infection was assessed by RT–qPCR for viral and RNase P RNA. b, Levels of infection of IbAr10200 CCHFV in wild-type (WT) and two different LDLR KO (clones C2 and C12) Vero cells and c, in three different clones of LDLR KO (clones C8, C10 and C11) A549 cells. d, Levels of infection of RVFV in wild-type and two different LDLR KO (clones C2 and C12) Vero cells and e, in three different clones of LDLR KO (clones C8, C10 and C11) A549 cells. All mutant clones in be were generated using CRISPR/cas9 (Extended Data Fig. 3). Mutant haploid clones were from our previously reported Haplobank. All infections of diploid cells were done at an MOI of 0.1 for 24 h. Data are mean ± s.d. of n = 3 independent experiments. P values were calculated using two-sided unpaired Student’s t-test (Fig. 2a) and one-way ANOVA (Fig. 2b–e). **P < 0.01, ***P < 0.001, NS P > 0.05. Exact P values are available in. Source data
Fig. 2
Fig. 2. Binding of CCHFV glycoproteins to LDLR induces receptor-mediated endocytosis.
a, Illustration depicting the BRET-based binding assay that was used to indirectly measure the binding of unlabelled ligand by outcompeting BODIPY-FL labelled LDL for interaction with Nluc-tagged LDLR. BRET between Nluc-LDLR and BODIPY-FL LDL was measured following co-administration with unlabelled LDL, CCHFV Gc, Gn or Gc/Gn, and the AUC was normalized to vehicle treatment. Data are presented as mean ± s.e.m. of n = 4 biologically independent experiments; *P < 0.05, **P < 0.01 (one-way ANOVA with Fisher’s LSD test). b, Kinetic QCM experiments monitoring the interaction between LDL, CCHFV Gc, Gn or Gc/Gn with the extracellular domain of LDLR. Data are presented as mean ± s.e.m. of n = 3 independent experiments. c, Bar graph of the affinities of LDL, CCHFV Gc, Gn or Gc/Gn from QCM experiments. Data are presented as mean ± s.e.m. of n = 3 biologically independent experiments; NB, no binding; *P < 0.05 (Kruskal–Wallis test with uncorrected Dunn’s test). d, Schematic of the internalization assay to assess the ligand-dependent accumulation of LDLR at early endosomes. Cells expressing LDLR-RlucII (donor) and rGFP-FYVE (acceptor) were stimulated with vehicle or increasing concentrations of LDL, recombinant CCHFV Gc or recombinant CCHFV Gn for 45 min before BRET measurements. Data are presented as mean ± s.e.m. (n = 3 independent experiments). Binding and internalization were assessed by comparing the top and bottom parameters from nonlinear regression in the extra sum-of-squares F-test (P < 0.05). **P < 0.01; one-tailed extra sum-of-squares F-test. e, Competition assay between CCHFV and LDL in SW13 cells (MOI 0.01, 24 h.p.i.). f, BSA was used as control. Data are represented as mean ± s.d. of n = 3 independent experiments. P values were calculated using one-way ANOVA. *P < 0.05, **P < 0.01; NS P > 0.05. Exact P values are available in. Source data
Fig. 3
Fig. 3. Inhibition of CCHFV infections by soluble LDLR.
a, Levels of VSV-CCHF_G infections in human SW13 cells treated with the indicated range of soluble LDLR concentrations or left untreated (mock-treated) (MOI 0.01, 6 h.p.i.). b, Levels of IbAr10200 CCHFV infections in SW13 cells treated with a range of soluble LDLR concentrations (MOI 0.01, 24 h.p.i.). c, Levels of VSV infection in SW13 cells treated with the indicated concentrations of soluble LDLR (MOI 0.01, 6 h.p.i.). d, Levels of RVFV infection of SW13 cells treated with soluble LDLR (MOI 0.01, 24 h.p.i.). e, Levels of IbAr10200 CCHFV infection in SW13 cells treated with soluble VLDLR decoys (MOI 0.01, 24 h.p.i.). f, Levels of VSV infection in SW13 cells treated with soluble VLDLR (MOI 0.01, 6 h.p.i.). Data are mean ± s.d. of n = 3 independent experiments. One-way ANOVA; *P < 0.05, **P < 0.01, ***P < 0.001, ****P < 0.0001, NS P > 0.05. Exact P values are available in. Source data
Fig. 4
Fig. 4. CCHFV infections in human BVOs and Ldlr mutant mice.
a, Scheme representing blood vessel organoids made from LDLR+ and LDLR− iPSC cells that were dissociated and seeded as a 2D monolayer. b, Level of infection of CCHFV (IbAr10200) BVO-derived vascular cells generated from WT and LDLR KO iPSCs. Copy numbers of CCHFV RNA were determined by RT–qPCR at 1 day post infection (d.p.i.) and 3 d.p.i. (MOI 0.1). P values were calculated using two-sided unpaired Student’s t-tests. n = 3 independent experiments. c, CCHFV (IbAr10200) infections of wild-type or Ldlr KO mice. n = 12 female mice per group (400 p.f.u.s per mouse). Numbers of CCHFV RNA copies in serum, liver and spleen of wild-type and Ldlr KO mice determined on the day of euthanasia. P values were calculated using two-sided unpaired Student’s t-tests comparing two groups. Data are mean ± s.d. *P < 0.05, **P < 0.01, ***P < 0.001. d, Survival of wild-type and Ldlr KO mice. Survival analysis was done using the Kaplan–Meier test. e, Histopathological analysis (H&E staining) of livers from wild-type and some Ldlr KO mice showing little to no pathology in the Ldlr KO mice infected with CCHFV and analysed on day 4 after infection. White *, midzonal necrosis; PCN, periportal coagulative necrosis; arrows, sporadic necrosis of single cells in livers of wild-type mice. Livers of most of the Ldlr KO mice euthanized at the same time as wild-type mice showed little to no pathology. Scale bars left: 100 µm; middle and right: 20 µm. Pictures are representative of 3 mice per group. Exact P values are available in. Source data
Fig. 5
Fig. 5. Role of ApoE in CCHFV infection.
ac, Level of infection in SW13 infected with VSV-CCHF (a), CCHFV IbAr10200 (b) and CCHFV isolate (c) treated with decoy receptor LRP8 (MOI 0.01, 6 h.p.i. or 24 h.p.i.). Data are mean ± s.d. of n = 3 independent experiments. P values were calculated using one-way ANOVA. dg, Neutralization assay of VSV-CCHF produced on HEK293 cells (d), CCHFV IbAr10200 produced on SW13 cells (e), CCHFV produced on HepG2 cells (f) and CCHFV produced on HepG2 ApoE KO cells (g) using a neutralizing anti-ApoE antibody (MOI 0.01, 6 h.p.i. or 24 h.p.i.). Data are mean ± s.d. of n = 3 independent experiments. P values were calculated using two-tailed Student’s t-test. *P < 0.05, **P < 0.01; ***P < 0.001; ****P < 0.0001. NS P > 0.05. Exact P values are available in. Source data
Fig. 6
Fig. 6. Role of LDLR and LRP8 in the infection of CCHFV from ticks or human serum.
a,b, CCHFV produced on Hyalomma tick cells (a) and CCHFV from human patient serum (b) were tested for blocking with sLDLR or sLRP8 (MOI 0.01, 24 h.p.i.). Data are mean ± s.d. of n = 3 independent experiments. P values were calculated using two-tailed Student’s t-test. **P < 0.01; NS P > 0.05. c, Scheme representing CCHFV infection mechanisms. Exact P values are available in. Source data
Extended Data Fig. 1
Extended Data Fig. 1. Generation of VSV-CCHF_G and haploid cells screening.
a, Schematic representation of the methods used to produce the VSV-CCHF_G pseudotype virus in HEK293T cells. b, To validate the functionality of the glycoprotein complex in VSV-CCHF, a sero-neutralization was conducted using a serum from vaccinated person or a control serum. Data represent mean ± SD. n = 4. Two-way ANOVA. *p < 0.05, ****p < 0.001, ns: non significant. n = 3 independent experiments. Exact p-values are available in Source data. c, Scheme of the haploid cell screening system. NGS, Next Generation Sequencing d, Validation of resistant clones obtained in the primary haploid screen with VSV-CCHF_G. Each clone (1-13) was isolated, amplified and assessed for infection with the CCHFV IbAR10200 laboratory strain (MOI 0.1). The data show the level of infection for each clone compared to wild-type haploid cells (AN3-12) as determined by RT-PCR for CCHFV and RNase P RNA 24hpi. Source data
Extended Data Fig. 2
Extended Data Fig. 2. Generation and validation of knockouts in A549 and Vero cells.
a, Schematic of CRISPR-Cas9 editing strategy. The extracellular region of LDLR was targeted, leading to putative N-terminally truncated proteins not displayed on the cell surface for entry. b,Schematic of editing and α-LDLR sorting procedure. c, Gating strategy and PE intensity from α-LDLR-PE staining are shown. α-LDLR-PE staining was evaluated on single cells. Event densities were smoothened and are displayed as absolute counts or as counts normalization to the mode. Numbers indicate the percentage of single cells defined as α-LDLR-PE negative. d, Non-reactive and stained Tb1-Lu cells were used as negative control. PE intensity from α-LDLR-PE staining is shown. Event density was smoothened by normalization to the mode. e, Bulk sorting after transfection and transient Puromycin selection of α-LDLR-PE stained A549 or Vero cells, edited or unmodified (control) via CRISPR-Cas9. Event densities were smoothened and are displayed as counts normalization to the mode. f, Flow-cytometry result from A549-wild type and edited A549 clone 10 cells. PE intensity from α-LDLR-PE staining is shown. Event density was smoothened by normalization to the mode. Numbers indicate the percentage of single cells defined as α-LDLR-PE positive for A549 clone 10 and unmodified WT cells. Event densities were smoothened and are displayed as absolute counts. g, Sanger sequencing of PCR products from the LDLR genomic locus CRISPR-Cas9 editing site for A549 clones 8, 10 and 11 alongside unmodified wild-type cells are shown (via benchling.com alignment). The sgRNA spacer, PAM and expected Cas9 editing site (3 base-pairs downstream of PAM sequence) are shown above the sequencing traces. h, Same as shown for f, but for Vero cell clones C2, C12 and wild-type cells. Source data
Extended Data Fig. 3
Extended Data Fig. 3. Additional measures of ligand selectivity at LDLR and controls for BRET and QCM experiments.
a, Cells expressing Nluc-LDLR (donor) were stimulated with vehicle or increasing concentrations of BODIPY-FL-labelled LDL or Gc (acceptor) for 90 min during which the BRET was measured continuously. Data are represented as the mean area under the curve ± SEM (n = 5 biologically independent samples). b, Kinetic QCM experiments monitoring the interaction between G2 (Toscana virus) or GP38 with the extracellular domain of LDLR. Data are presented as mean ± s.e.m. of n = 3 independent experiments. c, SARS-CoV-2 RBD does not induce internalization of LDLR. Data are represented as the mean ± SEM (n = 3). Binding and internalization were assessed by comparing the top and bottom parameters from non-linear regression in the extra sum-of-squares F-test (P < 0.05). ns non-significant (one-tailed extra sum-of-squares F test). Source data
Extended Data Fig. 4
Extended Data Fig. 4. Immunoflurorescence assays.
a, Immunofluorescence staining of CCHFV in wild-type and LDLR KO cells. P values were calculating using two tailed student t-test. Data are presented as mean values +/- SD. **P < 0.01. n = 3 independent experiments. Scale bar: 10 µm b, Immunofluorescence staining of CCHFV in SW13 cells infected with CCHFV mock or sLDLR treated. P values were calculating using two tailed student t-test. ***P < 0.001. Data are presented as mean values +/- SD. n = 3 independent experiments. Scale bar: 10 µm. All Pictures are representative of 3 wells from independent experiments. Exact p-values are available in Source data. Source data
Extended Data Fig. 5
Extended Data Fig. 5. Creation and validation of NC8 cells knocked out for LDLR.
a, Gating strategy and PE intensity from α-LDLR-PE staining are shown. α-LDLR-PE staining was evaluated on single cells. b, Sorting results from bulk NC8 iPSC after Cas9 LDLR editing. PE intensity from α-LDLR-PE staining is shown for cells targeted with an LDLR guide RNA or for unmodified control cells. Event densities were smoothened and are displayed as absolute counts or as counts normalization to the mode. c, Qualitative flow-cytometry result of selected clones stained with an α-LDLR-PE antibody. Shown is the PE intensity from α-LDLR-PE staining from gated single cells of LDLR- or LDLR+ iPSC clones. d, Flow-cytometry result of the studied LDLR-KO or wild-type LDLR iPSC clones (clone 4, clone 10). Shown is the overlayed mode-normalized density of PE intensity from α-LDLR-PE staining for clone 10 and 4. The legend percentages indicate the fraction of α-LDLR-PE negative stained single cells. e, Sanger sequencing of PCR product from the LDLR genomic locus CRISPR-Cas9 editing site for NC8 iPSC clones 10 and clone 4 are shown. The sgRNA spacer, PAM and expected Cas9 editing site (3 base-pairs downstream of PAM sequence) are shown above the sequencing traces. Source data
Extended Data Fig. 6
Extended Data Fig. 6. Validation of LDLR with a CCHFV patient isolate.
CCHFV was isolated from the serum of a Turkish patient and this clinical isolate used for all subsequent experiment in Fig. 6. a, b, Levels of CCHFV infections of SW13 cells treated (MOI 0.01, 24hpi) with the indicated concentrations of sLDLR, and sVLDLR. a, sLDLR. b, sVLDLR c, Levels of infection with clinical CCHFV in wild type and LDLR KO (clones C2 and C12) Vero cells and in wild type and LDLR KO (clones C8, C10 and C11) A549 cells (MOI 0.1, 24hpi). Graphs show mean value ± SD. n = 3 independent experiments. P values were calculating using One-way ANOVA. *P < 0.05, **P < 0.01; *** P < 0.001; **** P < 0.0001. Non significant: p > 0.05. Exact p-values are available in Source data. Source data

References

    1. Cases of Crimean–Congo Haemorrhagic Fever in the EU/EEA, 2013–Present (ECDC, 2024); https://www.ecdc.europa.eu/en/crimean-congo-haemorrhagic-fever/surveilla...
    1. Estrada-Peña A, Sánchez N, Estrada-Sánchez A. An assessment of the distribution and spread of the tick Hyalomma marginatum in the western Palearctic under different climate scenarios. Vector Borne Zoonotic Dis. 2012;12:758–768. doi: 10.1089/vbz.2011.0771. - DOI - PubMed
    1. Fernández-Ruiz, N. & Estrada-Peña, A. Towards new horizons: climate trends in Europe increase the environmental suitability for permanent populations of Hyalomma marginatum (Ixodidae). Pathogens10, 95 (2021). - PMC - PubMed
    1. Gillingham EL, Medlock JM, Macintyre H, Phalkey R. Modelling the current and future temperature suitability of the UK for the vector Hyalomma marginatum (Acari: Ixodidae) Ticks Tick Borne Dis. 2023;14:102112. doi: 10.1016/j.ttbdis.2022.102112. - DOI - PubMed
    1. Simon M, Johansson C, Mirazimi A. Crimean-Congo hemorrhagic fever virus entry and replication is clathrin-, pH- and cholesterol-dependent. J. Gen. Virol. 2009;90:210–215. doi: 10.1099/vir.0.006387-0. - DOI - PubMed