. 2024 Apr;56(4):652-662.
doi: 10.1038/s41588-024-01688-9. Epub 2024 Mar 28.

A single-cell atlas enables mapping of homeostatic cellular shifts in the adult human breast

Affiliations

A single-cell atlas enables mapping of homeostatic cellular shifts in the adult human breast

Austin D Reed et al. Nat Genet. 2024 Apr.

Abstract

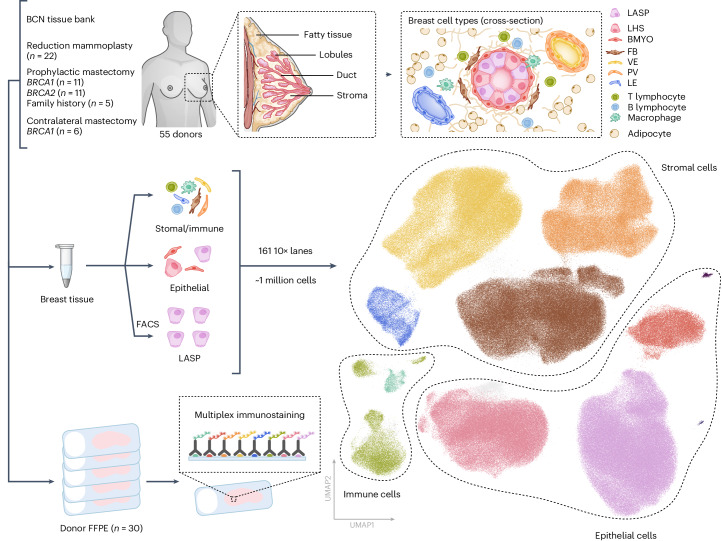
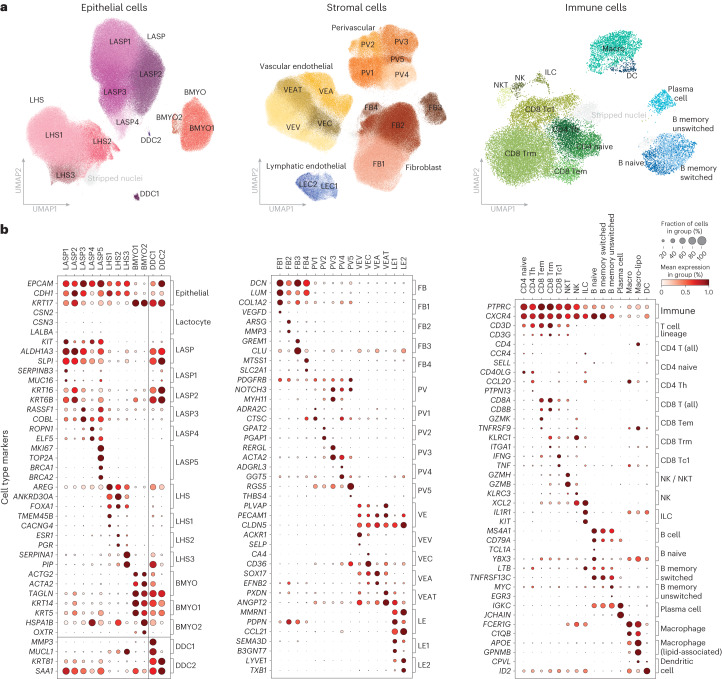
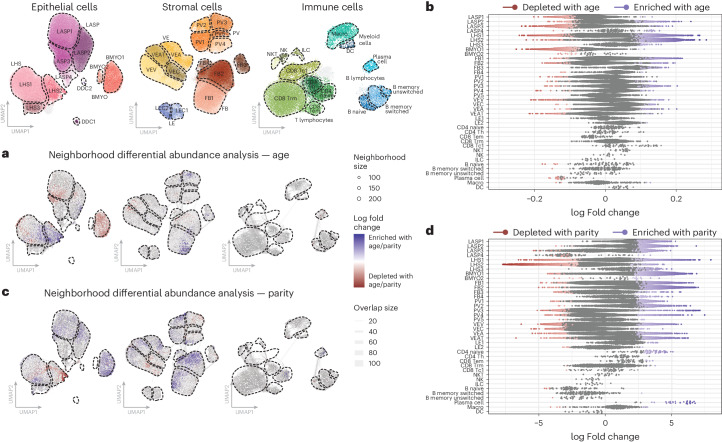
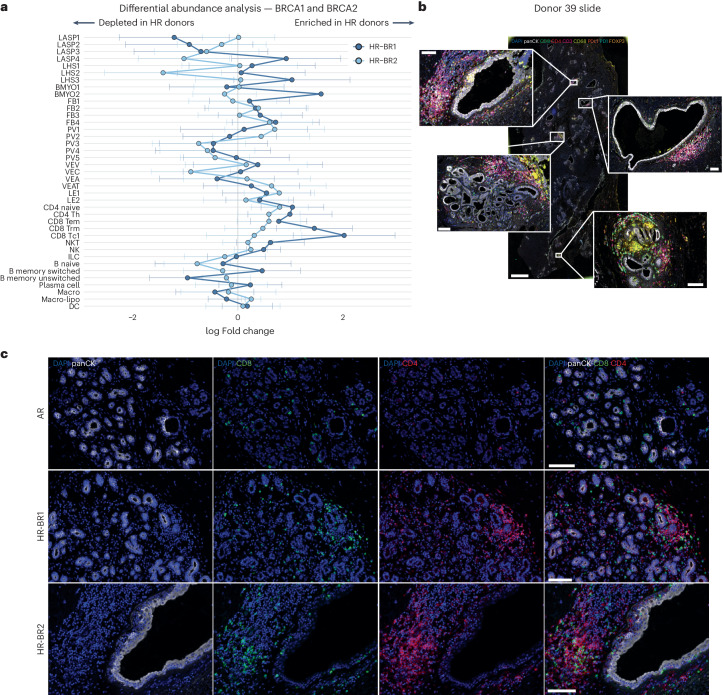
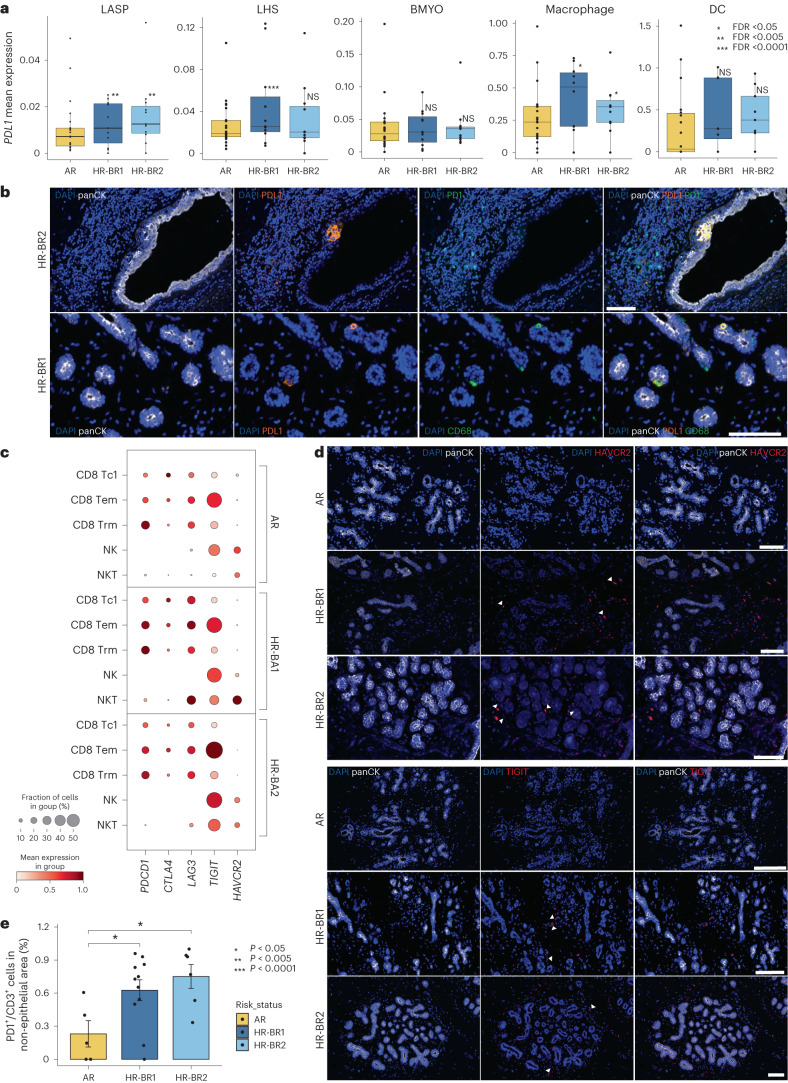
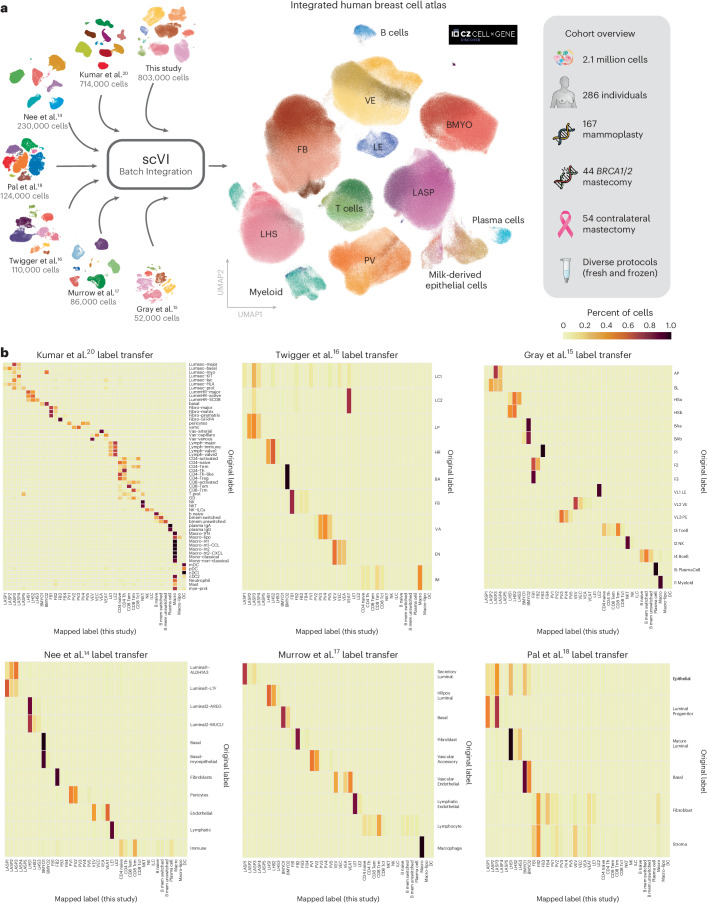
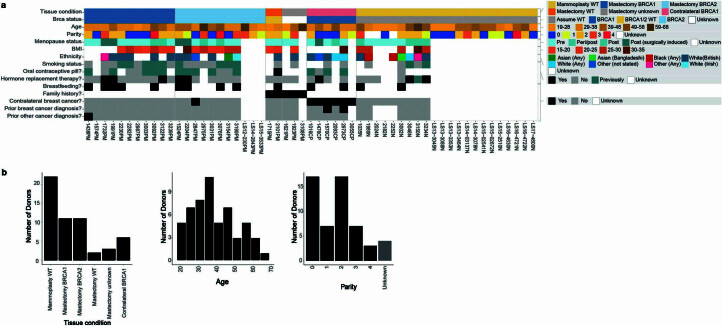
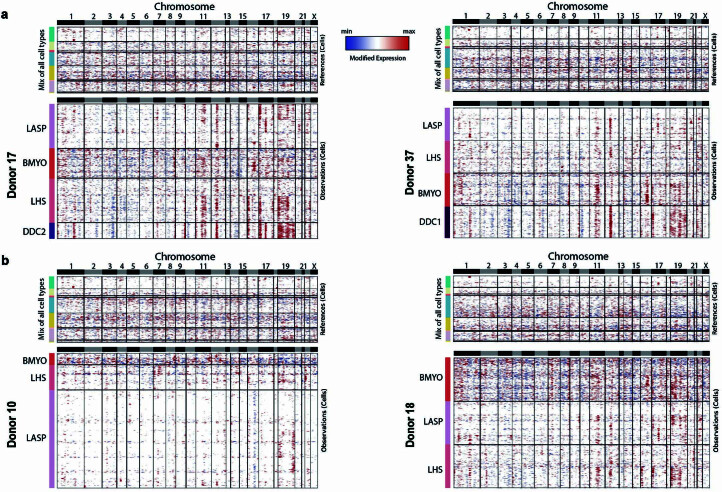
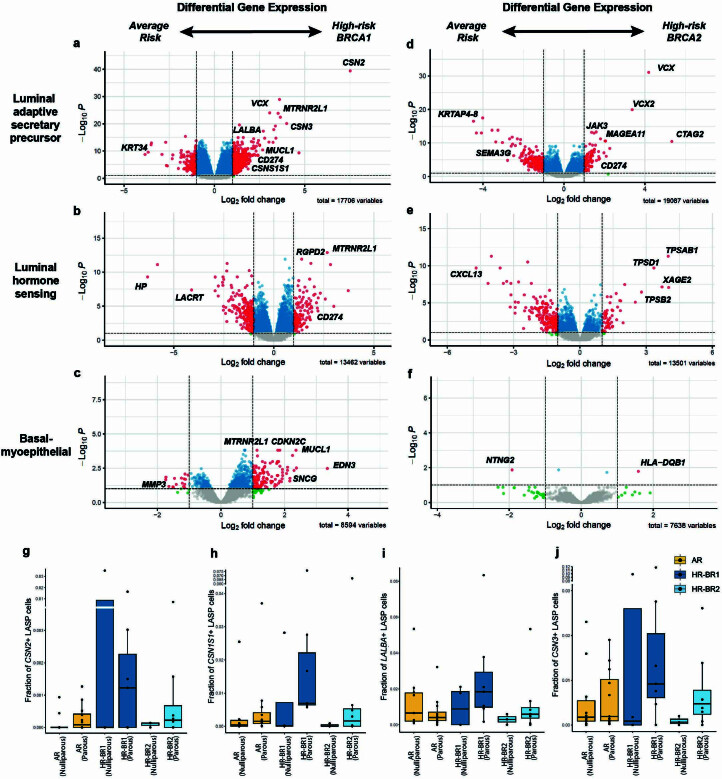
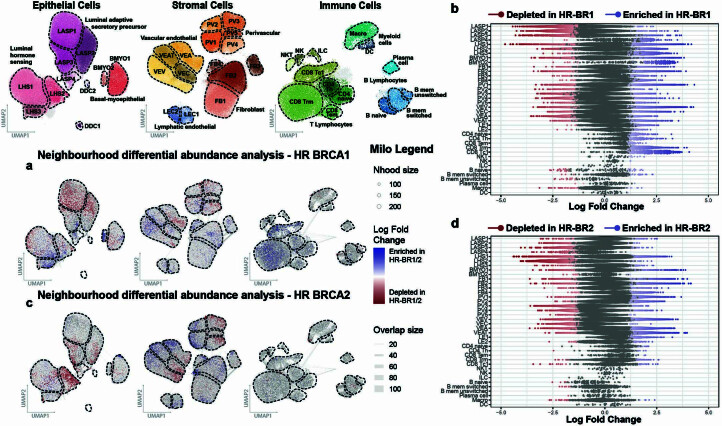
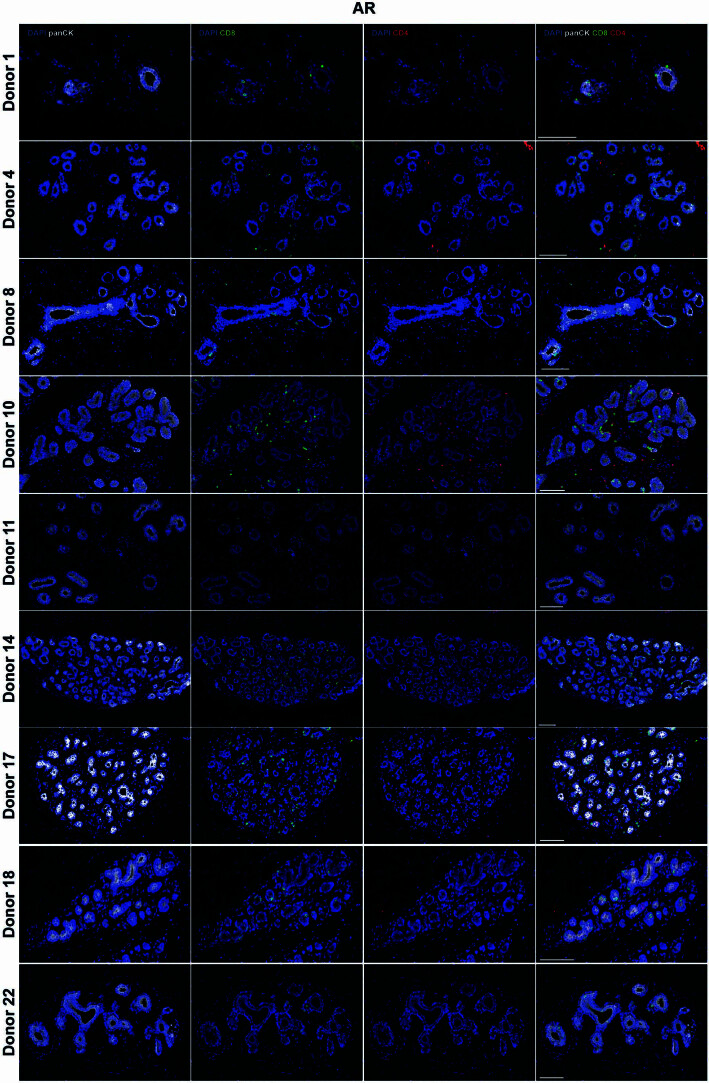
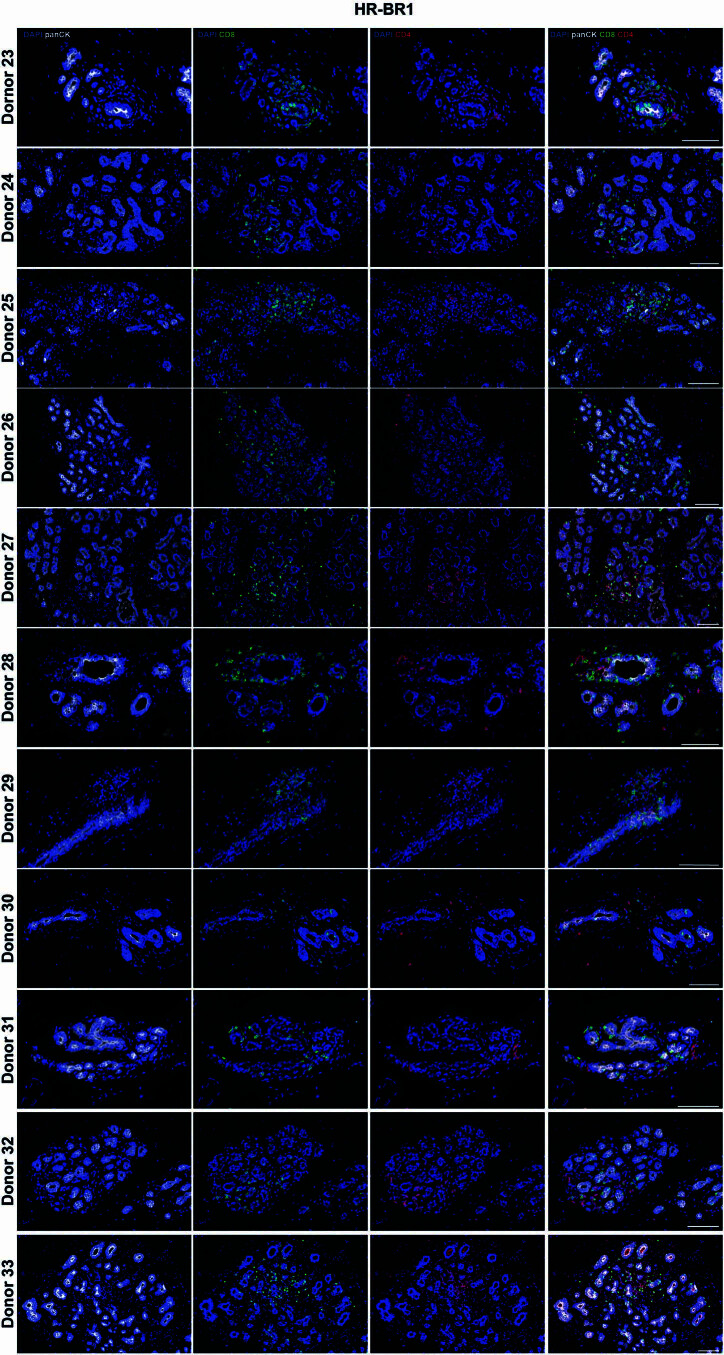
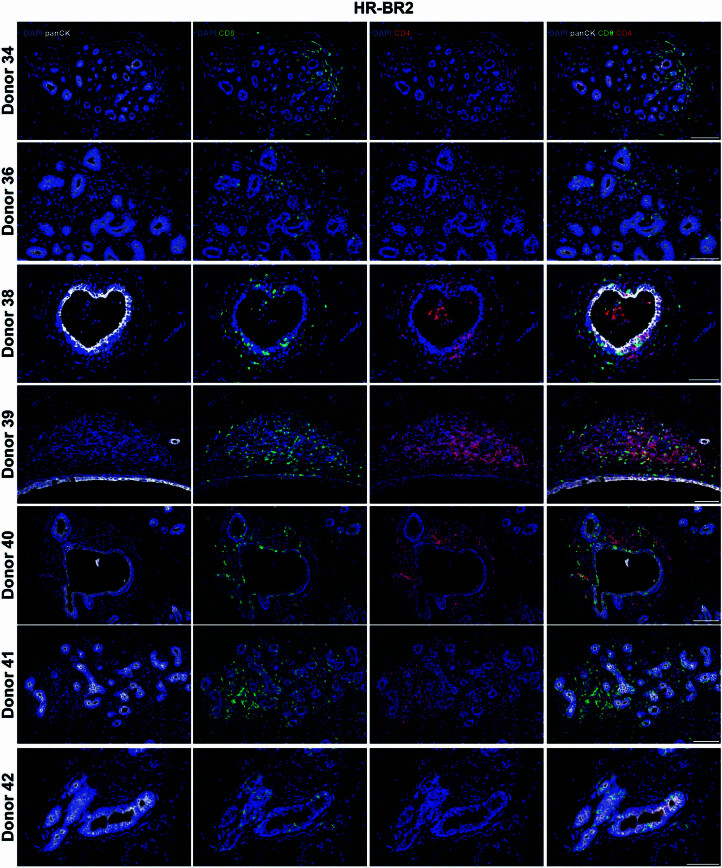
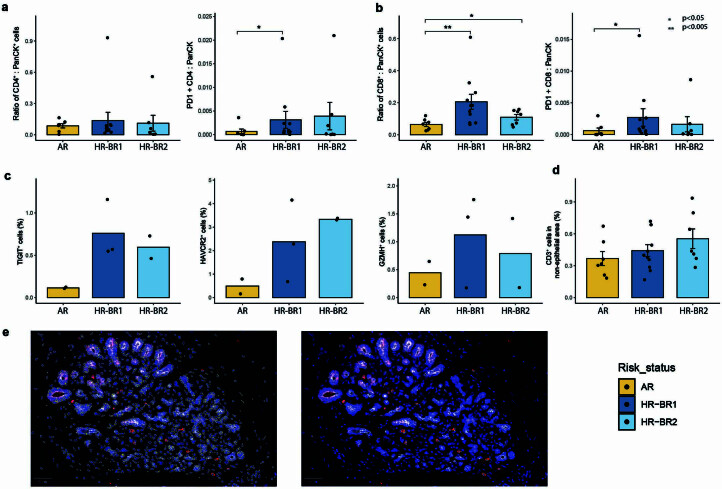
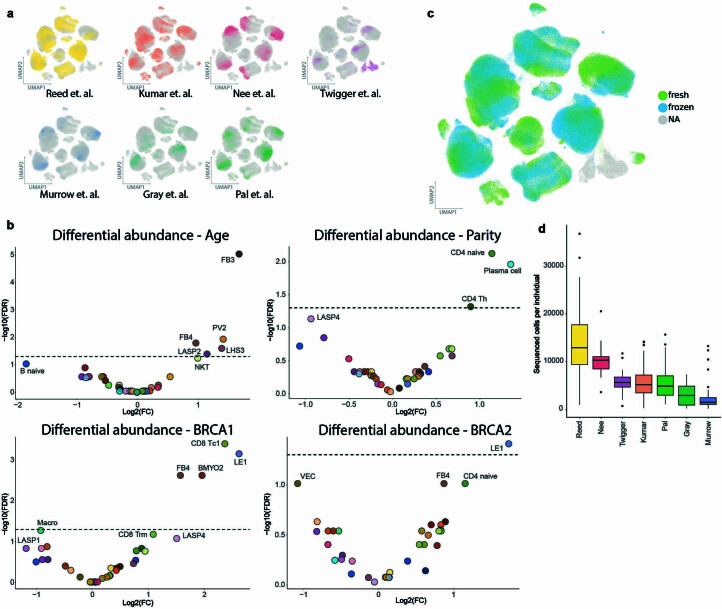
Here we use single-cell RNA sequencing to compile a human breast cell atlas assembled from 55 donors that had undergone reduction mammoplasties or risk reduction mastectomies. From more than 800,000 cells we identified 41 cell subclusters across the epithelial, immune and stromal compartments. The contribution of these different clusters varied according to the natural history of the tissue. Age, parity and germline mutations, known to modulate the risk of developing breast cancer, affected the homeostatic cellular state of the breast in different ways. We found that immune cells from BRCA1 or BRCA2 carriers had a distinct gene expression signature indicative of potential immune exhaustion, which was validated by immunohistochemistry. This suggests that immune-escape mechanisms could manifest in non-cancerous tissues very early during tumor initiation. This atlas is a rich resource that can be used to inform novel approaches for early detection and prevention of breast cancer.


Conflict of interest statement

J.C.M. has been an employee of Genentech since September 2022. The other authors declare no competing interests.

Figures

Fig. 1
Fig. 1. Overview of the HBCA.
A schematic highlighting the overall experimental design and the cell types we aimed to capture in the atlas. The diagram highlights the overall number of donors sequenced and how they are distributed among the various subgroups alongside the number of donor FFPE tissues that have been analyzed by multiplex immunostaining. The global UMAP representation of the final dataset is colored by general cell types captured from all 161 samples processed as part of this atlas.
Fig. 2
Fig. 2. Major cellular groups identified in the HBCA.
a, UMAP plots of the epithelial, stromal and immune cell compartments colored and labeled by subcluster annotations. Doublets/stripped nuclei are plotted in gray. b, Dot plots summarizing the known markers used to identify cell types and a selection of genes distinguishing each subcluster for the epithelial (left), stromal (middle) and immune (right) compartments. Each column corresponds to a specific cell subcluster and the rows correspond to a list of key marker genes (expression normalized per gene), brackets on the right side of each plot detail the cell type or subcluster that these genes mark.
Fig. 3
Fig. 3. Age and parity affect the homeostatic cellular state of the breast.
a, Milo cell neighborhood differential abundance plots of the significant (FDR <0.05) changes in the breast composition with age, blocking for the effects of parity (mammoplasty donors; n = 22). We test the effects of age as a continuous scale ranging from 19 to 65 years, with the color gradient scale representing log fold changes per year. Blue represents enrichment with age while red denotes depletion with age. b, Beeswarm plot of the log fold changes in the Milo neighborhoods with age, grouped into each cell-type subcluster. Neighborhoods with a significant change in cellular abundance are colored as indicated. Log fold changes are per year due to the continuous age scale tested. c, Milo cellular neighborhood differential abundance plots of the significant (FDR <0.05) changes in the breast composition with parity (that is, nulliparous versus parous), blocking for the effects of ageing (mammoplasty donors; n = 22). Blue represents enrichment with parity while red denotes depletion with parity. d, Beeswarm plot of the log fold changes of the Milo neighborhoods with parity, grouped into each cell-type subcluster. Neighborhoods with a significant change in cellular abundance are colored as indicated.
Fig. 4
Fig. 4. HR-BR1 and HR-BR2 germline mutations associated with increased proportions of immune cells in the breast.
a, Summary plot of average Milo differential abundance results comparing the cellular composition of the breast from AR donors against HR-BR1 and HR-BR2 donors, blocking for the effects of both age and parity. To enable fair comparisons, neighborhoods were computed to be shared by AR/HR-BR1 and AR/HR-BR2 tests. The plot summarizes the mean and variance of log fold changes for each cell subcluster in both the HR-BR1 and HR-BR2 cohorts. A zero log fold change represents the same subcluster proportions as AR donor tissue on average, while positive (negative) log fold changes denote subcluster enrichment (depletion) in the relative HR donor breast. See Extended Data Fig. 5 for full Milo results in HR comparisons. b, Example of whole section output using the Ultivue staining technology. DAPI, panCK, CD8, CD4, CD3, CD68, PDL1, PD1 and FOXP3 staining with colors indicated in figure are shown on a whole section and magnified insets from a representative donor. Scale bars, 100 µm in the insets, 2 mm in the whole section image. c, Ultivue staining showing panCK (white), CD8 (green), CD4 (red) and DAPI (blue) of breast sections from representative AR (n = 10), HR-BR1 (n = 11) and HR-BR2 (n = 8) donors as indicated. Scale bars, 100 µm.
Fig. 5
Fig. 5. HR-BR1 and HR-BR2 donor breast tissue display increased expression of immune checkpoint inhibition and exhaustion markers.
a, Boxplots visualizing the change in mean expression (log-transformed counts) for immune checkpoint ligand PDL1, identified as significantly upregulated in HR-BR1 (LASP, LHS and macrophage) and HR-BR2 (LASP and macrophage) donors with respect to AR controls. FDR values derived from edgeR pseudobulk differential gene expression testing for AR versus HR-BR1 and AR versus HR-BR2 (n = 33 in both comparisons; see Methods and Extended Data Fig. 4 for more details). The boxplot centers show median values while the minima/maxima show the 25th/75th percentiles, respectively, and whiskers extend to the most extreme datapoint within 1.5× interquartile range of the outer hinge of the boxplot. b, Top: Ultivue staining showing panCK (white), PDL1 (orange), PD1 (green) and DAPI (blue) of a breast section from an HR donor showing an example of epithelial expression of PDL1. Bottom: Ultivue staining showing panCK (white), PDL1 (orange), CD68 (green) and DAPI (blue) of a breast section from an HR donor showing examples of CD68 cells expressing PDL1. Scale bars, 100 µm. c, Dot plot displaying the expression of several key immune checkpoint receptors expression in a range of cytotoxic lymphoid subclusters comparing between AR, HR-BR1 and HR-BR2 donor groups. Expression is normalized per gene. d, Top: immunofluorescence staining showing panCK (white), HAVCR2 (red) and DAPI (blue) of representative breast sections from AR and HR donors. Bottom: immunofluorescence staining showing panCK (white), TIGIT (red) and DAPI (blue) of a representative breast section from AR and HR donors. Arrowheads point at examples of positive cells. Each staining is representative of two (AR, HR-BR2) or three (HR-BR1) donor samples. Scale bars, 100 µm. e, Bar plot showing the percentage of PD1+/CD3+ double-positive cells located in non-epithelial epithelial areas (that is not intercalated with the epithelium) in HR-BR1/2 donor compared with AR donors in whole Ultivue slides (Methods). The P values are calculated with one-way non-parametric Wilcoxon tests for both AR versus HR-BR1 (n = 21, P = 0.02) and AR versus HR-BR2 (n = 18, P = 0.018) comparisons. Error bars show the standard error of the mean.
Fig. 6
Fig. 6. The iHBCA provides quantitative comparison of cell-type annotations across seven of the largest scRNA-seq datasets for the breast.
a, A schematic showing the curation of the iHBCA combining seven of the largest scRNA sequencing datasets for the breast. The diagram highlights the composition and sample heterogeneity captured by the iHBCA. The central plot shows a global UMAP representation of the dataset colored by transferred subcluster annotations (Fig. 2) from the HBCA. Annotation labels were mapped using CellTypist logistic regression models (Methods). b, A set of six confusion matrices showing the cell type/subcluster comparisons between each of the published datasets and our own subcluster annotations. Each cell (row A, column B) shows the percentage of cells of type A in the original dataset that are mapped to cell type B in our HBCA subcluster annotations. Note: LC1/2 cells from the Twigger dataset are cells thought to appear only in the lactating gland and are hence absent from the HBCA cohort causing their nonsensical logistic regression mapping.
Extended Data Fig. 1
Extended Data Fig. 1. Summary of major demographic metadata.
(a) Summary table visualising some of the main demographics metadata for each of our donors. Full metadata listed per sample (10X lane) in Supplementary Table 1. (b) Bar plot/histograms showing the total distribution of our main three demographics explored in the paper – tissue condition (surgery and BRCA status), age and parity.
Extended Data Fig. 2
Extended Data Fig. 2. Specificity of subcluster gene signatures.
Gene scores for the four molecular subtypes of breast cancer on the epithelial subclusters based gene sets described in Wu et. al..
Extended Data Fig. 3
Extended Data Fig. 3. InferCNV predicts putative CNV profiles in the DDC1/2 clusters.
(a) Denoised inferCNV output plot predicting copy number variation (CNV) profiles per cell over the epithelium of Donors 17 (left) and 37 (right), both containing the unique donor derived clusters (DDCs). Red (blue) indicates increased (decreased) expression in the respective genomic region. For each inferCNV test, a reference dataset of cells sampled from mammoplasty donors (excluding those tested) plus the remaining stroma/immune cells of the tested donor, were used to account for any cell type or donor specific expression profiles across the genome. (b) Similar analysis as above but for two randomly selected control mammoplasty donors.
Extended Data Fig. 4
Extended Data Fig. 4. Differential gene expression of high-risk donor epithelium.
(a–c) Volcano plots showing the results of differential gene expression testing between average risk (AR) and high risk BRCA1 germline (HR-BR1) donors within the luminal adaptive secretory precursor (LASP), luminal hormone sensing (LHS) and basal-myoepithelial (BMYO) compartments respectively. Green points have significant log fold changes, blue points have significant FDR (FDR < 0.1), red points have significant log fold change and FDR. (d–f) Volcano plots showing the results of differential gene expression testing between AR and high risk BRCA2 germline (HR-BR2) donors within the LASP, LHS and BMYO compartments respectively. Green points have significant log fold changes, blue points have significant FDR (FDR < 0.1), red points have significant log fold change and FDR. (g-j) Box plots showing the upregulation of milk biosynthesis related genes in HR donors compared to AR alongside the related impact of parity on the expression of these genes. These plots show the frequency of non-zero expression of each respective gene amongst the LASP population. Sample numbers: AR nulliparous (7), AR parous (15), HR-BR1 nulliparous (4), HR-BR1 parous (7), HR-BR2 nulliparous (3), HR-BR2 parous (8). The boxplot centers show median values while the minima / maxima show the 25th /75th percentiles respectively and whiskers extend to the most extreme datapoint within 1.5 × IQR (inter-quartile range) of the outer hinge of the boxplot.
Extended Data Fig. 5
Extended Data Fig. 5. Impact of BRCA1 and BRCA2 germline mutations on the cellular composition of the breast.
(a) Milo cell neighbourhood differential abundance plots of the significant (FDR < 0.05) changes in the breast composition comparing average risk (AR) donors (n = 22) to the high risk BRCA1 germline (HR-BR1) cohort (n = 11), blocking for the effects of age and parity. Blue represents enrichment with HR-BR1, whilst red denotes depletion with HR-BR1. (b) Beeswarm plot of the log fold changes of the Milo neighbourhoods grouped into each cell type subcluster for AR versus HR-BR1. Neighbourhoods with a significant change in cellular abundance are coloured as indicated. (c) Milo cell neighbourhood differential abundance plots of the significant (FDR < 0.05) changes in the breast composition comparing AR donors (n = 22) to the high risk BRCA2 germline (HR-BR2) cohort (n = 11), blocking for the effects of age and parity. Blue represents enrichment with HR-BR2, whilst red denotes depletion with HR-BR2. (d) Beeswarm plot of the log fold changes of the Milo neighbourhoods grouped into each cell type subcluster for AR versus HR-BR2. Neighbourhoods with a significant change in cellular abundance are coloured as indicated.
Extended Data Fig. 6
Extended Data Fig. 6. CD8 and CD4 expression in AR donors.
Ultivue staining showing panCK (white), CD8 (green), CD4 (red) and DAPI (blue) of representative breast sections from AR donors (n = 9). Scale bars represent 100 µm.
Extended Data Fig. 7
Extended Data Fig. 7. CD8 and CD4 expression in HR-BR1 donors.
Ultivue staining showing panCK (white), CD8 (green), CD4 (red) and DAPI (blue) of representative breast sections from HR-BR1 donors (n = 11). Scale bars represent 100 µm.
Extended Data Fig. 8
Extended Data Fig. 8. CD8 and CD4 expression in HR-BR2 donors.
Ultivue staining showing panCK (white), CD8 (green), CD4 (red) and DAPI (blue) of representative breast sections from HR-BR2 donors (n = 7). Scale bars represent 100 µm.
Extended Data Fig. 9
Extended Data Fig. 9. Quantification of Ultivue and Immunofluorescence images.
(a) Bar plots showing the ratio of CD4+ (left) and CD4+/PD1+ double-positive (right) cells to PanCK+ cells in whole Ultivue tissue slides from average risk (AR; n = 10), high-risk BRCA1(HR-BR1; n = 11, p=) and high-risk BRCA2 (HR-BR2; n = 8) donors. The p-values are calculated with one-way non-parametric Wilcox test with * (**) indicating p < 0.05 (p < 0.005) respectively. The AR vs HR-BR1 (CD4+PD1 : PanCK) comparison has p = 0.028. Error bars show the standard error of the mean. (b) Bar plots showing the ratio of CD8+ (left) and CD8+/PD1+ double-positive (right) cells to PanCK+ cells in whole Ultivue tissue slides from average risk (AR; n = 10), high-risk BRCA1(HR-BR1; n = 11) and high-risk BRCA2 (HR-BR2; n = 8) donors. The p-values are calculated with one-way non-parametric Wilcox test with * (**) indicating p < 0.05 (p < 0.005) respectively. The AR vs HR-BR1 (CD8 : PanCK) comparison has p = 0.0041, AR vs HR-BR2 (CD8 : PanCK) comparison has p = 0.049 and AR vs HR-BR1 (CD8+PD1 : PanCK) comparison has p = 0.028. Error bars show the standard error of the mean. (c) Bar plots showing the percentage of TIGIT+ (left), HAVCR2+ (middle) and GZMH+ (right) cells from the immunofluorescence images (n = 2 for AR and HR-BR2, n = 3 for HR-BR1) shown in Fig. 5 and Supplementary Figs. 19–22. (d) Bar plot showing the percentage of CD3+ cells located in non-epithelial epithelial areas (ie. not intercalated with the epithelium) in HR-BR1 (n = 11) and HR-BR2 (n = 8) donors compared to AR (n = 10) donors in whole Ultivue slides (see Methods). No significant differences were found with one-way non-parametric Wilcox test. Error bars show the standard error of the mean. (e) Example segmentation and calling of positive cells of an immunofluorescence (GZMH) image (AR n = 2, HR-BR1 n = 3, HR-BR2 n = 2).
Extended Data Fig. 10
Extended Data Fig. 10. The integrated Human Breast Cell Atlas (iHBCA) highlights effects of tissue preparation and confirms Milo differential abundance results.
(a) The global iHBCA uniform manifold approximation and projection (UMAP) plots coloured individually by each dataset (rest plotted underneath in grey). (b) Standard negative-binomial differential abundance analysis performed on the iHBCA for each of the comparisons previously explored using Milo on the Human Breast Cell Atlas (HBCA). Here we used the same base blocking terms as used in the milo analysis but with additional terms for dataset and live_sorting status (see Methods for details). (c) Global iHBCA UMAP showing the distribution of cells from fresh and frozen tissue. (d) Box and whisker plot showing the number of cells sequenced per individual across datasets. Donor numbers: Reed (n = 55), Nee (n = 22), Twigger (n = 18), Kumar (n = 126), Pal (n = 21), Gray (n = 16), Murrow (n = 28). The boxplot centers show median values while the minima / maxima show the 25th /75th percentiles respectively and whiskers extend to the most extreme datapoint within 1.5 × IQR (inter-quartile range) of the outer hinge of the boxplot. Outliers are then displayed independently.

References

    1. Curtis C, et al. The genomic and transcriptomic architecture of 2,000 breast tumours reveals novel subgroups. Nature. 2012;486:346–352. doi: 10.1038/nature10983. - DOI - PMC - PubMed
    1. TCGA. Comprehensive molecular portraits of human breast tumours. Nature490, 61–70 (2012). - PMC - PubMed
    1. Molyneux G, et al. BRCA1 basal-like breast cancers originate from luminal epithelial progenitors and not from basal stem cells. Cell Stem Cell. 2010;7:403–417. doi: 10.1016/j.stem.2010.07.010. - DOI - PubMed
    1. Lee JA, Chin PG, Kukull WA, Tompkins RS, Weatherall AF. Relationship of age to incidence of breast cancer in young women. J. Natl Cancer Inst. 1976;57:753–756. doi: 10.1093/jnci/57.4.753. - DOI - PubMed
    1. Schedin P. Pregnancy-associated breast cancer and metastasis. Nat. Rev. Cancer. 2006;6:281–291. doi: 10.1038/nrc1839. - DOI - PubMed