. 2024 Apr;56(4):569-578.
doi: 10.1038/s41588-024-01684-z. Epub 2024 Mar 28.

Protein-altering variants at copy number-variable regions influence diverse human phenotypes

Affiliations

Protein-altering variants at copy number-variable regions influence diverse human phenotypes

Margaux L A Hujoel et al. Nat Genet. 2024 Apr.

Abstract

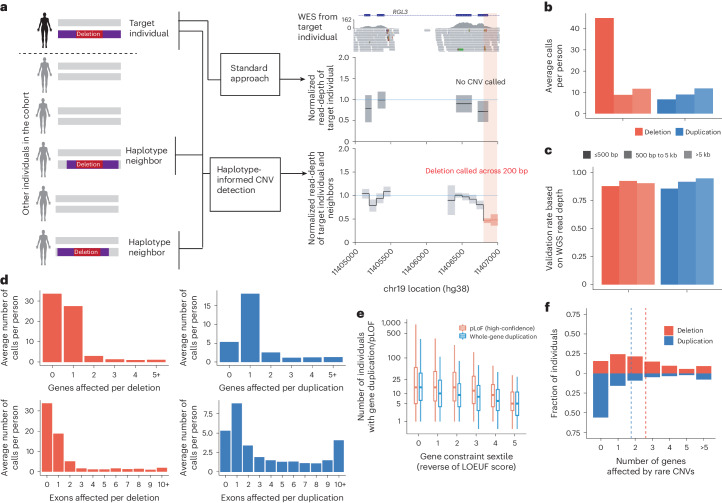
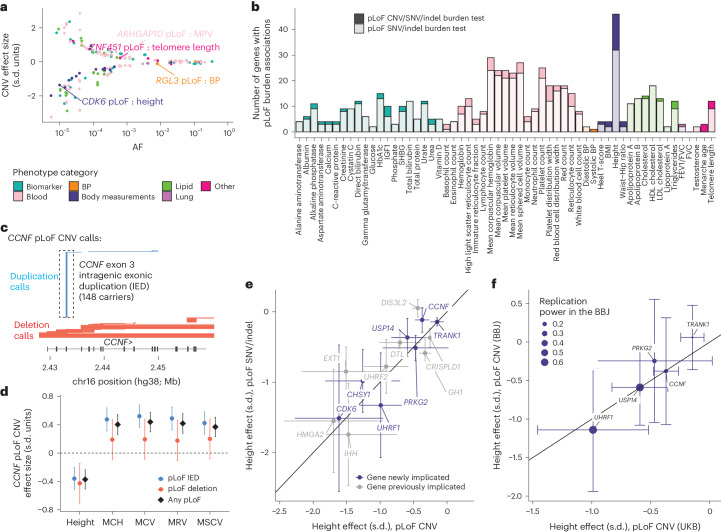
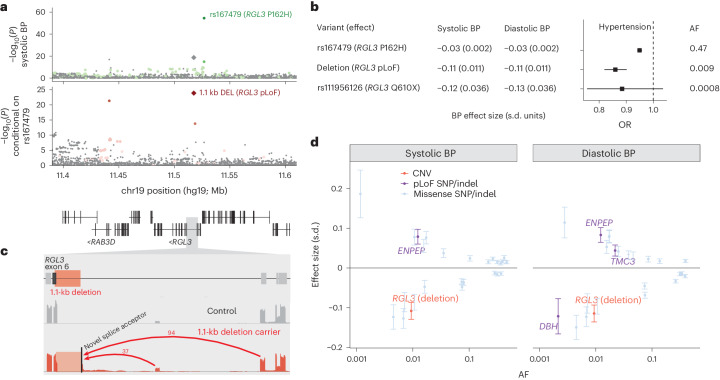
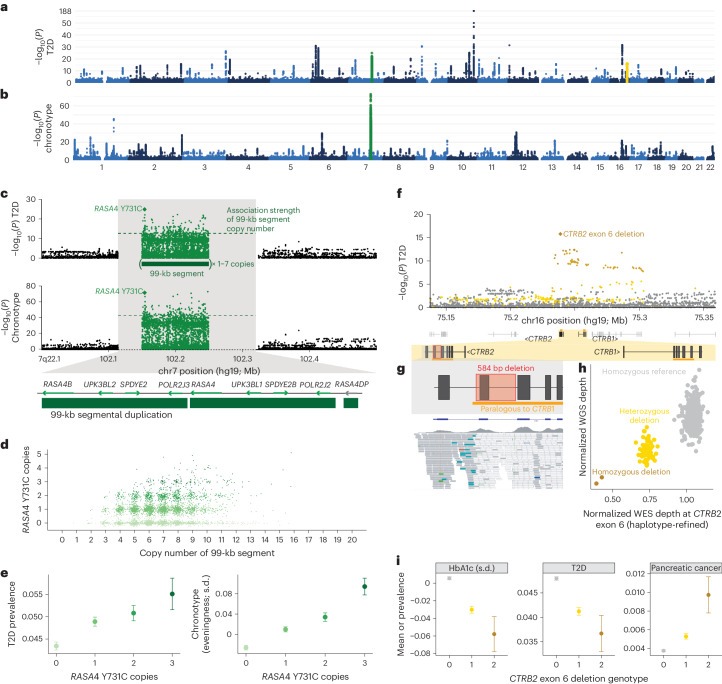
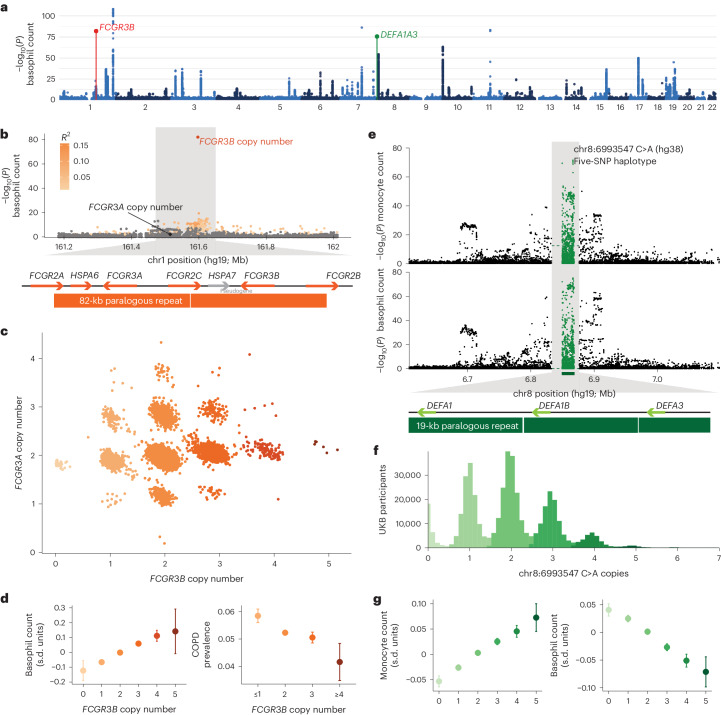
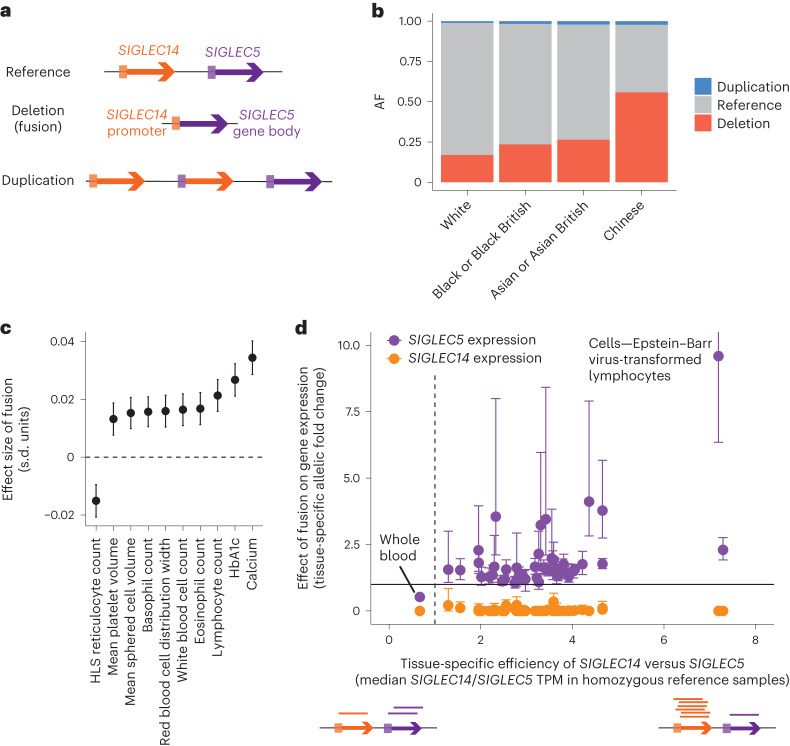
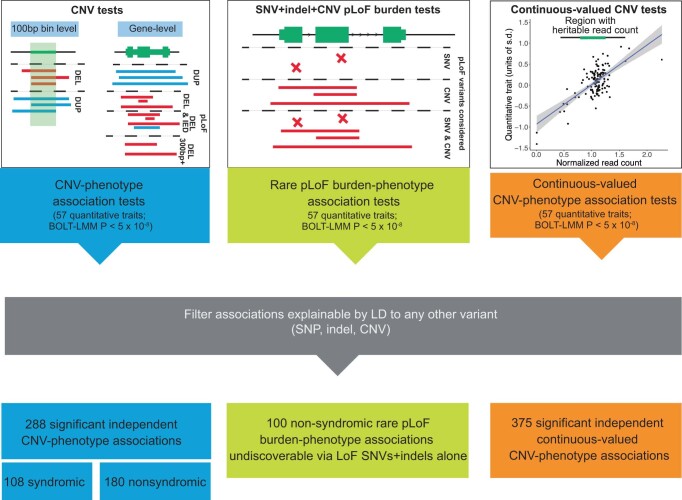
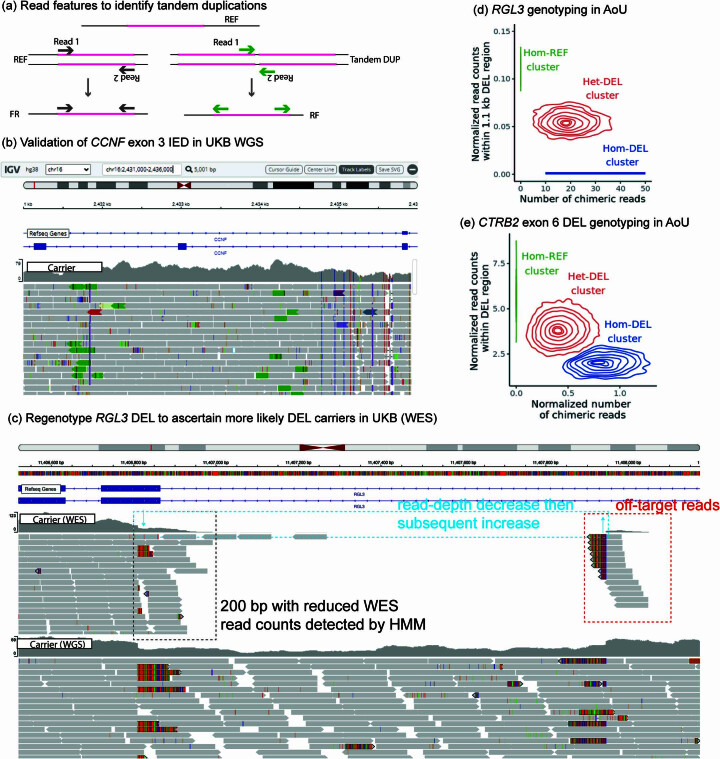
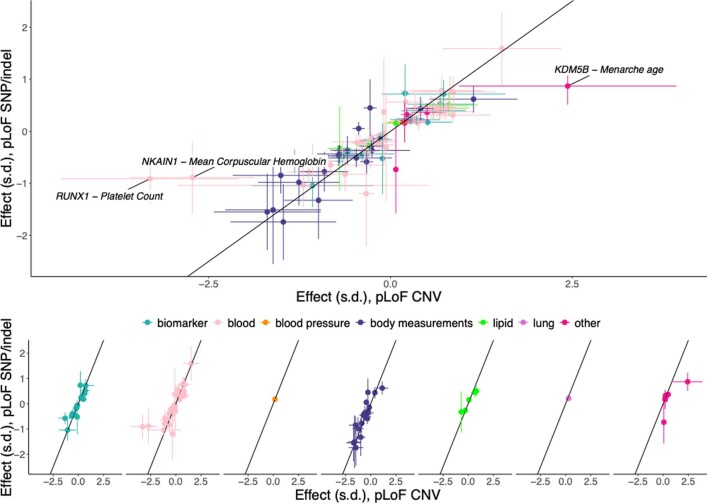
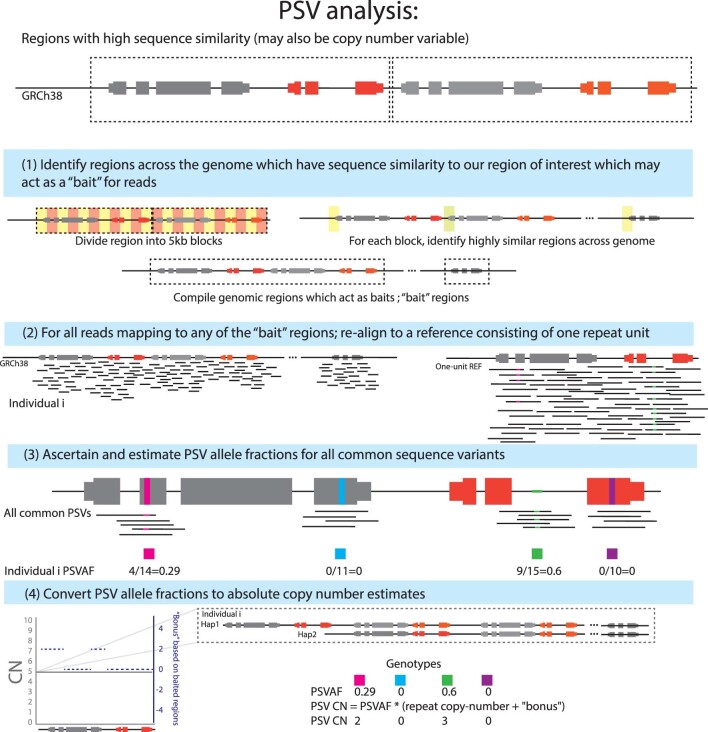
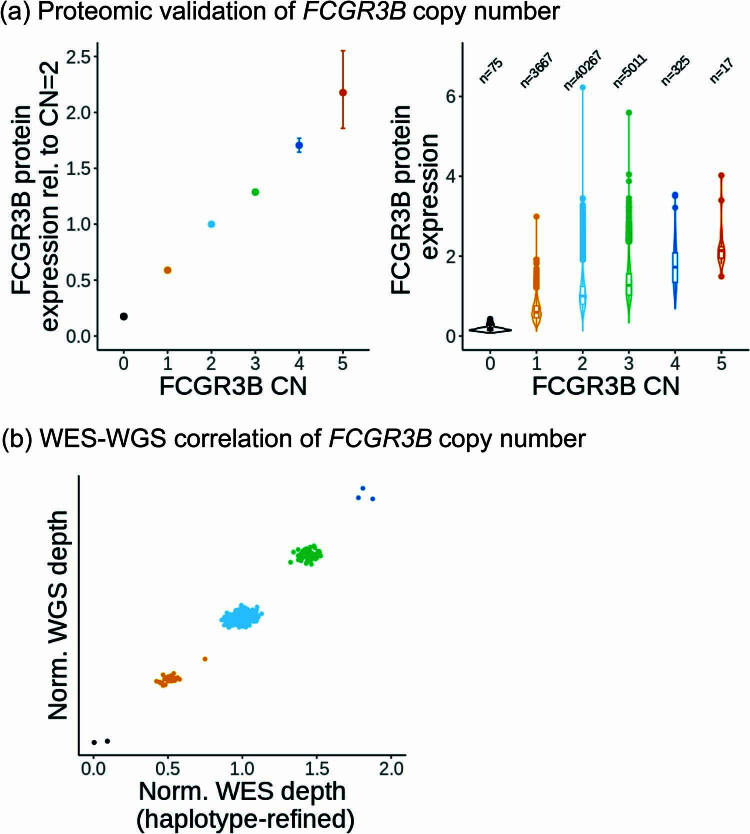
Copy number variants (CNVs) are among the largest genetic variants, yet CNVs have not been effectively ascertained in most genetic association studies. Here we ascertained protein-altering CNVs from UK Biobank whole-exome sequencing data (n = 468,570) using haplotype-informed methods capable of detecting subexonic CNVs and variation within segmental duplications. Incorporating CNVs into analyses of rare variants predicted to cause gene loss of function (LOF) identified 100 associations of predicted LOF variants with 41 quantitative traits. A low-frequency partial deletion of RGL3 exon 6 conferred one of the strongest protective effects of gene LOF on hypertension risk (odds ratio = 0.86 (0.82-0.90)). Protein-coding variation in rapidly evolving gene families within segmental duplications-previously invisible to most analysis methods-generated some of the human genome's largest contributions to variation in type 2 diabetes risk, chronotype and blood cell traits. These results illustrate the potential for new genetic insights from genomic variation that has escaped large-scale analysis to date.


Conflict of interest statement

The authors declare no competing interests.

Figures

Fig. 1
Fig. 1. Haplotype-informed CNV detection from UKB whole-exome sequencing data.
a, This approach improved the power to detect CNVs by analyzing WES read-depth data from an individual together with the corresponding data from individuals sharing extended SNP haplotypes (‘haplotype neighbors’), facilitating analysis at a resolution of 100-bp bins. In contrast, standard approaches analyze data from an individual alone, generally at exon-level resolution. b, Average number of CNVs called per UKB participant, subdivided according to copy number change (deletion or duplication) and call length. c, Validation rate of CNV calls based on the analysis of WGS data for 100 UKB participants. d, Average numbers of CNVs called per UKB participant affecting the given numbers of genes or exons. e, Distributions (across increasingly constrained gene sets) of observed counts of pLOF deletions and whole-gene duplications in 487,205 UKB participants. LOEUF, LOF observed/expected upper bound fraction. Center, median; box edges, 25th and 75th percentiles; whiskers, 5th and 95th percentiles. f, Fractions of UKB participants with the given numbers of genes affected by rare CNVs.
Fig. 2
Fig. 2. Association and fine-mapping analyses implicate rare large-effect CNVs and uncover new gene–trait relationships.
a, Effect size versus minor allele frequency (MAF) for 180 likely causal CNV–phenotype associations, colored according to phenotype category. b, Number of genes with pLOF burden associations (P < 5 × 10−8) per trait, colored according to phenotype category, with darker shading corresponding to associations detectable only when including pLOF CNVs (that is, P > 5 × 10−8 for burden masks considering only SNVs and indels). P values are provided in Supplementary Data 3. c, Genomic locations of CCNF pLOF CNV calls; boxed calls correspond to the rare duplication spanning a single 107-bp exon. d, Effect sizes of CCNF pLOF CNVs for height and erythrocyte traits. MCH, mean corpuscular hemoglobin; MCV, mean corpuscular volume; MRV, mean reticulocyte volume; MSCV, mean sphered cell volume. e, Consistency of height effect sizes of pLOF CNVs with those of pLOF SNVs and indels. f, Replication of height effect sizes of pLOF CNVs in the BBJ (for newly implicated genes with at least five pLOF CNV carriers in the BBJ). The error bars represent the 95% confidence intervals (CIs). Sample sizes for the UKB (df) are reported in Supplementary Data 1; n = 179,420 for the BBJ.
Fig. 3
Fig. 3. A low-frequency deletion in RGL3 is associated with reduced hypertension risk and alters splicing.
a, Associations of variants at the RGL3 locus with systolic BP in two steps of stepwise conditional analysis. The colored dots are variants in partial LD (r2 ≥ 0.01) with labeled variants. b, Effect sizes and AFs of a common RGL3 missense variant (rs167479), the low-frequency 1.1-kb deletion and a rare RGL3 stop gain. c, Evidence of aberrant RGL3 splicing produced by the 1.1-kb deletion. RNA-seq read-depth data from the GTEx are shown for a carrier of the deletion and a control sample (both thyroid); the red arcs indicate new splice junctions, labeled with counts of supporting RNA-seq reads. d, Systolic and diastolic BP effect sizes versus MAFs for nonsynonymous SNP and indel variants and the 1.1-kb deletion. The error bars represent the 95% CIs. Sample sizes for BP are reported in Supplementary Data 1; n = 437,475 for hypertension.
Fig. 4
Fig. 4. Coding variants within segmental duplications underlie top genetic associations with T2D and chronotype.
a,b, Genome-wide associations with T2D (a) and chronotype (b). c, Associations of variation at 7q22.1 with chronotype and T2D. Associations of PSVs within the 99-kb repeat at this locus (1–7 copies per allele; two copies in GRCh37) are plotted in the center; the green dashed line indicates the association strength of copy number of the 99-kb repeat. d, Joint distribution of copy number estimates for the 99-kb segmental duplication and the RASA4 Y731C missense variant. e, T2D prevalence and mean chronotype (in standardized units; higher for ‘evening people’) as a function of the number of copies of the RASA4 Y731C missense variant. f, T2D associations at the CTRB2 locus; the colored dots are variants in partial LD (r2 > 0.01) with the CTRB2 exon 6 deletion. g, Location of the 584-bp deletion spanning CTRB2 exon 6 (top) and exome sequencing read alignments for a deletion carrier (bottom); most reads aligned to the region paralogous to CTRB1 do not map uniquely and are colored white. h, Scatter plot of normalized whole-genome and WES read depths at CTRB2 exon 6. i, Mean HbA1c and prevalence of T2D and pancreatic cancer as a function of CTRB2 exon 6 deletion genotype. The error bars represent the 95% CIs. The sample sizes for HbA1c are reported in Supplementary Data 1; n = 453,585 for T2D; n = 454,633 for pancreatic cancer; n = 406,359 for chronotype.
Fig. 5
Fig. 5. Variation in segmental duplications generates two of the top five genetic associations with basophil counts.
a, Genome-wide associations with basophil counts. b, Associations with basophil counts at the FCGR3B locus; the colored dots are variants in partial LD (r2 > 0.01) with the FCGR3B copy number. c, Joint distribution of copy number estimates for FCGR3A and FCGR3B. d, Mean basophil count and prevalence of chronic obstructive pulmonary disease (COPD) as a function of FCGR3B copy number. e, Associations with basophil counts at the DEFA1A3 locus. PSVs within the 19-kb repeat at this locus are plotted as in Fig. 4c; the green dashed line indicates the association strength of the copy number of the 19-kb repeat. f, Histogram of the number of copies of the 19-kb repeat carrying the five-SNP haplotype represented by chr8:6993547 C>A (GRCh38 coordinates). g, Mean monocyte and basophil count as a function of copy number of the five-SNP haplotype. The error bars represent the 95% CIs. Sample sizes for blood counts are reported in Supplementary Data 1; n = 454,633 for COPD.
Fig. 6
Fig. 6. Common pleiotropic SIGLEC14–SIGLEC5 gene fusion illustrates tissue-specific promoter activity.
a, Gene diagram of SIGLEC14 and SIGLEC5. A common deletion allele fuses the SIGLEC14 promoter to the SIGLEC5 gene body, and the reciprocal duplication allele is also observed at lower frequencies. b, Allele frequency of gene fusion and duplication events in the UKB, stratified according to reported ethnicity. c, Effect size of fusion on blood indices and serum biomarker traits. d, Allelic fold change effect of fusion on SIGLEC5 and SIGLEC14 gene expression across GTEx tissues tracked with relative efficiency the SIGLEC14 versus SIGLEC5 promoter in each tissue. TPM, transcript per million reads. The error bars represent the 95% CIs. Sample sizes for the blood indices and serum biomarker traits are reported in Supplementary Data 1; sample sizes for the allelic fold changes are reported in Supplementary Table 7.
Extended Data Fig. 1
Extended Data Fig. 1. Overview of primary association analyses of 57 heritable quantitative traits.
Categories of variants and CNV measurements tested are depicted, and summary numbers of results from each set of association tests that remained after filtering are provided at the bottom.
Extended Data Fig. 2
Extended Data Fig. 2. Additional CNV genotyping at key loci.
a, Schematic of discordant WGS reads that confirm tandem duplications and indicate breakpoint locations. b, We genotyped the CCNF exon 3 IED using discordant WGS reads (shown for a carrier in UKB) to assess precision and recall of WES-based calls from our HMM. c, IGV tracks of WES and WGS alignments for an RGL3 deletion carrier. Top, WES features used in optimized breakpoint-based genotyping; bottom, independent confirmation of deletion from WGS. d,e, In All of Us (AoU), chimeric WGS reads and within-deletion read counts allowed the RGL3 and CTRB2 deletions to be cleanly genotyped. (The homozygous deletion cluster for RGL3 contained <20 carriers, so to comply with AoU policy, the Hom-DEL line depicted is predicted from the heterozygous cluster).
Extended Data Fig. 3
Extended Data Fig. 3. Consistency of effect sizes of pLoF CNV and SNP/indel variants across gene-trait associations.
Data are shown for all associations discovered only upon considering pLoF CNVs (i.e, not reaching significance in SNP/indel-only burden tests). The top plot is a merge across all traits, and the bottom plots show each phenotype category separately. Error bars are 95% confidence intervals. Sample sizes are reported in Supplementary Data 1.
Extended Data Fig. 4
Extended Data Fig. 4. Overview of copy-number estimation for paralogous sequence variants (PSVs).
This figure provides a graphical overview of the pipeline we used to estimate copy-numbers of PSVs—that is, SNPs and indels carried on one or more copies of a multi-copy segment—from WGS read alignments (Supplementary Note, Section 9). We then refined these estimates using haplotype-sharing information.
Extended Data Fig. 5
Extended Data Fig. 5. Validation of FCGR3B copy number estimation.
a, Left, normalized protein expression of FCGR3B for each FCGR3B copy-number state relative to CN = 2. Estimates and 95% confidence intervals were obtained from linear regression analyses of NPX values and then converted to the linear scale (2NPX). Right, distribution of normalized protein expression of FCGR3B converted to the linear scale (2NPX) for each FCGR3B copy-number state. Counts of individuals with each copy-number state are shown above the corresponding violin. Boxplots display median value (center line), hinges denote first and third quartile (25th and 75th percentile), and whiskers extend from upper (resp. lower) hinge to the largest (resp. smallest) value at most 1.5 times the interquartile range away from the hinge; all other points are considered outliers and plotted individually. b, Scatter plot of normalized WGS and WES read depths at FCGR3B for 500 UKB participants. Points are colored based on the estimated FCGR3B copy number derived from WES.

Update of

References

    1. Sudmant PH, et al. An integrated map of structural variation in 2,504 human genomes. Nature. 2015;526:75–81. doi: 10.1038/nature15394. - DOI - PMC - PubMed
    1. Abel HJ, et al. Mapping and characterization of structural variation in 17,795 human genomes. Nature. 2020;583:83–89. doi: 10.1038/s41586-020-2371-0. - DOI - PMC - PubMed
    1. Collins RL, et al. A structural variation reference for medical and population genetics. Nature. 2020;581:444–451. doi: 10.1038/s41586-020-2287-8. - DOI - PMC - PubMed
    1. Ebert P, et al. Haplotype-resolved diverse human genomes and integrated analysis of structural variation. Science. 2021;372:eabf7117. doi: 10.1126/science.abf7117. - DOI - PMC - PubMed
    1. Liao W-W, et al. A draft human pangenome reference. Nature. 2023;617:312–324. doi: 10.1038/s41586-023-05896-x. - DOI - PMC - PubMed