Interlaboratory Comparison of Antibody-Free LC-MS/MS Measurements of C-peptide and Insulin
- PMID: 38549041
- PMCID: PMC12052497
- DOI: 10.1093/clinchem/hvae034
Interlaboratory Comparison of Antibody-Free LC-MS/MS Measurements of C-peptide and Insulin
Abstract
Background: The enhanced precision and selectivity of liquid chromatography-tandem mass spectrometry (LC-MS/MS) makes it an attractive alternative to certain clinical immunoassays. Easily transferrable work flows could help facilitate harmonization and ensure high-quality patient care. We aimed to evaluate the interlaboratory comparability of antibody-free multiplexed insulin and C-peptide LC-MS/MS measurements.
Methods: The laboratories that comprise the Targeted Mass Spectrometry Assays for Diabetes and Obesity Research (TaMADOR) consortium verified the performance of a validated peptide-based assay (reproducibility, linearity, and lower limit of the measuring interval [LLMI]). An interlaboratory comparison study was then performed using shared calibrators, de-identified leftover laboratory samples, and reference materials.
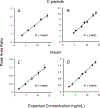
Results: During verification, the measurements were precise (2.7% to 3.7%CV), linear (4 to 15 ng/mL for C-peptide and 2 to 14 ng/mL for insulin), and sensitive (LLMI of 0.04 to 0.10 ng/mL for C-peptide and 0.03 ng/mL for insulin). Median imprecision across the 3 laboratories was 13.4% (inter-quartile range [IQR] 11.6%) for C-peptide and 22.2% (IQR 20.9%) for insulin using individual measurements, and 10.8% (IQR 8.7%) and 15.3% (IQR 14.9%) for C-peptide and insulin, respectively, when replicate measurements were averaged. Method comparison with the University of Missouri reference method for C-peptide demonstrated a robust linear correlation with a slope of 1.044 and r2 = 0.99.
Conclusions: Our results suggest that combined LC-MS/MS measurements of C-peptide and insulin are robust and adaptable and that standardization with a reference measurement procedure could allow accurate and precise measurements across sites, which could be important to diabetes research and help patient care in the future.
Published by Oxford University Press on behalf of Association for Diagnostics & Laboratory Medicine 2024.
Figures


References
-
- Wallace TM, Matthews DR. Assessment of the effects of insulin secretagogues in humans. Diabetes Obes Metab 2000;2:271–83. - PubMed
-
- Marques Ruy G.; Fontaine Magali J.; Rogers Jeffrey. C-Peptide Much More Than a Byproduct of Insulin Biosynthesis. Available from: https://journals.lww.com/pancreasjournal/Abstract/2004/10000/C_Peptide__... - PubMed
-
- Bonser AM, Garcia-Webb P. C-peptide measurement and its clinical usefulness: a review. Ann Clin Biochem 1981;18:200–6. - PubMed
Publication types
MeSH terms
Substances
Grants and funding
LinkOut - more resources
Full Text Sources
Medical

