. 2024 Jan 4;8(1):ziad009.
doi: 10.1093/jbmrpl/ziad009. eCollection 2024 Jan.

Osteoclast-specific Plastin 3 knockout in mice fail to develop osteoporosis despite dramatic increased osteoclast resorption activity

Affiliations

Osteoclast-specific Plastin 3 knockout in mice fail to develop osteoporosis despite dramatic increased osteoclast resorption activity

Ilka Maus et al. JBMR Plus. .

Abstract

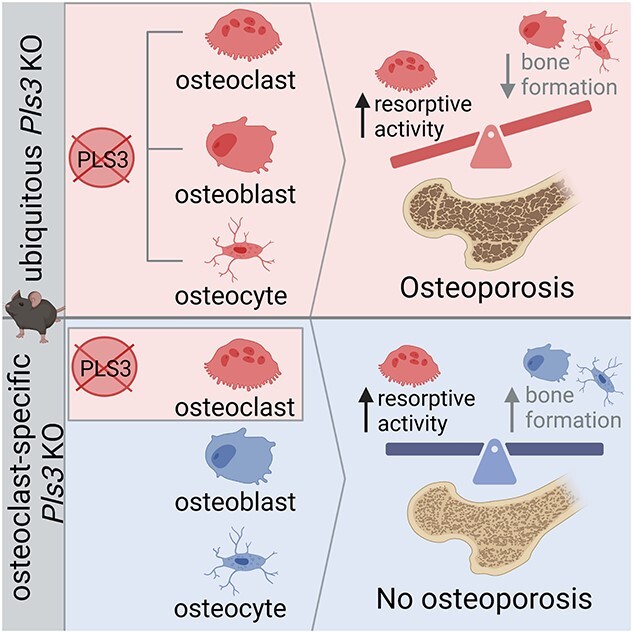
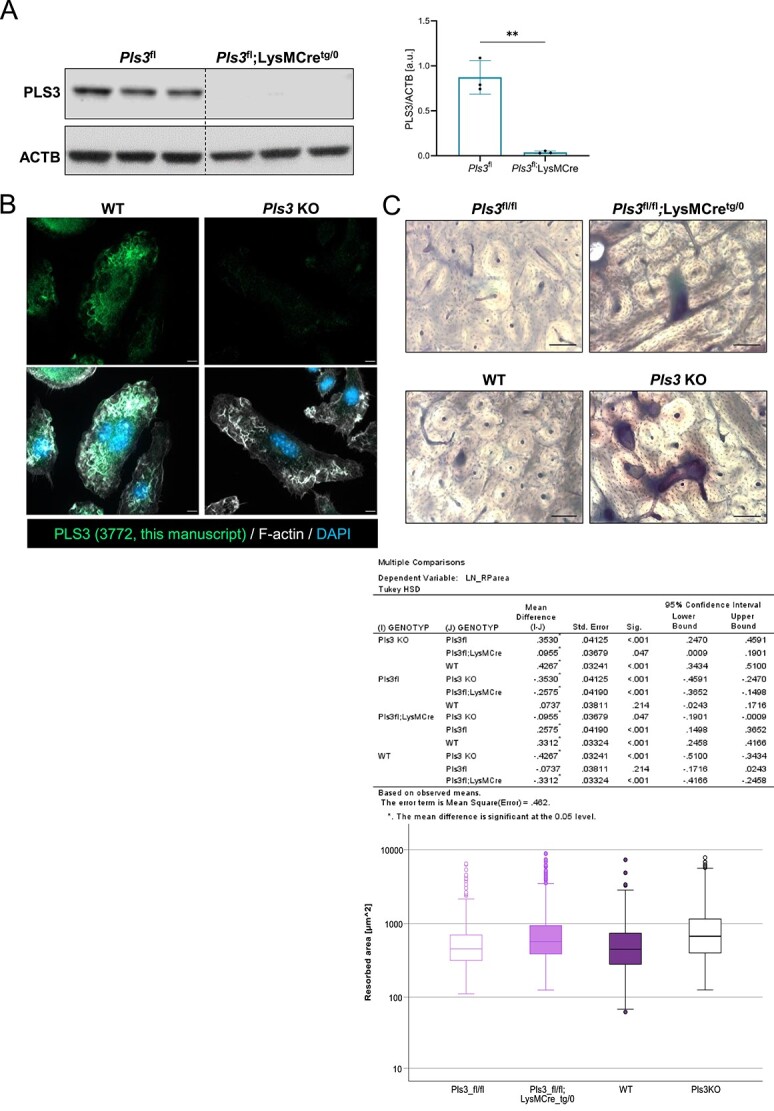
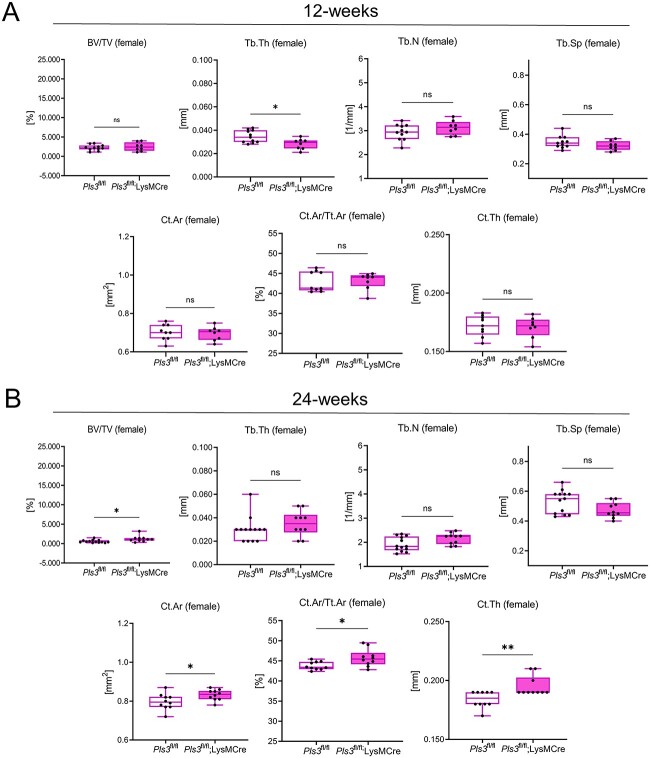
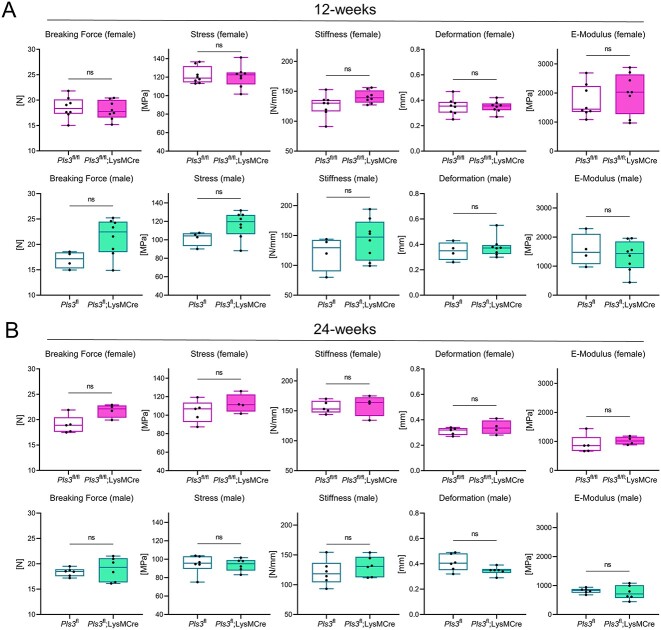
PLS3 loss-of-function mutations in humans and mice cause X-linked primary osteoporosis. However, it remains largely unknown how PLS3 mutations cause osteoporosis and which function PLS3 plays in bone homeostasis. A recent study showed that ubiquitous Pls3 KO in mice results in osteoporosis. Mainly osteoclasts were impacted in their function However, it has not been proven if osteoclasts are the major cell type affected and responsible for osteoporosis development in ubiquitous Pls3 KO mice. Here, we generated osteoclast-specific Pls3 KO mice. Additionally, we developed a novel polyclonal PLS3 antibody that showed specific PLS3 loss in immunofluorescence staining of osteoclasts in contrast to previously available antibodies against PLS3, which failed to show PLS3 specificity in mouse cells. Moreover, we demonstrate that osteoclast-specific Pls3 KO causes dramatic increase in resorptive activity of osteoclasts in vitro. Despite these findings, osteoclast-specific Pls3 KO in vivo failed to cause any osteoporotic phenotype in mice as proven by micro-CT and three-point bending test. This demonstrates that the pathomechanism of PLS3-associated osteoporosis is highly complex and cannot be reproduced in a system singularly focused on one cell type. Thus, the loss of PLS3 in alternative bone cell types might contributes to the osteoporosis phenotype in ubiquitous Pls3 KO mice.

Keywords: Plastin 3; bone resorption; genetic animal model; osteoclasts; osteoporosis.


Conflict of interest statement

There are no related or potential conflicts of interest.

Figures

Graphical Abstract
Graphical Abstract
Figure 1
Figure 1
Characterization of Pls3fl/fl;LysMCretg/0 osteoclasts and validation of the specificity of a newly developed polyclonal PLS3 antibody. (A) Protein levels of PLS3 and the housekeeper ACTB in male Pls3fl and Pls3fl;LysMCretg/0 osteoclasts. Quantification of PLS3 protein levels relative to ACTB confirmed the osteoclast-specific Pls3 deletion in the osteoclasts of these mice. N = 3. Results are shown as mean ± SD. Statistical test: Unpaired two-tailed Student’s t-test **p < 0.01 (B) immunofluorescence staining of differentiated WT control and Pls3 KO osteoclasts with a newly developed PLS3 antibody (this manuscript, 3772) confirmed antibody specificity. PLS3 staining resulted in filamentous structures in WT control osteoclasts, whereas no signal was detected in Pls3 KO osteoclasts. The actin cytoskeleton was stained with F-actin and nuclei were stained with DAPI. (C) Resorption pit assay of primary spleen-derived osteoclasts from 1-mo-old mice cultivated on bovine bone slices for 7 d and stained with toluidine blue. Resorbed areas of Pls3fl/fl, Pls3fl/fl;LysMCretg/0, WT and, Pls3 KO were compared to each other. Scale bar: 10 μm. N = 3-7 animals per genotype, n > 90 resorption pits per animal. Results of multiple comparison analyses are shown in the table below and in the graphical representation beneath. Statistical test: Log resorbed area was evaluated by two-way ANOVA with factors genotype and animal nested within genotype. To guard against type-I-error inflation in pairwise comparisons, Tukey‘s HSD method was applied. Notable, the corresponding inference space is narrow, i.e. inferences pertain to the specific sample of animals.
Figure 2
Figure 2
Selected microCT data of the femora from 12- and 24-wk-old female Pls3fl/fl;LysMCretg/0 mice in comparison to their Pls3fl/fl littermates. Shown are bone volume fraction (BV/TV, %), trabecular thickness (Tb.Th, mm), trabecular number (Tb.N, 1/mm), trabecular separation (Tb.Sp, mm), cortical area (Ct.Ar, mm2), ratio of cortical area to tissue area (Ct.Ar/Tt.Ar, %), and cortical thickness (Ct.Th, mm) for (A) 12-wk-old female mice and (B) for 24-wk-old female mice. N = 8 of 12-wk-old female Pls3fl/fl;LysMCretg/0 mice, N = 11 of 12-wk-old female Pls3fl/fl mice; N = 10 of 24-wk-old female Pls3fl/fl;LysMCretg/0 mice; N = 13 of 24-wk-old female Pls3fl/fl mice. All results are shown as box plots, representing individual data points with median as a line, interquartile range (25th–75th percentile), and min to max as whiskers. *P < .05, **P < .01, ***P < .001, ns = not significant. Statistical test: Mann–Whitney U test.
Figure 3
Figure 3
3-PBT of 12- and 24-wk-old female and male Pls3fl/fl;LysMCretg/0 mice in comparison to their Pls3fl/fl littermates. (A) 12-wk-old and (B) 24-wk-old. Shown are breaking force (N), ultimate stress (MPa), stiffness (N/mm), deformation (mm), and elastic modulus (E-modulus, MPa). N = 8 of 12-wk-old female Pls3fl/fl;LysMCretg/0 mice; N = 8 of 12-wk-old female Pls3fl/fl mice; N = 8 of 12-wk-old male Pls3fl;LysMCretg/0 mice; N = 4 of 12-wk-old male Pls3fl mice; N = 4 of 24-wk-old female Pls3fl/fl;LysMCretg/0 mice; N = 5 of 24-wk-old female Pls3fl/fl mice; N = 6 of 24-wk-old male Pls3fl;LysMCretg/0 mice; N = 6 of 24-wk-old male Pls3fl mice. All results are shown as box plots, representing individual data points with median as a line, interquartile range (25th to 75th percentile), and min to max as whiskers. *P < .05, **P < .01, ***P < .001, ns = not significant. Statistical test: Mann–Whitney U test.

Similar articles

Cited by

  • Functional Insights in PLS3-Mediated Osteogenic Regulation.
    Zhong W, Neugebauer J, Pathak JL, Li X, Pals G, Zillikens MC, Eekhoff EMW, Bravenboer N, Zhang Q, Hammerschmidt M, Wirth B, Micha D. Zhong W, et al. Cells. 2024 Sep 9;13(17):1507. doi: 10.3390/cells13171507. Cells. 2024. PMID: 39273077 Free PMC article.

References

    1. Sozen T, Ozisik L, Basaran NC. An overview and management of osteoporosis. Eur J Rheumatol. 2017;4(1):46–56. Epub 20161230. 10.5152/eurjrheum.2016.048. - DOI - PMC - PubMed
    1. de Villiers TJ, Goldstein SR. Bone health 2022: an update. Climacteric. 2022;25(1):1–3. 10.1080/13697137.2021.1965408. - DOI - PubMed
    1. Kaushal N, Vohora D, Jalali RK, Jha S. Prevalence of osteoporosis and osteopenia in an apparently healthy Indian population – a cross-sectional retrospective study. Osteoporos Sarcopenia. 2018;4(2):53–60. 10.1016/j.afos.2018.04.002. - DOI - PMC - PubMed
    1. Clynes MA, Harvey NC, Curtis EM, Fuggle NR, Dennison EM, Cooper C. The epidemiology of osteoporosis. Brit Med Bull. 2020;133(1):105–117. 10.1093/bmb/ldaa005. - DOI - PMC - PubMed
    1. Alswat KA. Gender disparities in osteoporosis. J Clin Med Res. 2017;9(5):382–387. 10.14740/jocmr2970w. - DOI - PMC - PubMed