. 2024 Mar 14:15:1342647.
doi: 10.3389/fimmu.2024.1342647. eCollection 2024.

STING agonist inflames the cervical cancer immune microenvironment and overcomes anti-PD-1 therapy resistance

Affiliations

STING agonist inflames the cervical cancer immune microenvironment and overcomes anti-PD-1 therapy resistance

Tianye Li et al. Front Immunol. .

Abstract

Background: Cervical cancer poses a significant global threat to women's health. However, current therapeutic interventions, such as radiotherapy, chemotherapy, surgical resection, and immune checkpoint inhibitors, face limitations in the advanced stages of the disease. Given the immunosuppressive microenvironment in cervical cancer, it is imperative to explore novel perspectives. In this regard, STING agonists have emerged as promising candidates.

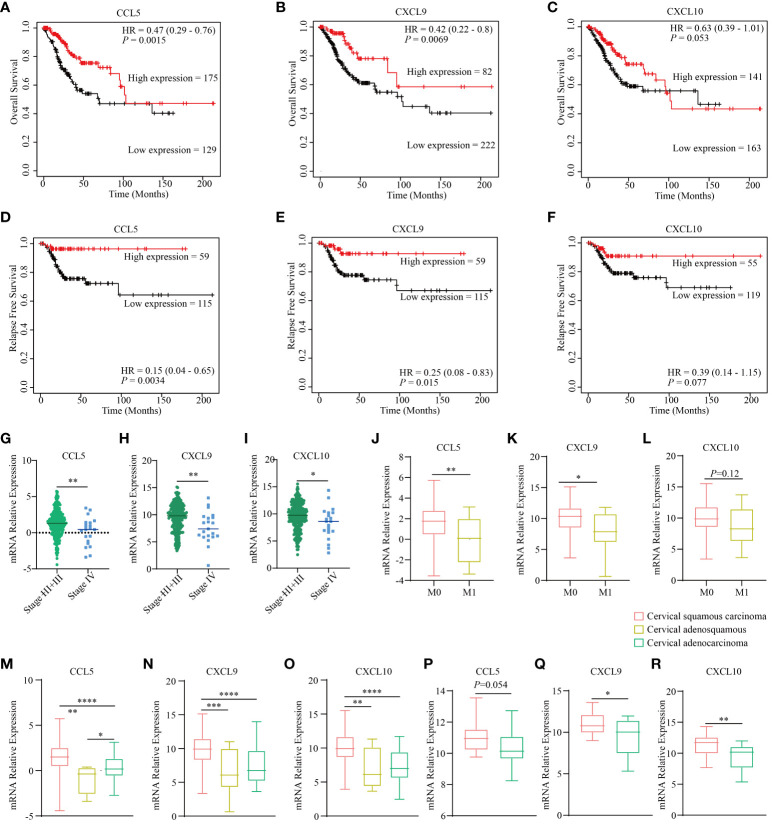
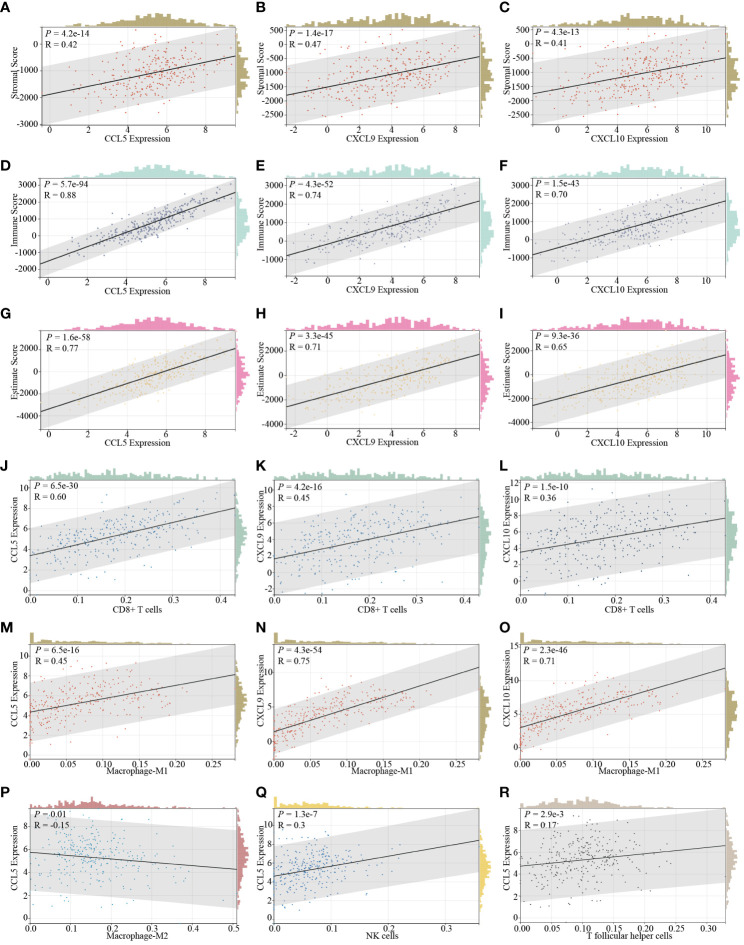
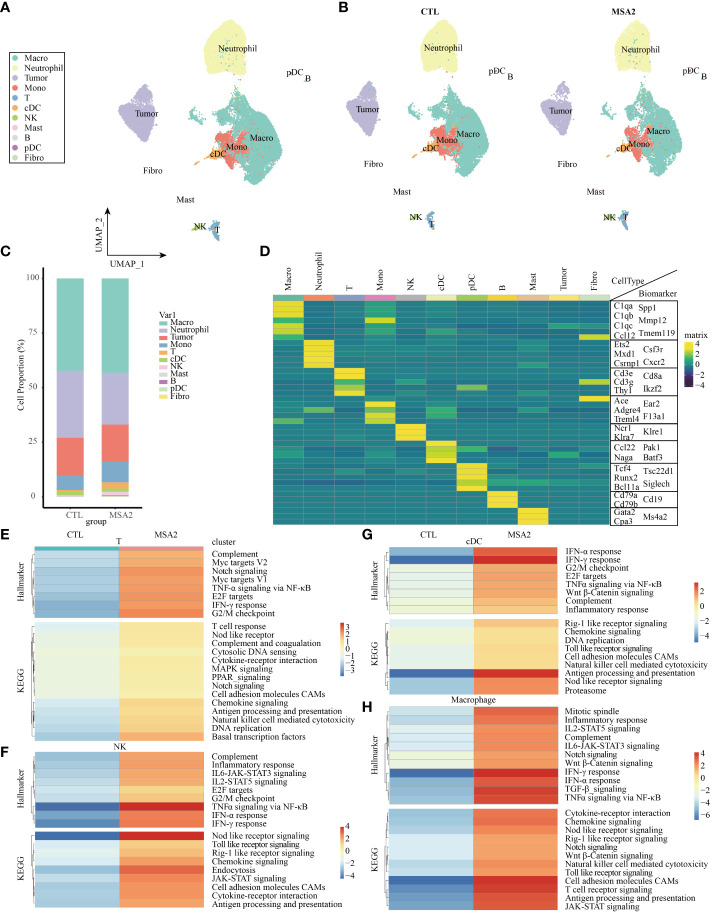
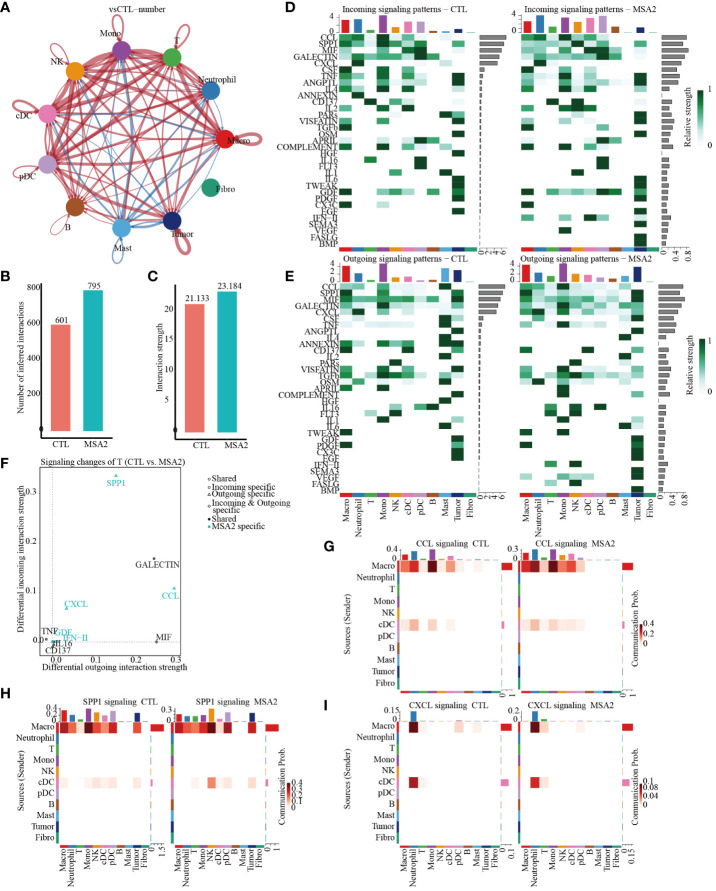
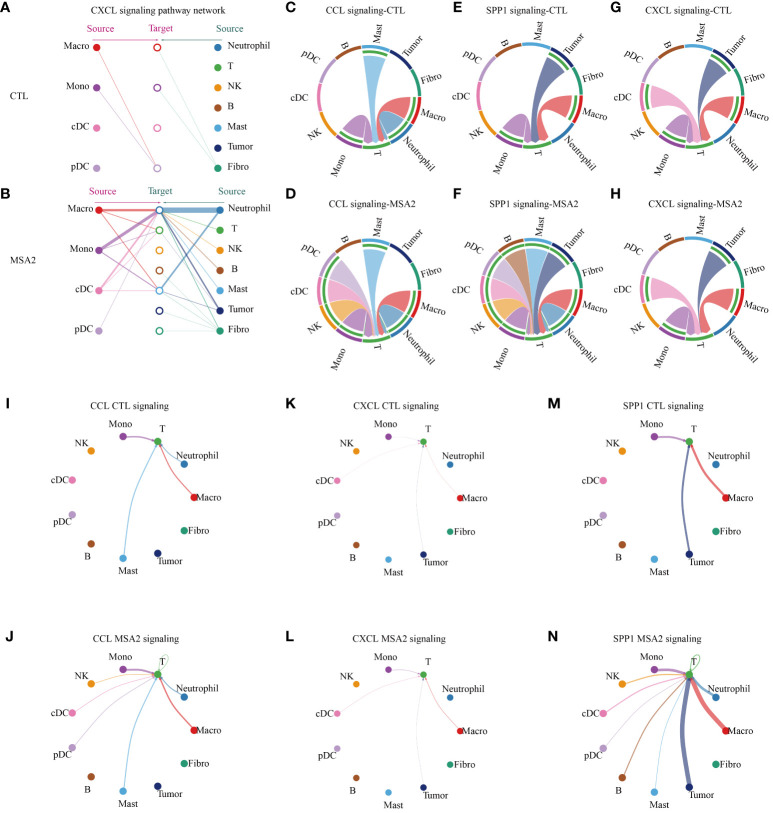
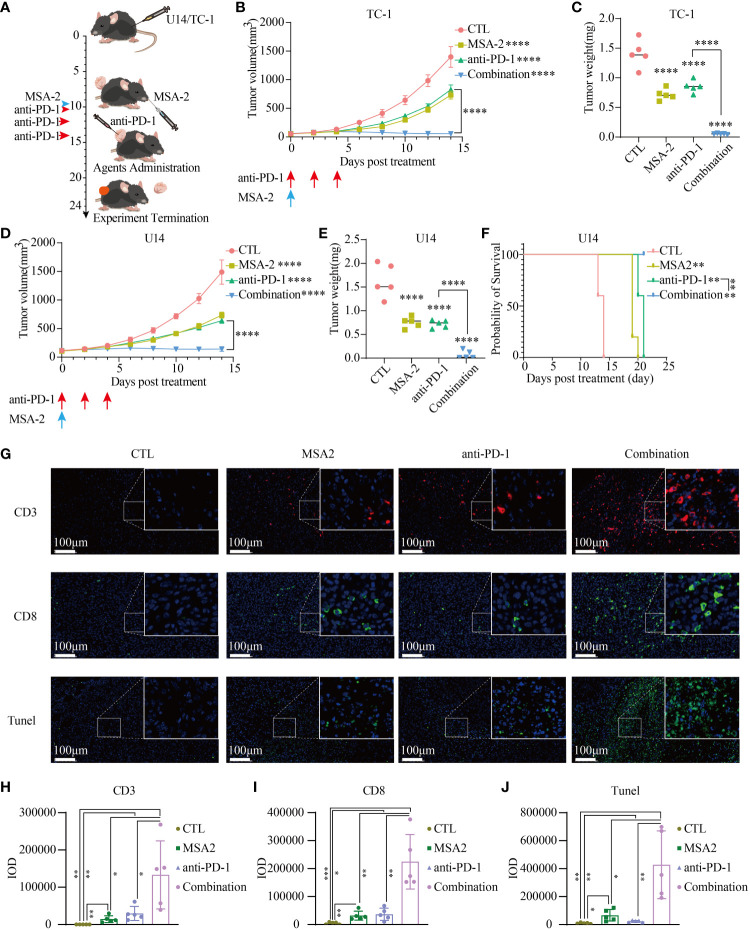
Methods: The expression profiles and clinicopathological data were obtained from The Cancer Genome Atlas (TCGA) and Gene Expression Omnibus (GEO) datasets. Prognostic analysis of STING downstream genes (CCL5, CXCL9, CXCL10) and immune infiltration analysis were conducted using Kaplan-Meier Plotter, ESTIMATE, and deconvo_CIBERSOR. Single-cell RNA-seq (scRNA-seq) analysis was conducted to evaluate the potential of MSA-2 in cervical cancer treatment employing SingleR, chi-squared test, and Gene Set Enrichment Analysis (GSEA). Cellular interaction analysis utilized the CellChat package to assess the potentiation of cellular interaction following MSA-2 administration. Murine tumor models involving U14 and TC-1, were conducted, and the IF of tissue was subsequently conducted to assess the tumor microenvironment status after treatment.

Results: Prognosis in cervical cancer correlated with elevated expression of STING downstream genes, indicating prolonged survival and reduced recurrence. These genes positively correlated with immune infiltration, influencing stromal scores, immune scores, and estimate scores. Specific immune cell populations, including CD8+ T cells, M1-type macrophages, NK cells, and T follicular helper cells, were associated with STING downstream genes. scRNA-seq in a classic immune-excluded model revealed that MSA-2 exerts priming and activating functions on vital components within TME, and intensifies their intercellular communications. The in vivo assay ultimately demonstrated that MSA-2, either as a standalone treatment or in combination with anti-PD-1, effectively suppressed the growth of subcutaneous cervical tumors. Moreover, the combination strategy significantly augmented efficacy compared to anti-PD-1 monotherapy by eliciting a robust antitumor immune response.

Conclusion: This study highlights the pivotal role of the STING pathway and the potential of MSA-2 in reshaping the immune microenvironment in cervical cancer. Combining MSA-2 with immune checkpoint inhibitors presents a transformative approach, holding promise for improved prognosis. Further investigations are warranted to explore the broader immune landscape and potential long-term effects of MSA-2 in cervical cancer treatment.

Keywords: STING agonist; anti-PD-1 treatment; cervical cancer; single-cell RNA-seq; tumor microenvironment.


Conflict of interest statement

The authors declare that the research was conducted in the absence of any commercial or financial relationships that could be construed as a potential conflict of interest.

Figures

Figure 1
Figure 1
STING downstream genes are correlated with the clinical outcomes and traits of cervical cancer. The curves illustrate the overall survival of cervical cancer patients stratified based on the expression status of three downstream genes of STING, namely CCL5 (A), CXCL9 (B), and CXCL10 (C) based on the TCGA dataset. The curves present the relapse free survival of patients with cervical cancer grouped by the expression level of three downstream genes of STING, namely CCL5 (D), CXCL9 (E), and CXCL10 (F) according to TCGA dataset. The diagram depicts the clinical stages of different expression levels of CCL5 (G), CXCL9 (H), and CXCL10 (I) based on TCGA dataset. The diagram depicts the clinical metastatic status of different expression levels of CCL5 (J), CXCL9 (K), and CXCL10 (L) based on TCGA dataset. The expression level of CCL5 (M), CXCL9 (N), and CXCL10 (O) in different histological types based on TCGA dataset. The expression level of CCL5 (P), CXCL9 (Q), and CXCL10 (R) in different histological types according to the GSE192897 dataset. * in this figure represents P < 0.05, ** represents P < 0.01, *** indicates P < 0.001, and **** represents P < 0.0001.
Figure 2
Figure 2
The correlation of STING downstream genes and immune infiltration characteristics in cervical cancer. The expression of CCL5 (A), CXCL9 (B), and CXCL10 (C) is positively relative to the stromal score determined by the ESTIMATE SCORING assessing system. The expression of CCL5 (D), CXCL9 (E), and CXCL10 (F) positively correlated with the immune score determined by the ESTIMATE SCORING assessing system. The expression of CCL5 (G), CXCL9 (H), and CXCL10 (I) exhibits a positive correlation with the estimate score determined by the ESTIMATE SCORING assessing system. The expression of CCL5 (J), CXCL9 (K), and CXCL10 (L) is positively correlated with the infiltration of CD8+ T cells. The expression of CCL5 (M), CXCL9 (N), and CXCL10 (O) is positively correlative with the infiltration of M1 type macrophages. The expression of CCL5 is additionally negatively correlated with the infiltration of M2 type macrophages (P) and positively correlated with the infiltration of NK cells (Q), and T follicular helper cells (R).
Figure 3
Figure 3
The scRNA-seq analyses demonstrated the comprehensive immune landscape variations of TME after MSA-2 administration. (A) The cell clustering distribution of TME through secondary scRNA-seq analysis. (B) The alternations of cell distributions in TME of a breast cold tumor model between the control group (CTL) and MSA-2 treatment group. (C) The detailed cell proportions between CTL and MSA-2 treatment group. (D) The specific biomarkers of each component within TME. The signaling variations of T cells (E), NK cells (F), cDCs (G), and macrophages (H).
Figure 4
Figure 4
The cellular interactions between components in TME through secondary analyses of scRNA-seq following MSA-2 utilized. (A) The size of the circles corresponds to the population size of the cell groups, while the thickness of the edges signifies the intensity of interaction between these populations. The red-colored loops were strengthened in the MSA-2 group, and the blue-colored loops were strengthened in the CTL group. (B) The bar plot demonstrates the disparity in quantification of cellular interactions between the CTL and MSA-2 groups. (C) Bar plot depicts the discrepancies in the strength of interaction among TME components. (D) Heatmaps indicate the strength of incoming signaling patterns of components of the TME. (E) Heatmaps indicate the strength of outcoming signaling patterns of components of the TME. (F) Volcano plot depicts the most significant signaling in the context of both incoming and outcoming signaling. Heatmaps illustrate the disparities in communication probability among TME cells between the CTL group and MSA2 group in relation to CCL signaling (G), SPP1 signaling (H), and CXCL signaling (I).
Figure 5
Figure 5
The cellular interactions between components in TME. In the CXCL signaling pattern, the interaction between antigen presenting cells (macrophage, monocytes, cDC and pDC) and other components in TME of CTL group (A) or MSA2 group (B). (C–H) The plots illuminate, in each intriguing signaling pattern, the intercellular interactions circled T cells. (I–N) The plots indicate, in the realms of each interesting signaling, the interaction strength of each cellular communication centered on T cells. The thickness of each line infers the interaction strength.
Figure 6
Figure 6
MSA-2 synergized anti-PD-1 in antitumor immunity. (A) The schematic diagram of in vivo murine experiment of a combination of MSA-2 and anti-PD-1 treatment. The first day began with the subcutaneous tumor cells’ transplantation by the groin of the mouse. The tumor volume was measured and the living condition was assessed every two days until the tenth day as time elapsed. On the tenth day, MSA-2 was administered orally, while anti-PD-1 was intravenously injected. In the combination group and anti-PD-1 group, anti-PD-1 was subsequently injected twice additionally. The tumor volume and living conditions were continuously undertaken every two days. By the termination of the experiment, the subcutaneous tumor was harvested and underwent further processing. The curves represent the variation tendency of subcutaneous tumor of TC-1 (B) and U14 (D) respectively using the algorithm of “major axis × minor axis × minor axis × 0.5”. At the termination of the experiment, the mice were euthanatized and the tumors were cut off and weighed. The weight of the tumor from each group was recorded and exhibited in the plot (C representing the TC-1 group and E representing the U14 group). (F) The overall survival curve of U14 C54BL/6 model. (G) IF of the tissue from the U14 group showed the CD3+, CD8+ and Tunel staining of each group. (H–J) IOD of each IF staining was evaluated. * in this figure indicates P < 0.05, ** indicates P < 0.01, *** indicates P < 0.001, and **** represents P < 0.0001.

References

    1. Bhatla N, Aoki D, Sharma DN, Sankaranarayanan R. Cancer of the cervix uteri: 2021 update. Int J Gynaecol Obstet. (2021) 155 Suppl;1:28–44. doi: 10.1002/ijgo.13865 - DOI - PMC - PubMed
    1. Sung H, Ferlay J, Siegel RL, Laversanne M, Soerjomataram I, Jemal A, et al. . Global cancer statistics 2020: GLOBOCAN estimates of incidence and mortality worldwide for 36 cancers in 185 countries. CA Cancer J Clin. (2021) 71:209–49. doi: 10.3322/caac.21660 - DOI - PubMed
    1. Yuan Y, Cai X, Shen F, Ma F. HPV post-infection microenvironment and cervical cancer. Cancer Lett. (2021) 497:243–54. doi: 10.1016/j.canlet.2020.10.034 - DOI - PubMed
    1. Liontos M, Kyriazoglou A, Dimitriadis I, Dimopoulos MA, Bamias A. Systemic therapy in cervical cancer: 30 years in review. Crit Rev Oncol Hematol. (2019) 137:9–17. doi: 10.1016/j.critrevonc.2019.02.009 - DOI - PubMed
    1. Mayadev JS, Ke G, Mahantshetty U, Pereira MD, Tarnawski R, Toita T. Global challenges of radiotherapy for the treatment of locally advanced cervical cancer. Int J Gynecol Cancer. (2022) 32:436–45. doi: 10.1136/ijgc-2021-003001 - DOI - PMC - PubMed

Publication types

Substances