. 2024 Mar 14:15:1379220.
doi: 10.3389/fimmu.2024.1379220. eCollection 2024.

Mevalonate kinase-deficient THP-1 cells show a disease-characteristic pro-inflammatory phenotype

Affiliations

Mevalonate kinase-deficient THP-1 cells show a disease-characteristic pro-inflammatory phenotype

Frouwkje A Politiek et al. Front Immunol. .

Abstract

Objective: Bi-allelic pathogenic variants in the MVK gene, which encodes mevalonate kinase (MK), an essential enzyme in isoprenoid biosynthesis, cause the autoinflammatory metabolic disorder mevalonate kinase deficiency (MKD). We generated and characterized MK-deficient monocytic THP-1 cells to identify molecular and cellular mechanisms that contribute to the pro-inflammatory phenotype of MKD.

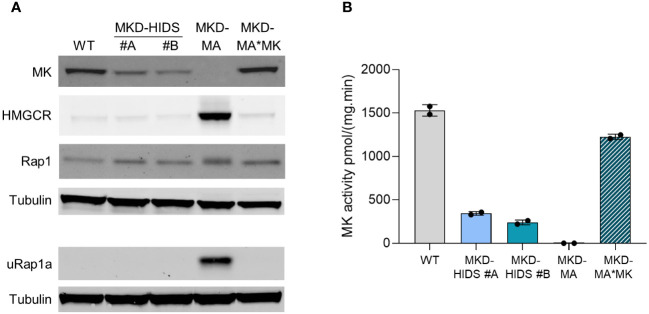
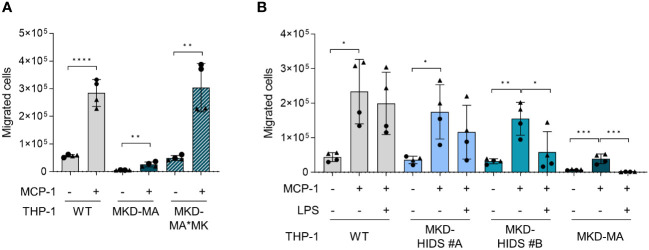
Methods: Using CRISPR/Cas9 genome editing, we generated THP-1 cells with different MK deficiencies mimicking the severe (MKD-MA) and mild end (MKD-HIDS) of the MKD disease spectrum. Following confirmation of previously established disease-specific biochemical hallmarks, we studied the consequences of the different MK deficiencies on LPS-stimulated cytokine release, glycolysis versus oxidative phosphorylation rates, cellular chemotaxis and protein kinase activity.

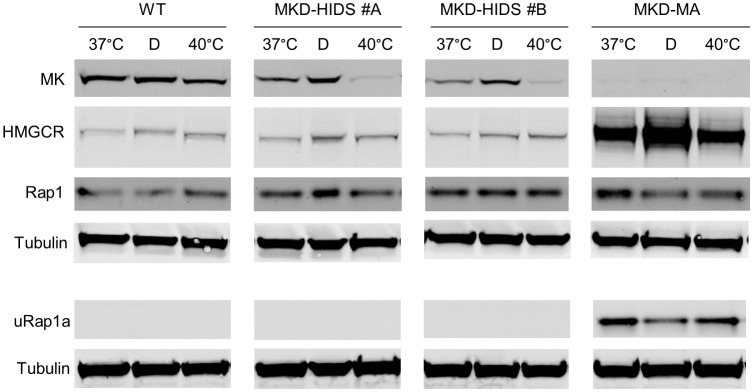
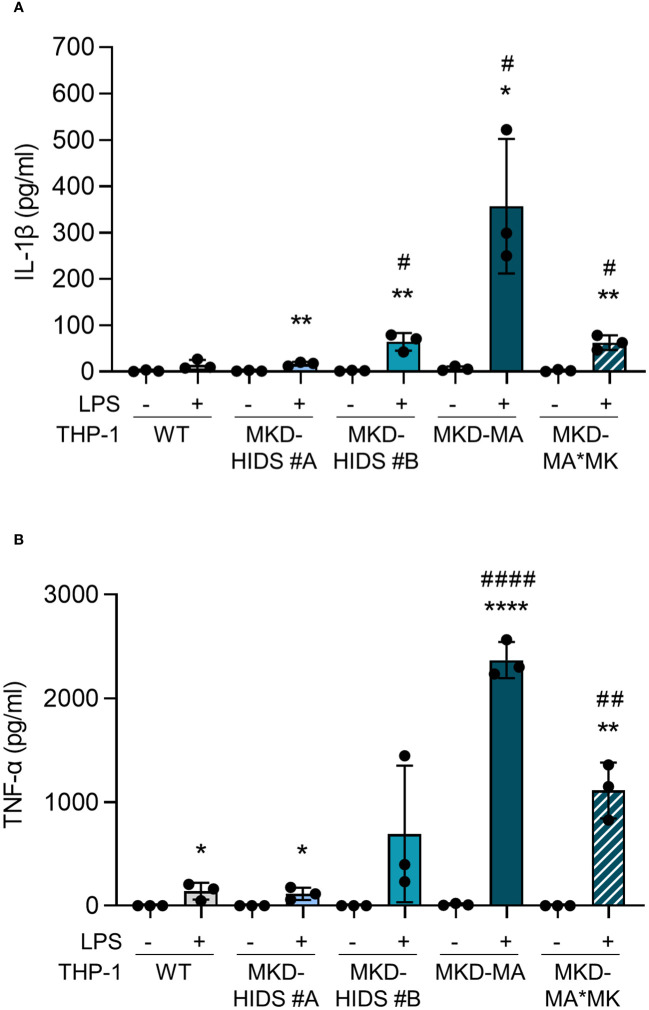
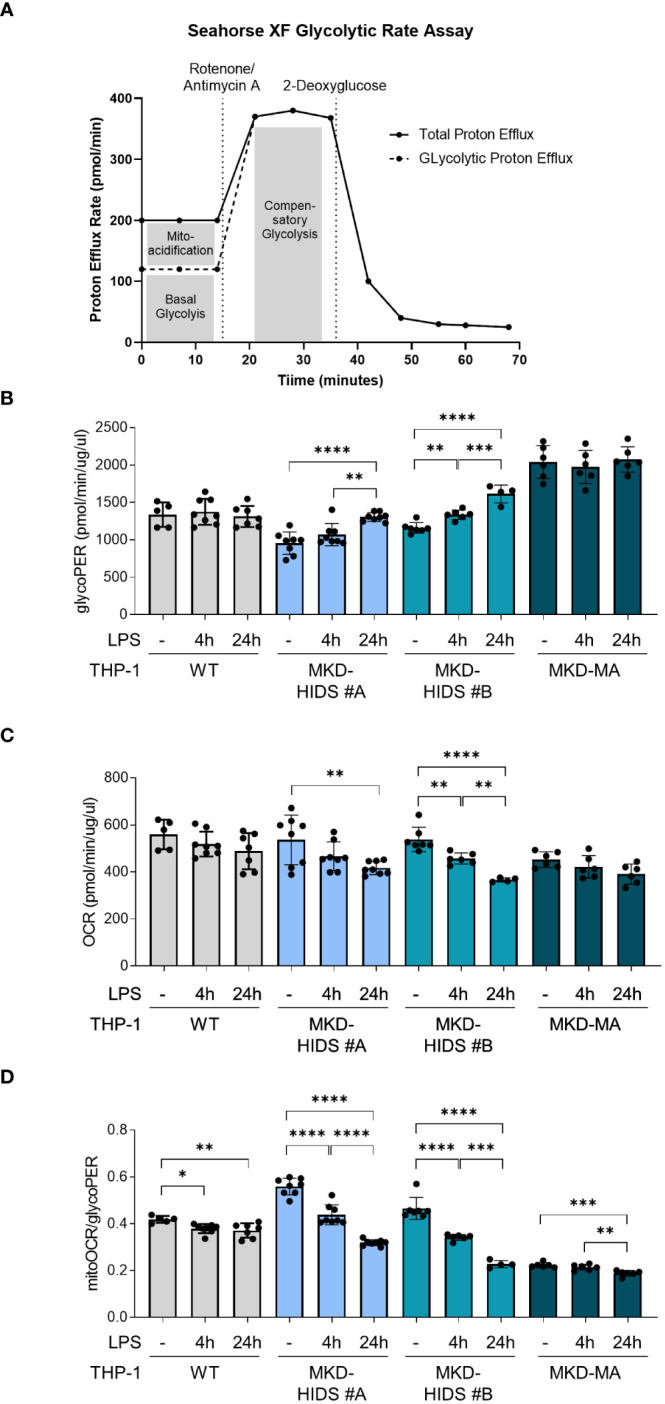
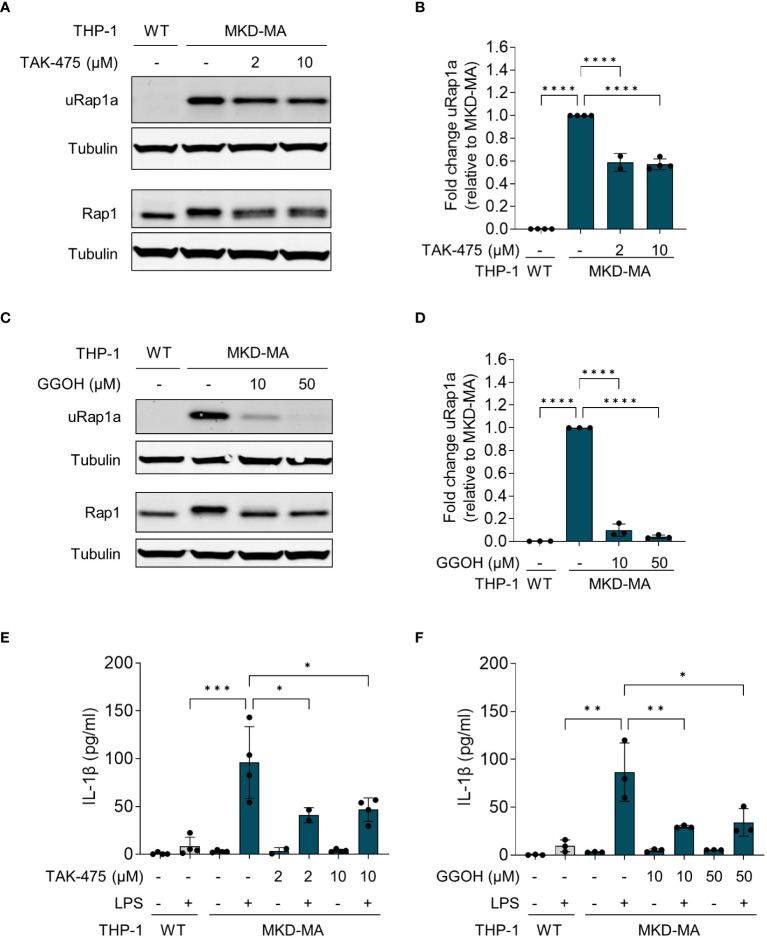
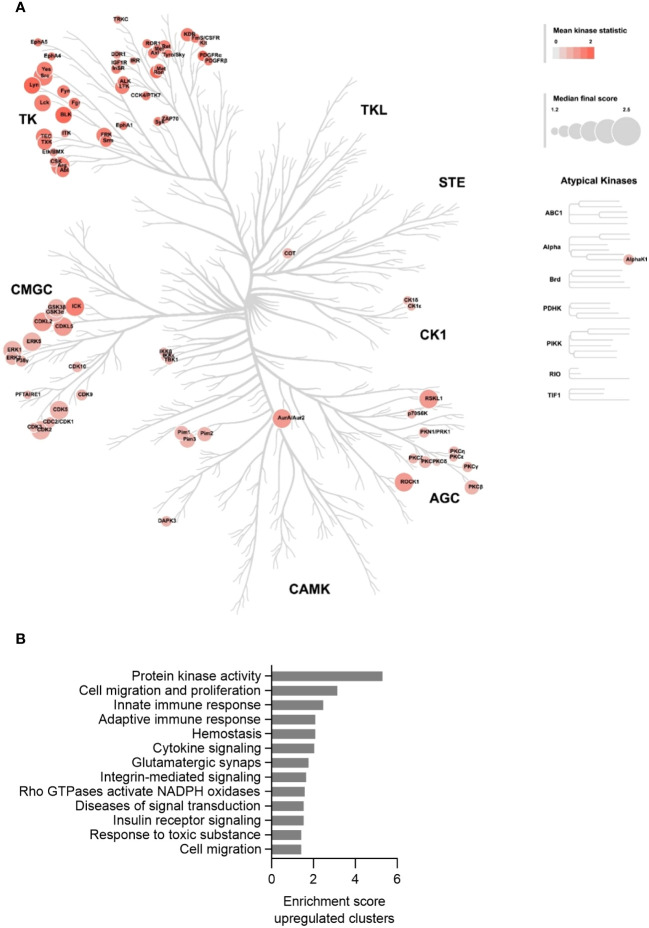
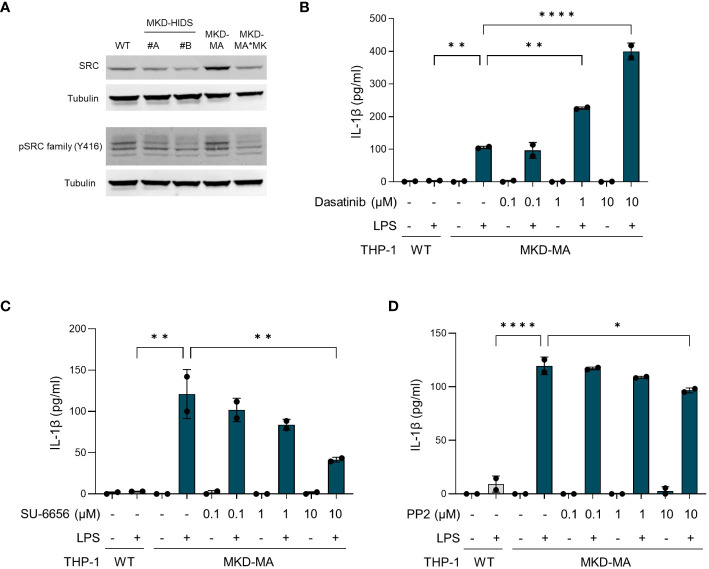
Results: Similar to MKD patients' cells, MK deficiency in the THP-1 cells caused a pro-inflammatory phenotype with a severity correlating with the residual MK protein levels. In the MKD-MA THP-1 cells, MK protein levels were barely detectable, which affected protein prenylation and was accompanied by a profound pro-inflammatory phenotype. This included a markedly increased LPS-stimulated release of pro-inflammatory cytokines and a metabolic switch from oxidative phosphorylation towards glycolysis. We also observed increased activity of protein kinases that are involved in cell migration and proliferation, and in innate and adaptive immune responses. The MKD-HIDS THP-1 cells had approximately 20% residual MK activity and showed a milder phenotype, which manifested mainly upon LPS stimulation or exposure to elevated temperatures.

Conclusion: MK-deficient THP-1 cells show the biochemical and pro-inflammatory phenotype of MKD and are a good model to study underlying disease mechanisms and therapeutic options of this autoinflammatory disorder.

Keywords: autoinflammatory disorders; cytokines; hyper IgD syndrome; innate immune response; isoprenoid biosynthesis; mevalonate kinase deficiency.


Conflict of interest statement

The authors declare that the research was conducted in the absence of any commercial or financial relationships that could be construed as a potential conflict of interest.

Figures

Figure 1
Figure 1
Characterization of WT, MKD-HIDS, MKD-MA and MKD-MA*MK THP-1 cells cultured for 24 hours under standard culture conditions. (A) Immunoblot analysis of MK, HMGCR, Rap1 and unprenylated Rap1a (uRap1a). (B) MK activity in pmol/(mg.min) indicated as mean ± SD of duplicate measurements.
Figure 2
Figure 2
Effect of culturing WT, MKD-HIDS and MKD-MA THP-1 cells for 24 hours in the presence of delipidated FBS or at elevated temperature. Immunoblot analysis of MK, HMGCR, Rap1 and unprenylated Rap1a (uRap1a) of THP-1 cell cultured at the indicated temperatures in standard medium with 10% FBS, or at 37°C in the presence of 10% delipidated FBS (D).
Figure 3
Figure 3
Cytokine release by THP-1 WT, MKD-HIDS, MKD-MA and MKD-MA*MK cells. Cells were cultured for 20 hours followed by an additional 4 hours of culturing with 0 or 10 ng/ml LPS. (A) IL-1β release and (B) TNF-α release measured in the supernatants. Data are presented as mean ± SD of three independent experiments. Statistical analysis was performed using unpaired t tests to compare unstimulated and LPS-stimulated cytokine release for each cell line, *p-value < 0.05, **p-value < 0.01, ****p-value < 0.0001, and unpaired t tests to compare the LPS-stimulated cytokine release of the MKD-HIDS, MKD-MA and MKD-MA*MK to the WT THP-1 cells, #p-value < 0.05, ##p-value < 0.01, ####p-value < 0.0001.
Figure 4
Figure 4
Metabolic reprogramming in MK-deficient THP-1 cells. WT, MKD-HIDS and MKD-MA THP-1 cells were stimulated for 4 or 24 hours with LPS. (A) Schematic overview of Glycolytic Rate Assay (adjusted from Agilent, Seahorse XF Glycolytic Rate Assay). (B) Basal glycolysis indicated as proton efflux rate (glycoPER). (C) Mitochondrial oxygen consumption rate indicated as mitoOCR. (D) The ratio mitoOCR over glycoPER. Data are presented as mean ± SD of at least four replicates. Statistical analysis was performed using one-way ANOVA followed by Tukey’s multiple comparison test for each cell line, *p-value < 0.05, **p-value < 0.01, ***p-value < 0.001, ****p-value < 0.0001.
Figure 5
Figure 5
Pharmacological rescue of unprenylated Rap1a (uRap1a) protein levels and IL-1β release. MKD-MA THP-1 cells were cultured for 20 hours in the presence of TAK-475 or GGOH and stimulated for an additional 4 hours with 10 ng/ml LPS. Immunoblot analysis of uRap1a, total Rap1 and tubulin in MKD-MA THP-1 cells cultured in the presence of LPS and TAK-475 (A) or GGOH (C). uRap1a protein levels were quantified and expressed relative to the vehicle control treated MKD-MA THP- cells (B, D). IL-1β release was measured in the supernatants of WT and MKD-MA THP-1 cells cultured in the presence of TAK-475 (E) or GGOH (F). Data are presented as mean ± SD of at least two independent experiments. Statistical analysis was performed using one-way ANOVA followed by Dunnett’s multiple comparison test, *p-value < 0.05, **p-value < 0.01, ***p-value < 0.001, ****p-value < 0.0001.
Figure 6
Figure 6
Kinase activity profiling in the MKD-MA THP-1 cell line. (A) Mapping of predicated kinases (Median Final Score > 1.2) with increased activity in the MKD-MA THP-1 cell line compared the WT THP-1 cells on a phylogenetic kinome tree. The color of the nodes indicates the kinase statistic. The node size indicates the Median Final Score. The kinome tree was created using CORAL. Data is based on three independent experiments. (B) Functional annotation clustering of the predicated activated kinases in the MKD-MA THP-1 cells. For used datasets see Supplementary table 1 .
Figure 7
Figure 7
Chemotaxis in WT, MKD-HIDS, MKD-MA and MKD-MA*MK THP-1 cells. (A) MCP-1-dependent chemotaxis of WT, MKD-MA and MKD-MA*MK THP-1 cells cultured for 24 hours under standard culture conditions. Significance was determined within each cell line using unpaired t-tests, **p-value < 0.01, ****p-value < 0.0001. (B) MCP-1-dependent chemotaxis of WT, MKD-HIDS and MKD-MA THP-1 cells cultured for 24 hours in the presence or absence of 10 ng/ml LPS. Data are presented as mean ± SD of two independent experiments performed in duplicate. Different symbols represent results from independent experiments. Statistical significance was determined for each cell line by one-way ANOVA followed by Dunnett’s multiple comparison test compared to MCP-1 stimulated chemotaxis, *p-value < 0.05, **p-value < 0.01, ***p-value < 0.001.
Figure 8
Figure 8
Src kinases in MK-deficient THP-1 cells. (A) Immunoblot analysis of Src and Src family kinases in WT, MKD-HIDS, MKD-MA and MKD*MK THP-1 cells. (B-D) IL-1β release by MKD-MA THP-1 cells cultured for 1 hour in the presence of the indicated concentrations of (B) Dasatinib, (C) SU-6656 or (D) PP2, after which LPS was added to a final concentration of 10 ng/ml and the cells were cultured for another 4 hours. Data are presented as mean ± SD of two replicates. Statistical analysis was performed using one-way ANOVA followed by Dunnett’s multiple comparison test, *p-value < 0.05, **p-value < 0.01, ***p-value < 0.001, ****p-value < 0.0001.

Similar articles

References

    1. Drenth JPH, Cuisset L, Grateau G, Vasseur C, van de Velde-Visser SD, de Jong JGN, et al. . Mutations in the gene encoding mevalonate kinase cause hyper-IgD and periodic fever syndrome. Nat Genet. (1999) 22:178–81. doi: 10.1038/9696 - DOI - PubMed
    1. Houten SM, Kuis W, Duran M, de Koning TJ, van Royen-Kerkhof A, Romeijn GJ, et al. . Mutations in MVK, encoding mevalonate kinase, cause hyperimmunoglobulinaemia D and periodic fever syndrome. Nat Genet. (1999) 22:175–7. doi: 10.1038/9691 - DOI - PubMed
    1. Drenth JP, Haagsma CJ, van der Meer JW. Hyperimmunoglobulinemia D and periodic fever syndrome. The clinical spectrum in a series of 50 patients. International Hyper-IgD Study Group. Medicine. (1994) 73:133–44. doi: 10.1097/00005792-199405000-00002 - DOI - PubMed
    1. ter Haar NM, Jeyaratnam J, Lachmann HJ, Simon A, Brogan PA, Doglio M, et al. . The phenotype and genotype of mevalonate kinase deficiency: A series of 114 cases from the eurofever registry. Arthritis Rheumatol. (2016) 68:2795–805. doi: 10.1002/art.39763 - DOI - PubMed
    1. van der Hilst JCH, Bodar EJ, Barron KS, Frenkel J, Drenth JPH, van der Meer JWM, et al. . Long-term follow-up, clinical features, and quality of life in a series of 103 patients with hyperimmunoglobulinemia D syndrome. Medicine. (2008) 87:301–10. doi: 10.1097/MD.0b013e318190cfb7 - DOI - PubMed

Publication types

Substances

LinkOut - more resources