. 2024 Feb 28;2024(2):hoae013.
doi: 10.1093/hropen/hoae013. eCollection 2024.

Ovarian ferroptosis induced by androgen is involved in pathogenesis of PCOS

Affiliations

Ovarian ferroptosis induced by androgen is involved in pathogenesis of PCOS

Xinyu Li et al. Hum Reprod Open. .

Abstract

Study question: Does ovarian ferroptosis play an active role in the development of polycystic ovary syndrome (PCOS)?

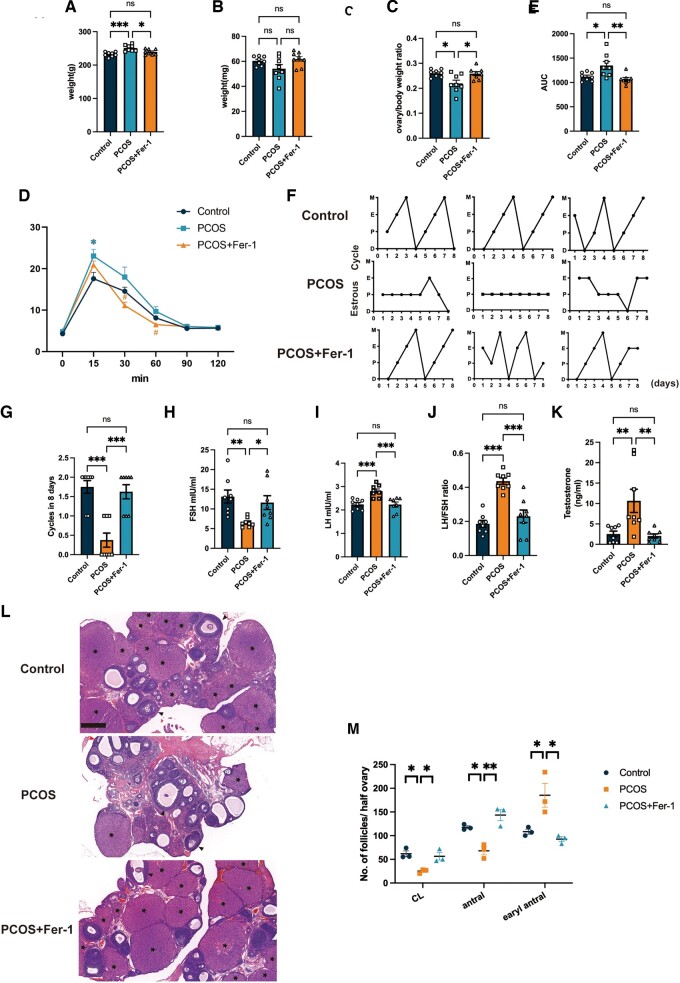
Summary answer: Increased ovarian ferroptosis was present in PCOS ovaries and the inhibition of ferroptosis with ferrostatin-1 (Fer-1) ameliorated polycystic ovary morphology and anovulation.

What is known already: Programmed cell death plays a fundamental role in ovarian follicle development. However, the types and mechanisms of cell death involved in the ovary are yet to be elucidated. Ferroptosis is a recently discovered iron-dependent programmed cell death. Impaired iron metabolism and cell death have been observed in women with PCOS, the main cause of anovulatory infertility. Additionally, previous studies reported that an abnormal expression of noncoding RNA may promote ferroptosis in immortalized ovarian granulosa cell lines. However, little is known about whether ovarian ferroptosis is increased in PCOS, and there is insufficient direct evidence for a role of ferroptosis in PCOS, and the underlying mechanism. Moreover, the effect of the inhibition of ferroptosis with Fer-1 in PCOS remains unclear.

Study design size duration: Ferroptosis was evaluated in human granulosa cells (hGCs) from non-PCOS (n = 6-16) and PCOS (n = 7-18) patients. The experimental study was completed in vitro using primary hGCs from women undergoing IVF. Improvements in PCOS indicators following ferroptosis inhibition with Fer-1 were investigated in a dehydroepiandrosterone (DHEA)-induced PCOS rat model (n = 8 per group).

Participants/materials setting methods: Ovarian ferroptosis was evaluated in the following ways: by detecting iron concentrations via ELISA and fluorescent probes; measuring malondialdehyde (MDA) concentrations via ELISA; assessing ferroptosis-related protein abundance with western blotting; observing mitochondrial morphology with transmission electron microscopy; and determining cell viability. Primary hGCs were collected from women undergoing IVF. They were treated with dihydrotestosterone (DHT) for 24 h. The effect of DHT on ferroptosis was examined in the presence or absence of small interfering RNA-mediated knockdown of the putative receptor coregulator for signaling molecules. The role of ovarian ferroptosis in PCOS progression was explored in vivo in rats. The DHEA-induced PCOS rat model was treated with the ferroptosis inhibitor, Fer-1, and the oocytes and metaphase II oocytes were counted after ovarian stimulation. Additionally, rats were treated with the ferroptosis inducer, RSL3, to further explore the effect of ferroptosis. The concentrations of testosterone, FSH, and LH were assessed.

Main results and the role of chance: Increased ferroptosis was detected in the ovaries of patients with PCOS and in rats with DHEA-induced PCOS. Increased concentrations of Fe2+ (P < 0.05) and MDA (P < 0.05), and upregulated nuclear receptor coactivator 4 protein levels, and downregulated ferritin heavy chain 1 (FTH1) and glutathione peroxidase 4 (GPX4) proteins were observed in the hGCs in patients with PCOS and ovaries of PCOS rats (P < 0.05 versus control). DHT was shown to induce ferroptosis via activation of NOCA4-dependent ferritinophagy. The inhibition of ferroptosis with Fer-1 in rats ameliorated a cluster of PCOS traits including impaired glucose tolerance, irregular estrous cycles, reproductive hormone dysfunction, hyperandrogenism, polycystic ovaries, anovulation, and oocyte quality (P < 0.05). Treating rats with RSL3 resulted in polycystic ovaries and hyperandrogenism (P < 0.05).

Large-scale data: N/A.

Limitations reasons for caution: Although ovarian-targeted ferroptosis inhibition may be a more targeted treatment for PCOS, the underlying mechanisms in the cycle between ferroptosis and hyperandrogenism require further exploration. Additionally, since PCOS shows high heterogeneity, it is important to investigate whether ferroptosis increases are present in all patients with PCOS.

Wider implications of the findings: Androgen-induced ovarian ferroptosis appears to play a role in the pathogenesis of PCOS, which potentially makes it a promising treatment target in PCOS.

Study funding/competing interests: This study was supported by the National Key R&D Program of China (2023YFC2705500, 2023YFC2705505, 2019YFA0802604), National Natural Science Foundation of China (No. 82130046, 82320108009, 82101708, 82101747, and 82001517), Shanghai leading talent program, Innovative research team of high-level local universities in Shanghai (No. SHSMU-ZLCX20210201, No. SSMU-ZLCX20180401), Shanghai Jiaotong University School of Medicine, Affiliated Renji Hospital Clinical Research Innovation Cultivation Fund Program (RJPY-DZX-003) and Shanghai Municipal Education Commission-Gaofeng Clinical Medicine Grant Support (No. 20161413), Shanghai's Top Priority Research Center Construction Project (2023ZZ02002), and Three-Year Action Plan for Strengthening the Construction of the Public Health System in Shanghai (GWVI-11.1-36). The authors report no competing interests.

Keywords: PCOS; androgen; ferroptosis; nuclear receptor coactivator 4; ovarian dysfunction.


Conflict of interest statement

All authors declare no conflict of interest in relation to this work.

Figures

Figure 1.
Figure 1.
Elevated ferroptosis in granulosa cells from patients with PCOS. (A). Representative images of intracellular Fe2+ in GCs from PCOS patients and non-PCOS patients detected by FerroOrange (n = 3 per group). Scale bar = 20 μm. (B and C) The cellular Fe2+ concentration (n = 6–7 per group) and MDA concentration (n = 16–18 per group) of GCs from non-PCOS and PCOS groups were also detected. (D) GCs isolated from PCOS patients were treated with Fer-1 (1 μM) for 48 h and then cell viability was detected by CCK-8 (n = 6 per group). (EI) Protein abundance of ferroptosis-related proteins NCOA4, FTH1, GPX4 in GCs from PCOS patients and non-PCOS patients (n = 16 per group), assessed by western blotting. (J) Representative TEM images of GCs from PCOS patients and non-PCOS patients. Scale bar = 500 nm. Red arrowheads indicate abnormal mitochondria. Data were analyzed using unpaired Student’s t-test and presented as mean ± SEM. *P < 0.05; **P < 0.01, ***P < 0.001, ns: no significance versus the non-PCOS group. CCK-8: cell counting kit-8; Fer-1: ferrostatin-1; FTH1: ferritin heavy chain 1; GCs: granulosa cells; GPX4: glutathione peroxidase 4; MDA: malondialdehyde; NCOA4: nuclear receptor coactivator 4; PCOS: polycystic ovary syndrome; TEM: transmission electron microscopy.
Figure 2.
Figure 2.
Elevated ferroptosis in the ovaries of rats with dehydroepiandrosterone-induced PCOS. (A and B) Fe2+ concentration (n = 7 per group) and MDA concentration (n = 5 per group) in the ovaries of rats from the control group and the PCOS group. (CE) Protein abundance of ferroptosis-related proteins NCOA4, FTH1, and Gpx4 in the ovaries of rats from the two groups. (F) Representative TEM images of GCs in the ovaries of rats from control group and the PCOS group. Scale bar = 500 nm. Red arrowheads indicate abnormal mitochondria. Data were analyzed using unpaired Student’s t-test and presented as mean ± SEM. *P < 0.05; **P < 0.01, ***P < 0.001 versus the control group. Fer-1: ferrostatin-1; FTH1: ferritin heavy chain 1; GCs: granulosa cells; Gpx4: glutathione peroxidase 4; MDA: malondialdehyde; NCOA4: nuclear receptor coactivator 4; PCOS: polycystic ovary syndrome; TEM: transmission electron microscopy.
Figure 3.
Figure 3.
Treatment with ferrstatin-1 alleviated ovary ferroptosis in the rat model of PCOS. PCOS rats were treated with the ferroptosis inhibitor Fer-1 (5 mg/kg BW, i.p. qod). (A) Diagrammatic representation of the rats from the control group, the PCOS group, and the PCOS + Fer-1 group. (BE) Protein abundance of ferroptosis-related proteins NCOA4, FTH1, and Gpx4 in the ovaries of rats from the three groups. (n = 8 per group). (F and G) Fe2+ concentration (n = 5 per group) and MDA concentration (n = 5 per group) in the ovaries of rats from the control group, the PCOS group, and the PCOS + Fer-1 group. (H). Representative TEM images of mitochondrial morphology in ovary GCs from the three groups. Red arrowheads indicate abnormal mitochondria. Scale bar = 500 nm. Data were analyzed using one-way ANOVA with Tukey’s multiple comparison postdoc test and presented as mean ± SEM. *P < 0.05; **P < 0.01, ns: no significance versus the control group. BW: body weight; Fer-1: ferrostatin-1; FTH1: ferritin heavy chain 1; GCs: granulosa cells; Gpx4: glutathione peroxidase 4; MDA: malondialdehyde; NCOA4: nuclear receptor coactivator 4; PCOS: polycystic ovary syndrome; qd: once a day; qod: once every other day; SD: Sprague-Dawley; TEM: transmission electron microscopy.
Figure 4.
Figure 4.
Inhibition of ferroptosis with ferrstatin-1 reversed the increased body weight, insulin resistance, acyclicity, increased LH/FSH ratio, hyperandrogenism, and ovarian phenotypes in PCOS. PCOS rats were treated with ferroptosis inhibitor Fer-1 (5 mg/kg BW, i.p. qod). (AC) Body weights, ovary weights, and ovary/body weight ratio of rats from the control group, the PCOS group, and the PCOS + Fer-1 group (n = 8 per group). (D and E) Glucose tolerance test and its AUC values were assessed in rats from the control, PCOS, and PCOS + Fer-1 group (n = 8 per group). (F and G) The representative estrous cycle of rats and the number of cycles completed in 8 days in the three different experimental groups (n = 8 per group). (HK) FSH levels, LH levels, the LH/FSH ratio, and testosterone levels of rats in the control, PCOS, and PCOS + Fer-1 group (n = 8 per group). (L) Representative histological section images of ovaries from the control and experimental groups. Scale bar = 500μm. Asterisks indicate corpus luteum, black arrowheads indicate antral follicles. (M) The number of CL, antral, and early antral follicles in the ovaries of rats from each group (n = 3 per group). Data were analyzed using one-way ANOVA with Tukey’s multiple comparison post-hoc test and presented as mean ± SEM. *P < 0.05; **P < 0.01; ***P < 0.001 ns: no significance versus the control group. BW: body weight; CL: corpus luteum; D: diestrus; E: estrus; Fer-1: ferrostatin-1; M: metestrus; P: proestrus; PCOS: polycystic ovary syndrome; qod: once every other day.
Figure 5.
Figure 5.
Inhibition of ferroptosis with ferrostatin-1 reversed PCOS ovulation dysfunction and oocyte quality. PCOS rats were treated with the ferroptosis inhibitor Fer-1 (5 mg/kg BW, i.p. qod) before inducing superovulation in the rats from the control, PCOS, and PCOS + Fer-1 group. (A and B) Representative images and number of ovulated oocytes from rats in the control, PCOS, and PCOS + Fer-1 group (n = 7–8 per group). (C) The MII oocytes rate of rats from the three groups (n = 7–8 per group). Scale bar =100 μm. Data were analyzed using one-way ANOVA with Tukey’s multiple comparison postdoc test and presented as mean ± SEM. *P < 0.05; ***P < 0.001 versus the control group. bw: body weight; Fer-1: ferrostatin-1; MII: metaphase II; PCOS: polycystic ovary syndrome; qod: once every other day.
Figure 6.
Figure 6.
Dihydrotestosterone induced ferroptosis in human granulosa cells. (A). GCs were treated with DHT (500 nM) for 24 h and then Fe2+ was detected by FerroOrange staining (n = 3 per treatment). Scale bar = 20 μm. (B and C) Fe2+ and MDA concentration of GCs treated with DHT (500 nM) for 24h (n = 5 per treatment). (D and E) Cell viability of GCs treated with DHT (500 nM) for 48 h and incubated with or without Fer-1 (1 μM). (FI) Protein abundance of the ferroptosis-related proteins NCOA4, FTH1, and GPX4. (JM) After transfection with siNOCA4 and siNC, GCs were treated with or without DHT (500 nM) for 24 h, and then protein abundance of the ferroptosis-related proteins NCOA4, FTH1, GPX4 was measured. Data were analyzed using one-way ANOVA with Tukey’s multiple comparison post-hoc test and presented as mean ± SEM. *P < 0.05; **P < 0.01; ***P < 0.001. DHT: dihydrotestosterone; Fer-1: ferrostatin-1; FTH1: ferritin heavy chain 1; GC: granulosa cell; GPX4: glutathione peroxidase 4; MDA: malondialdehyde; NCOA4: nuclear receptor coactivator 4; siNC: control siRNA.
Figure 7.
Figure 7.
Ferroptosis induced an increased LH/FSH ratio, hyperandrogenism, and polycystic ovaries in rats. Rats were treated with the ferroptosis inducer RSL3 (10 μM, i.p. qod). (A). Diagrammatic representation of the rats from the RSL3 group treatment. (B), Representative histological section images of ovaries from the control and RSL3 groups. (C) The number of CL, antral and early antral follicles in the ovaries of rats from each group. (DG). LH levels, FSH levels, the LH/FSH ratio, and testosterone levels of rats in the control and RSL3 groups (n = 4 per group). (HF) The protein abundance of CYP17a1 in ovaries of rats from the two groups (n = 4 per group). Data were analyzed using the unpaired Student’s t-test and presented as mean ± SEM. *P < 0.05; **P < 0.01 versus the control group. CL: corpus luteum; CYP17a1: cytochrome P450 17α-hydroxylase; qod: once every other day; SD: Sprague-Dawley.
Figure 8.
Figure 8.
Diagram illustrating the molecular network of this study. Increased DHT increases NCOA4 content in ovarian granulosa cells, which may result in increased ferritinophagy, and a decrease in FTH1, which leads to an elevation of Fe2+ concentrations. The increased NCOA4 induces a decrease of GPX4 in the ovarian granulosa cells. These two aspects combine to enhance ferroptosis in PCOS ovaries. AR: androgen receptor; DHT: dihydrotestosterone; FTH1: ferritin heavy chain 1; GPX4: glutathione peroxidase 4; NCOA4: nuclear receptor coactivator 4; PCOS: polycystic ovary syndrome; T: testosterone.

Similar articles

Cited by

References

    1. Adamska A, Łebkowska A, Krentowska A, Adamski M, Kowalska I.. The association between serum ferritin concentration and visceral adiposity estimated by whole-body DXA scan in women with polycystic ovary syndrome. Front Endocrinol (Lausanne) 2019;10:873. - PMC - PubMed
    1. Azziz R, Carmina E, Chen Z, Dunaif A, Laven JSE, Legro RS, Lizneva D, Natterson-Horowtiz B, Teede HJ, Yildiz BO.. Polycystic ovary syndrome. Nat Rev Dis Primers 2016;2:16057. - PubMed
    1. Badgley MA, Kremer DM, Maurer HC, DelGiorno KE, Lee H-J, Purohit V, Sagalovskiy IR, Ma A, Kapilian J, Firl CEM. et al. Cysteine depletion induces pancreatic tumor ferroptosis in mice. Science 2020;368:85–89. - PMC - PubMed
    1. Bannigida DM, Nayak BS, Vijayaraghavan R.. Insulin resistance and oxidative marker in women with PCOS. Arch Physiol Biochem 2020;126:183–186. - PubMed
    1. Chaudhary GR, Yadav PK, Yadav AK, Tiwari M, Gupta A, Sharma A, Pandey AN, Pandey AK, Chaube SK.. Necroptosis in stressed ovary. J Biomed Sci 2019;26:11. - PMC - PubMed