

Advanced Time-Stepping Interpretation of Fly-Scan Continuous Rotation Synchrotron Tomography of Dental Enamel Demineralization
- PMID: 38551010
- PMCID: PMC10966730
- DOI: 10.1021/cbmi.3c00121
Advanced Time-Stepping Interpretation of Fly-Scan Continuous Rotation Synchrotron Tomography of Dental Enamel Demineralization
Abstract
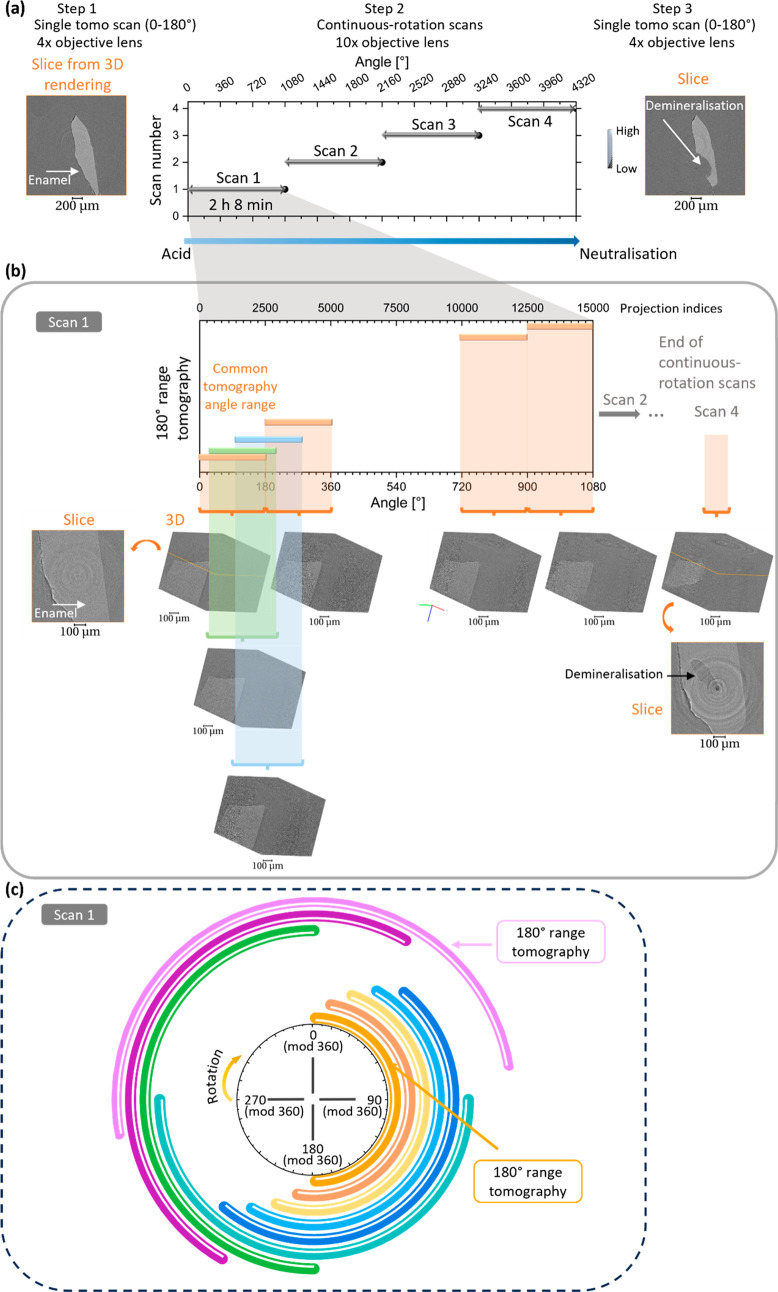
High-resolution spatial and temporal analysis and 3D visualization of time-dependent processes, such as human dental enamel acid demineralization, often present a challenging task. Overcoming this challenge often requires the development of special methods. Dental caries remains one of the most important oral diseases that involves the demineralization of hard dental tissues as a consequence of acid production by oral bacteria. Enamel has a hierarchically organized architecture that extends down to the nanostructural level and requires high resolution to study its evolution in detail. Enamel demineralization is a dynamic process that is best investigated with the help of in situ experiments. In previous studies, synchrotron tomography was applied to study the 3D enamel structure at certain time points (time-lapse tomography). Here, another distinct approach to time-evolving tomography studies is presented, whereby the sample image is reconstructed as it undergoes continuous rotation over a virtually unlimited angular range. The resulting (single) data set contains the data for multiple (potentially overlapping) intermediate tomograms that can be extracted and analyzed as desired using time-stepping selection of data subsets from the continuous fly-scan recording. One of the advantages of this approach is that it reduces the amount of time required to collect an equivalent number of single tomograms. Another advantage is that the nominal time step between successive reconstructions can be significantly reduced. We applied this approach to the study of acidic enamel demineralization and observed the progression of demineralization over time steps significantly smaller than the total acquisition time of a single tomogram, with a voxel size smaller than 0.5 μm. It is expected that the approach presented in this paper can be useful for high-resolution studies of other dynamic processes and for assessing small structural modifications in evolving hierarchical materials.
© 2024 The Authors. Co-published by Nanjing University and American Chemical Society.
Conflict of interest statement
The authors declare no competing financial interest.
Figures
Similar articles
-
Multi-resolution Correlative Ultrastructural and Chemical Analysis of Carious Enamel by Scanning Microscopy and Tomographic Imaging.ACS Appl Mater Interfaces. 2023 Aug 9;15(31):37259-37273. doi: 10.1021/acsami.3c08031. Epub 2023 Jul 31. ACS Appl Mater Interfaces. 2023. PMID: 37524079 Free PMC article.
-
An improved intra-oral enamel demineralization test model for the study of dental caries.J Dent Res. 1992 Apr;71 Spec No:871-8. doi: 10.1177/002203459207100S17. J Dent Res. 1992. PMID: 1592978
-
Dynamic measurement of the optical properties of bovine enamel demineralization models using four-dimensional optical coherence tomography.J Biomed Opt. 2017 Jul 1;22(7):76020. doi: 10.1117/1.JBO.22.7.076020. J Biomed Opt. 2017. PMID: 28759676
-
[Local enamel demineralization diagnostics and treatment].Stomatologiia (Mosk). 2017;96(4):67-71. doi: 10.17116/stomat201796467-71. Stomatologiia (Mosk). 2017. PMID: 28858285 Review. Russian.
-
Human enamel structure studied by high resolution electron microscopy.Electron Microsc Rev. 1989;2(1):1-16. doi: 10.1016/0892-0354(89)90008-7. Electron Microsc Rev. 1989. PMID: 2491337 Review.
Cited by
-
The application of deep learning in early enamel demineralization detection.PeerJ. 2025 Jan 2;13:e18593. doi: 10.7717/peerj.18593. eCollection 2025. PeerJ. 2025. PMID: 39763696 Free PMC article.
References
-
- Brès E. F.; Reyes-Gasga J.; Hemmerlé J.. Human Tooth Enamel, a Sophisticated Material. In Extracellular Matrix Biomineralization of Dental Tissue Structures, Vol. 10; Goldberg M, Den Besten P, Eds.; Springer International Publishing, 2021; pp 243–259.
-
- Featherstone J. D. B.; Lussi A.. Understanding the chemistry of dental erosion. In Monographs in Oral Science - Dental Erorion From Diagnosis to Therapy, Vol. 20; Whitford G.M., Lussi A., Eds.; Karger, 2006. - PubMed
LinkOut - more resources
Full Text Sources