. 2024 Jun 3;223(6):e202311024.
doi: 10.1083/jcb.202311024. Epub 2024 Mar 29.

LET-767 determines lipid droplet protein targeting and lipid homeostasis

Affiliations

LET-767 determines lipid droplet protein targeting and lipid homeostasis

Lin Fu et al. J Cell Biol. .

Abstract

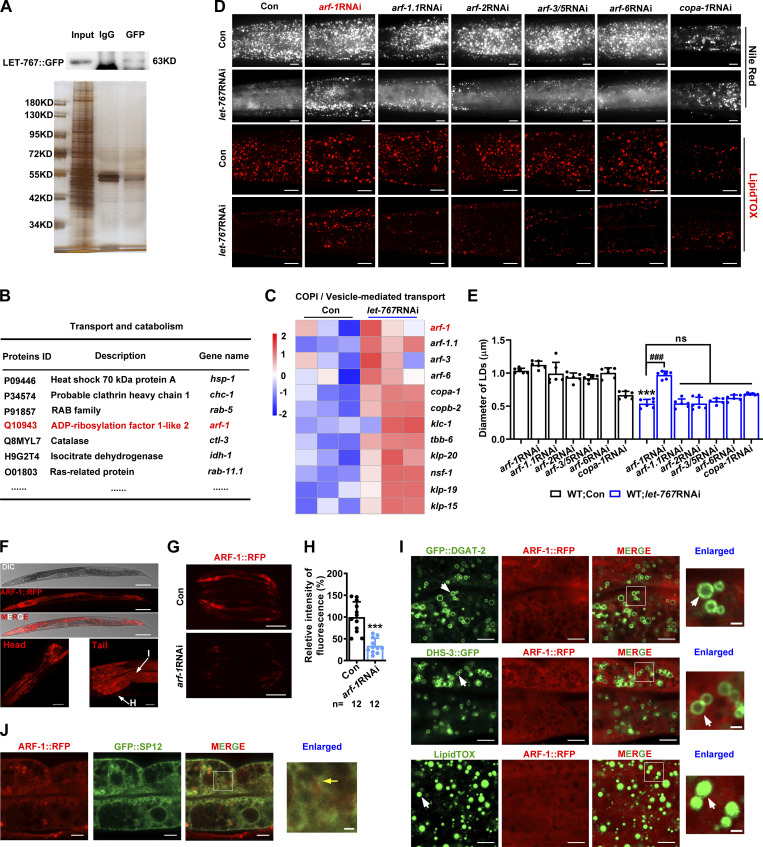
Lipid droplets (LDs) are composed of a core of neutral lipids wrapped by a phospholipid (PL) monolayer containing several hundred proteins that vary between different cells or organisms. How LD proteins target to LDs is still largely unknown. Here, we show that RNAi knockdown or gene mutation of let-767, encoding a member of hydroxysteroid dehydrogenase (HSD), displaced the LD localization of three well-known LD proteins: DHS-3 (dehydrogenase/reductase), PLIN-1 (perilipin), and DGAT-2 (diacylglycerol O-acyltransferase 2), and also prevented LD growth in Caenorhabditis elegans. LET-767 interacts with ARF-1 (ADP-ribosylation factor 1) to prevent ARF-1 LD translocation for appropriate LD protein targeting and lipid homeostasis. Deficiency of LET-767 leads to the release of ARF-1, which further recruits and promotes translocation of ATGL-1 (adipose triglyceride lipase) to LDs for lipolysis. The displacement of LD proteins caused by LET-767 deficiency could be reversed by inhibition of either ARF-1 or ATGL-1. Our work uncovers a unique LET-767 for determining LD protein targeting and maintaining lipid homeostasis.


Conflict of interest statement

Disclosures: The authors declare no competing interests exist.

Figures

Figure 1.
Figure 1.
Reduction of LET-767 disrupted LD protein targeting. (A) Schematic workflow of RNAi screen for genes affecting LD size and DHS-3::GFP LD localization. LipidTOX staining of fixed worms. (B) LipidTOX staining of LDs in young adult WT worms under RNAi treatments. White arrows indicate LDs. (C) Quantification of LD diameter from B. Data are presented as mean ± SD of six representative animals for each worm strain. Statistical difference between Con and a specific RNAi treatment, ***P < 0.001 by one-way ANOVA. (D) Localization of DHS-3::GFP with respect to LDs stained by LipidTOX. White arrows and yellow arrows indicate the localization of DHS-3::GFP on LDs or not, respectively. The enlarged image was from the corresponding merged image. (E) Localization of DHS-3::GFP with respect to the ER marked by mCherry::HDEL. White arrows indicate LDs and yellow arrows indicate the localization of DHS-3::GFP on the ER. (F) Intensity profiles of labeled scans from high-magnification regions, E-1 and E-2, show the localization of DHS-3::GFP visualized in E. (G) Localization of DHS-3::mCherry with respect to ER marked by GFP::SP12. White arrows indicate LDs and yellow arrows indicate the localization of DHS-3::mCherry on the ER. (H) Intensity profiles of labeled scans from high-magnification regions, G-1 and G-2, show the localization of DHS-3::mCherry found in G. (I) Localization of PLIN-1::mCherry with respect to ER marked by GFP::SP12. White arrows indicate LDs and yellow arrows indicate the localization of PLIN-1::mCherry on the ER. (J) Intensity profiles of labeled scans from high-magnification regions, I-1 and I-2, show the localization of PLIN-1::mCherry found in I. (K) Localization of GFP::DGAT-2 with respect to lysosome stained by Lyso tracker. White arrows indicate LDs and yellow arrows indicate the localization of GFP::DGAT-2 on the lysosome. (L) Intensity profiles of labeled scans from high-magnification regions, K-1 and K-2, show the localization of GFP::DGAT-2 found in K. All fluorescence images were captured by high-resolution laser confocal microscopy (ZEISS, Carl LSM800). For all of the represented animals, the anterior is on the left and the posterior is on the right. Scale bar represents 1 μm in enlarged panels and 5 μm in others, respectively, unless specifically indicated.
Figure S1.
Figure S1.
Identification of let-767 mutations and LET-767::GFP expression. (A) The structure diagram of the let-767 gene. Genetic variants are listed on the panel and also in Table S1. Scale bar represents 50 bp. (B and C) Nile Red staining (B) and LipidTOX staining (C) of LDs in fixed worms, cultivated on E. coli HT115 or OP50, respectively. The scale bar represents 10 µm. (D and E) Quantification of LD diameters from C. Data are presented as the mean ± SD of six representative animals for each worm strain. (F) Fluorescence microscopy of LET-767::GFP. The scale bar represents 100 μm for top panel, and 50 μm for bottom panel. I and H indicate intestine and hypodermis, respectively. (G) Fluorescence intensity and quantification of LET-767::GFP and GFP::TRAM-1 in indicated worms. The scale bar represents 100 μm. n, the number of measured worms for each worm strain. (H) Relative mRNA level of let-767 by qPCR analysis. Data are presented as the mean ± SD of three biological repeats for each worm strain. (I) Top: Western blot analysis of LET-767::GFP using anti-GFP antibody. Bottom: The relative protein level of LET-767::GFP normalized by β-ACTIN as an internal Con. Data are presented as the mean ± SD of three biological repeats for each worm strain. Significant difference between two indicated worms or between Con and a specific RNAi treatment, ***P < 0.001 by two-tailed t test. For all representative animals, anterior is left and posterior is right. Images in C were taken by confocal microscopy (ZEISS, Carl LSM800), while B, F, and G were taken by ZEISS Axio Imager M2 microscopy. Source data are available for this figure: SourceData FS1.
Figure 2.
Figure 2.
Genetic mutation of let-767 consistently led to the dislocation of LD proteins. (A) Nile Red staining (taken by ZEISS Axio Imager M2 microscopy) and LipidTOX staining (taken by high-resolution laser confocal microscopy, ZEISS, Carl LSM800) of LDs in fixed worms. The stained particles are LDs in representative worms. (B) Quantification of LD diameter from A. Data are presented as the mean ± SD of six representative animals for each worm strain. (C) Lipid contents were measured by TLC and GC and presented as % of TAG in total lipids (TAG+PL). Data are presented as the mean ± SD of four biological repeats for each worm strain. (D) Localization of DHS-3::GFP with respect to ER marked by mCherry::HDEL. White arrows indicate LDs and yellow arrows indicate the localization of DHS-3::GFP on the ER. (E) Intensity profiles of labeled scans from high-magnification regions, D-1 and D-2, show the localization of DHS-3::GFP found in D. (F) Localization of DHS-3::mCherry with respect to ER marked by GFP::SP12. White arrows indicate LDs and yellow arrows indicate the localization of DHS-3::mCherry on the ER. (G) Intensity profiles of labeled scans from high-magnification regions, F-1 and F-2, show the localization of DHS-3::mCherry found in F. (H) Localization of PLIN-1::mCherry with respect to ER marked by GFP::SP12. White arrows indicate LDs and yellow arrows indicate the localization of PLIN-1::mCherry on the ER. (I) Intensity profiles of labeled scans from high-magnification regions, H-1 and H-2, show the localization of PLIN-1::mCherry found in H. (J) Localization of GFP::DGAT-2 with respect to lysosome stained by Lyso tracker. White arrows indicate LDs and yellow arrows indicate the localization of GFP::DGAT-2 on lysosome. (K) Intensity profiles of labeled scans from high-magnification regions, J-1 and J-2, show the localization of GFP::DGAT-2 found in J. (D–J) All worms were fed with E. coli OP50. Significant difference between WT and a specific mutant strain treated with Con or let-767RNAi, **P < 0.01, ***P < 0.001 by one-way ANOVA. All fluorescence images were captured by high-resolution laser confocal microscopy (ZEISS, Carl LSM800), unless specifically indicated. For all of the represented animals, the anterior is on the left, and the posterior is on the right. Scale bar represents 1 μm in enlarged panels and 5 μm in others, respectively, unless specifically indicated.
Figure 3.
Figure 3.
LET-767 is localized in the ER and LDs. (A) The prediction of LET-767 domain structure and schematic diagram of LET-767 truncation in C. elegans. Black box: Adh Short (short-chain dehydrogenase regions); blue box: KR (NAD+ binding site regions); orange red box: transmembrane region. (B) Localization of LET-767::GFP on LipidTOX-stained LDs. White arrow indicates LDs and yellow arrow indicates the localization of LET-767::GFP on LDs. Scale bar in merged and enlarged panels represent 10 and 1 μm, respectively. (C) The localization of LET-767::GFP and DHS-3::mCherry on isolated LDs stained by Lipid Blu. (D) Western blot analysis of LET-767 in various cellular fractions. LET-767::GFP and DHS-3 were detected by anti-GFP antibody and anti-DHS-3 antibody, respectively. Anti-BIP antibody was employed to detect the ER, and red arrow indicates BIP (binding immunoglobulin protein). Total loading amounts were adjusted and normalized via SDS-PAGE silver staining (bottom panel). TM, total membrane. (E) Localization of mCherry::HDEL with various LET-767::GFP truncations. (F) Intensity profiles of labeled scans from high-magnification regions, E-1, E-2, and E-3, show the colocalization of LET-767::GFP and mCherry::HDEL found in E. (G) Localization of DHS-3::mCherry with various LET-767::GFP truncation. White arrows indicate LDs and yellow arrows indicate the overlapped LET-767::GFP with DHS-3::mCherry. (H) Localization of various LET-767::GFP truncations on LDs stained by LipidTOX. White arrows indicate LDs and yellow arrows indicate the localization of LET-767::GFP on LDs. (I) LipidTOX staining of LDs in indicated worm strains. White arrows indicate LDs. (J) Quantification of LD diameter from I. Data are presented as the mean ± SD of six representative animals for each worm strain. (K) Lipid contents were measured by TLC/GC and presented as % TAG in total lipids (TAG+PL). Data are presented as the mean ± SD of three biological repeats for each worm strain. Significant difference between WT and an indicated worm strain, ***P < 0.001, significant difference between two indicated worm strains, ###P < 0.001, the P values are indicated by one-way ANOVA. ns, no significance. All fluorescence images were captured by high-resolution laser confocal microscopy (ZEISS, Carl LSM800). For all of the represented animals, the anterior is on the left and the posterior is on the right. Scale bar represents 1 μm in enlarged panels and 5 μm in others, respectively, unless specifically indicated. Source data are available for this figure: SourceData F3.
Figure S2.
Figure S2.
RNAi reduction of fat-6 or acs-1 did not affect LD protein targeting. (A) Schematic diagram of LET-767 in the biosynthesis of monomethyl-branched chain fatty acids (mmBCFAs) and unsaturated fatty acids (UFAs) in C. elegans. SFA, saturated fatty acid; PUFAs, polyunsaturated fatty acids; SL, sphingolipids. (B) Percentage of the C16:0, C16:1, C15iso, C17iso, C18:0, and C18:1(n-9) in total fatty acids. (C) SCD activity indicated by the ratio of C18:1(n-9)/C18:0. (B and C) Data are presented as the mean ± SD of four biological repeats for each worm strain. (D and E) Fluorescence intensity (D) and quantification (E) of FAT-5::GFP, FAT-6::GFP, and FAT-7:: GFP. The scale bar represents 20 μm. Data are presented as the mean ± SD. n, the number of measured worms for each worm strain. Images were taken by OLYMPUS BX53 microscopy. (F) Visualization of LDs by LipidTOX staining and LD marker GFP::DGAT-2. White arrows indicate LDs. (G) Quantification of LD diameter from F. Data are presented as the mean ± SD of six representative animals for each worm strain. (H) Representative images of the ER morphology indicated by mCherry::HDEL. White arrows indicated the aggregation of the ER. (I and J) Localization of DHS-3::GFP and GFP::DGAT-2 with respect to LDs. LDs stained by LipidTOX Red (I), and lysosome was stained by Lyso tracker (J). White arrows indicate LDs. (K) Localization of DHS-3::GFP with respect to LDs stained by LipidTOX. White arrows indicate the localization of DHS-3::GFP on LDs. (L) Localization of DHS-3::GFP with respect to ER marked by mCherry::HDEL. White arrows indicate the localization of DHS-3::GFP on LDs. The scale bar represents 5 µm. (M) Intensity profiles of labeled scans from high-magnification regions, L-1, L-2, and L-3, show the localization of DHS-3::GFP with mCherry::HDEL found in L. (N) Localization of GFP::DGAT-2 on LDs. Lysosome was stained by Lyso tracker. White arrows indicate LDs. (O) Intensity profiles of labeled scans from high-magnification regions, N-1, N-2, and N-3, show the localization of GFP::DGAT-2 with Lyso tracker found in N. (P) Localization of GFP::DGAT-2 with respect to LDs stained by LipidTOX. White arrows indicate the localization of GFP::DGAT-2 on LDs. Significant difference between Con and RNAi, ***P < 0.001, significant difference between two indicated worms, ##P < 0.01, ###P < 0.001, the P values are indicated by two-tailed t test (E) and one-way ANOVA (B, C, and G). All fluorescence images were captured by high-resolution laser confocal microscopy (ZEISS, Carl LSM800), except D. For all of the represented animals, the anterior is on the left and the posterior is on the right. Scale bar represents 1 μm in enlarged panels and 5 μm in others, respectively, unless specifically indicated.
Figure 4.
Figure 4.
Dietary supplementation of C17iso and/or C18:1(n-9) had no effects on let-767 deficiency worms. (A) Localization of GFP::DGAT-2 in Con and let-767RNAi worms supplemented with C17iso and/or C18:1(n-9). White arrows indicate LDs and yellow arrows indicate the localization of GFP::DGAT-2 on lysosome. (B) LipidTOX staining of LDs in fixed worms. White arrows indicate LDs. (C) Quantification of LD diameter from B. Data are presented as the mean ± SD of six representative animals for each worm strain. Significant difference between WT and an indicated worm strain, ***P < 0.001 by one way ANOVA; ns, no significance. (D) The growth and development analysis of let-767RNAi or let-767(gk553841) worms supplemented with C17iso and/or C18:1(n-9) at 72 h. Scale bar represents 5 mm. (E) Representative images of ER morphology indicated by mCherry::HDEL in let-767RNAi worms under treatment of dietary C17iso and/or C18:1(n-9). Yellow arrows indicate the aggregation of the ER. The white dashed lines indicate the worm boundaries. All fluorescence images were captured by high-resolution laser confocal microscopy (ZEISS, Carl LSM800). For all of the represented animals, the anterior is on the left and the posterior is on the right. Scale bar represents 5 μm, unless specifically indicated.
Figure 5.
Figure 5.
LET-767 antagonizes ATGL-1 to regulate LD protein targeting and lipid homeostasis. (A) Kyoto Encyclopedia of Genes and Genomes pathway enrichment analysis of WT worms treated with Con and let-767RNAi. The data was analyzed by DAVID v6.8. Blue columns indicate downregulation, and the red columns indicate upregulation. DEG, differentially expressed genes. (B) Heat map of lipogenesis genes and lipolysis genes from A. (C and D) Relative mRNA level of selected lipogenesis genes (C) and lipolysis genes (D). Data are presented as the mean ± SD of four biological repeats for each worm strain. Significant difference between Con and let-767RNAi, *P < 0.5, ***P < 0.001 by two-tailed t test. (E) Relative mRNA level of atgl-1 in let-767(gk553841) mutant worm. Data are presented as the mean ± SD of four biological repeats for each worm strain. Significant difference between WT and let-767(gk553841) worms, ***P < 0.001 by two-tailed t test. (F) Fluorescence intensity (left) and quantification (right) of ATGL-1::GFP. Scale bar represents 100 μm. Images were taken by ZEISS Axio Imager M2. (G) Top: Western blot analysis of ATGL-1::GFP using anti-GFP antibody. Bottom: Quantification of ATGL-1::GFP. Data were normalized to the internal Con β-ACTIN. Data are presented as the mean ± SD of three biological repeats for each worm strain. Significant difference between Con and let-767RNAi, ***P < 0.001 by two-tailed t test. (H) Localization of ATGL-1::GFP with respect to LDs stained by LipidTOX. White arrows indicate LD and yellow arrows indicate the localization of ATGL-1::GFP on LDs. (I) Quantification of ATGL-1::GFP LD localization from H. (F and I) Statistical difference between Con and let-767RNAi, ***P < 0.001 by two-tailed t test. (J) LipidTOX staining of LDs in fixed worms. White arrows indicate LDs. (K) Quantification of LD diameter from J. Data are presented as mean ± SD of six representative animals for each worm strain. (L) Localization of GFP::DGAT-2 with respect to lysosome stained by Lyso tracker. White arrows indicate LDs and yellow arrows indicate the localization of GFP::DGAT-2 on lysosome. (M) Quantification of GFP::DGAT-2 LD localization from L. (K and M) Significant difference between WT and an indicated worm strain, ***P < 0.001, significant difference between two indicated worm strains, ###P < 0.001, the P values are indicated by one-way ANOVA. (N) Left: Localization of DHS-3::GFP with respect to ER marked by mCherry::HDEL. White arrows indicate LDs and yellow arrows indicate the localization of DHS-3::GFP on ER. Right: Intensity profiles of labeled scans from high-magnification regions, N-1, N-2 and N-3, show the localization of DHS-3::mCherry found in left. n, the number of measured worms for each worm strain. All fluorescence images were captured by high-resolution laser confocal microscopy (ZEISS, Carl LSM800), except F. For all of the represented animals, the anterior is on the left and the posterior is on the right. The scale bar represents 1 μm in enlarged panels and 5 μm in others, respectively, unless specifically indicated. Source data are available for this figure: SourceData F5.
Figure S3.
Figure S3.
LET-767 deficiency–caused LD protein displacement was not due to activated lysosome. (A) Localization of GFP::DGAT-2 with respect to lysosome marked by LMP-1::mCherry. White arrows and yellow arrows indicate the localization of GFP::DGAT-2 on LDs and lysosome, respectively. (B) Visualization of the lysosome marker by LMP-1::GFP treated with 40 μM Bafilomycin A1 (Baf). Red arrows indicate lysosome. (C) Localization of GFP::DGAT-2 with respect to lysosome stained by Lyso tracker. White arrows indicate the localization of GFP::DGAT-2 on LDs, and yellow arrows indicate the localization of GFP::DGAT-2 on lysosome. (D) LipidTOX staining of LDs in fixed worms with/without Baf treatment. White arrows indicate LDs. (E) Relative mRNA level of atgl-1 by qPCR analysis. (F and G) Fluorescence intensity (left) and quantification (right) of ATGL-1::GFP (F) and LET-767::GFP (G), respectively. Scale bar represents 100 μm. Data are presented as the mean ± SD. n, the number of measured worms for each worm strain. (H) Left: Western blot analysis of LET-767::GFP using anti-GFP antibody. Right: Quantification of LET-767::GFP normalized by β-ACTIN as an internal Con. (E and H) Data are presented as the mean ± SD of three biological repeats for each worm strain. (I) Localization of LET-767::GFP to LDs stained by LipidTOX. White arrows indicate LET-767::GFP on LDs. (J and K) LipidTOX staining (J) and quantification (K) of LDs in fixed worms. Data are presented as the mean ± SD of six representative animals for each worm strain. Significant difference between Con and an indicated RNAi or between WT and mutant, **P < 0.01, ***P < 0.001. ns, no significance. The P values are indicated by two-tailed t-test (E–H) and one-way ANOVA (K). All fluorescence images were captured by high-resolution laser confocal microscopy (ZEISS, Carl LSM800), except F and G taken by ZEISS Axio Imager M2 microscopy. Scale bar represents 1 μm in enlarged panels and 5 μm in others, respectively, unless specifically indicated. Source data are available for this figure: SourceData FS3.
Figure S4.
Figure S4.
LET-767::GFP IP-MS and ARF-1::RFP expression. (A) Identification of LET-767::GFP interaction partners for MS via SDS-PAGE silver staining. (B) List of several LET-767 interacting proteins from IP-MS data. (C) Heat map of genes involved in COPI/vesicle-mediated transport pathway from RNA-Seq data. (D) Nile Red staining (taken by ZEISS Axio Imager M2 microscopy) and LipidTOX staining (taken by high-resolution laser confocal microscopy ZEISS LSM800) of LDs in fixed worms. Scale bar represents 10 μm. (E) Quantification of LD diameters from D. Data are presented as the mean ± SD of six representative animals for each worm strain. (F) Confocal microscopy of ARF-1::RFP. Scale bar represents 100 μm on the top panel, 20 μm for the left panel, and 10 μm for right panel. I, intestine; H, hypodermis. (G and H) Fluorescence intensity (G) and quantification (H) of ARF-1::RFP. Scale bar represents 200 μm. Images were taken by ZEISS Axio Imager M2 microscopy. Data are presented as the mean ± SD. n, the number of measured worms for each worm strain. (I) Localization of ARF-1::RFP with respect to LD marker GFP::DGAT-2, DHS-3::GFP, and LipidTOX staining LDs. Scale bars in merged and enlarged panels represent 5 and 1 μm, respectively. White arrows indicate LDs. (J) Localization of ARF-1::RFP with respect to GFP::SP12. Scale bars in merged and enlarged panels represent 5 and 1 μm, respectively. Yellow arrow indicates overlapped ARF-1::RFP with GFP::SP12. Significant difference between Con and a specific RNAi, ***P < 0.001, significant difference between two indicated worm strains, ###P < 0.001. ns, no significance; the P values are indicated by two-tailed t test (H) and one-way ANOVA (E). Images in F, I, and J were taken by high-resolution laser confocal microscopy (ZEISS, Carl LSM800). Source data are available for this figure: SourceData FS4.
Figure 6.
Figure 6.
LET-767 interacts with ARF-1 to ensure proper LD protein targeting. (A and C) LipidTOX staining of LDs in fixed worms. (B and D) Quantification of LD diameter from A and C, respectively. Data are presented as the mean ± SD of six representative animals for each worm strain. (E) Lipid contents were measured by TLC/GC and presented as % TAG in total lipids (TAG+PL). Data are presented as the mean ± SD of three biological repeats for each worm strain. (F) Localization of ARF-1::RFP with LET-767::GFP truncations. Yellow arrows indicate the overlapped ARF-1::RFP with LET-767::GFP. (G) Co-IP showed that ARF-1 interacts with LET-767 truncations detected by anti-FLAG or anti-GFP antibody. IB, immunoblot. (H) Localization of GFP::DGAT-2 with respect to LD stained by Lyso tracker. White arrows indicate LDs and yellow arrows indicate the localization of GFP::DGAT-2 on lysosome. (I) Quantification of GFP::DGAT-2 LD localization from H. n = 7 for each worm strain and presented as the mean ± SD. (J) Localization of DHS-3::GFP with respect to ER marked by mCherry::HDEL. White arrows indicate LDs and yellow arrows indicate the localization of DHS-3::GFP on ER. (K) Quantification of DHS-3::GFP LD localization from J. Significant difference between WT and an indicated worm strain, ***P < 0.001, significant difference between two indicated worms, ###P < 0.001, the P values are indicated by one-way ANOVA. All fluorescence images were captured by high-resolution laser confocal microscopy (ZEISS, Carl LSM800). For all of the represented animals, the anterior is on the left and the posterior is on the right. Scale bar represents 1 μm in enlarged panels and 5 μm in others, respectively, unless specifically indicated. Source data are available for this figure: SourceData F6.
Figure S5.
Figure S5.
RNAi reduction of fat-6 and acs-1 did not affect the localization of ARF-1::RFP and ATGL-1::GFP. (A) Fluorescence intensity (left) and quantification (right) of ARF-1::RFP in Con and let-767RNAi. Scale bar represents 100 μm. (B and C) Fluorescence intensity (B) and quantification (C) of LET-767::GFP in Con and arf-1RNAi. Scale bar represents 100 μm. (D) Localization of LET-767::GFP on LDs stained by LipidTOX. White arrows indicate LDs and yellow arrows indicate the localization of LET-767::GFP on LDs. (E) Fluorescence intensity (left) and quantification (right) of ATGL-1::GFP. The scale bar represents 100 μm. (F) Localization of ATGL-1::GFP with respect to LDs stained by LipidTOX. White arrows indicate the localization of ATGL-1::GFP on LDs. (G) Fluorescence intensity (left) and quantification (right) of ARF-1::RFP. Scale bar represents 100 μm. (H) Localization of ARF-1::RFP with respect to LDs stained by LipidTOX (green). White arrows indicate LipidTOX (green) -stained LDs. Data are presented as the mean ± SD. n, the number of measured worms for each worm strain. Significant difference between Con and a specific RNAi, ***P < 0.001, ns, no significance, the P values are indicated by two-tailed t test (A and C) and one-way ANOVA (E and G). All fluorescence images were captured by high-resolution laser confocal microscopy (ZEISS, Carl LSM800), with the exception of A, B, E, and G taken by ZEISS Axio Imager M2 microscopy. Scale bar represents 1 μm in enlarged panels and 5 μm in others, respectively, unless specifically indicated.
Figure 7.
Figure 7.
ARF-1 recruits ATGL-1 for their LD translocation. (A) Left: Localization of ARF-1::RFP with respect to LDs stained by LipidTOX (green). White arrows indicate LDs and yellow arrows indicate the localization of ARF-1::RFP on LDs. Right: Quantification of the colocalization of ARF-1::RFP with LipidTOX (green). (B) Left: Colocalization of ATGL-1::GFP with ARF-1::RFP, indicated by yellow arrows. Right: Quantification of the colocalization of ATGL-1::GFP and ARF-1::RFP. (A and B) Significant difference between Con and let-767RNAi, ***P < 0.001 by two-tailed t test. (C) Co-IP showed that ARF-1 directly interacts with ATGL-1 detected by anti-FLAG or anti-GFP antibody. IB, immunoblot. Blue arrow indicates the target band. (D) Fluorescence intensity (left) and quantification (right) of ATGL-1::GFP. Scale bar represents 100 μm. Images were taken by ZEISS Axio Imager M2. (E) Western blot of ATGL-1::GFP detected by anti-GFP antibody and its quantification by normalization to the internalized Con β-ACTIN. Data are presented from two biological repeats for each worm strain. (F) Localization of ATGL-1::GFP with respect to LDs stained by LipidTOX. White arrows indicate LDs and yellow arrows indicate the localization of ATGL-1::GFP on LDs. (G) Quantification of ATGL-1::GFP LD localization from F. (D and G) Significant difference between Con and RNAi, ***P < 0.001, significant difference between two indicated worm strains, ##P < 0.01, ###P < 0.001, the P values are indicated by one-way ANOVA. Data are presented as the mean ± SD, n, the number of measured worms for each worm strain. All fluorescence images were captured by high-resolution laser confocal microscopy (ZEISS, Carl LSM800), except D. For all of the represented animals, the anterior is on the left and the posterior is on the right, except A is the opposite. Scale bar represents 1 μm in enlarged panels and 5 μm in others, respectively, unless specifically indicated. Source data are available for this figure: SourceData F7.
Figure 8.
Figure 8.
A working model of LET-767 required for LD protein targeting. Under normal condition (left panel), LET-767 presents in the ER and LDs, where it interacts with ARF-1 to prevent ARF-1 LD translocation and recruitment of ATGL-1, thereby maintaining appropriate lipid homeostasis and LD translocation of LD proteins DHS-3, PLIN-1, and DGAT-2. Under LET-767 deficiency (right panel), ARF-1 is released, and it recruits ATGL-1 to the LDs for lipolysis, which may reversely inhibit the targeting of DHS-3, PLIN-1, DGAT-2 to the LDs. LET-767 deficiency also alters ER morphology.

Similar articles

Cited by

References

    1. Bartz, R., Li W.H., Venables B., Zehmer J.K., Roth M.R., Welti R., Anderson R.G.W., Liu P., and Chapman K.D.. 2007. Lipidomics reveals that adiposomes store ether lipids and mediate phospholipid traffic. J. Lipid Res. 48:837–847. 10.1194/jlr.M600413-JLR200 - DOI - PubMed
    1. Beller, M., Sztalryd C., Southall N., Bell M., Jäckle H., Auld D.S., and Oliver B.. 2008. COPI complex is a regulator of lipid homeostasis. PLoS Biol. 6:e292. 10.1371/journal.pbio.0060292 - DOI - PMC - PubMed
    1. Bersuker, K., and Olzmann J.A.. 2017. Establishing the lipid droplet proteome: Mechanisms of lipid droplet protein targeting and degradation. Biochim. Biophys. Acta Mol. Cell Biol. Lipids. 1862:1166–1177. 10.1016/j.bbalip.2017.06.006 - DOI - PMC - PubMed
    1. Blanchette-Mackie, E.J., Dwyer N.K., Barber T., Coxey R.A., Takeda T., Rondinone C.M., Theodorakis J.L., Greenberg A.S., and Londos C.. 1995. Perilipin is located on the surface layer of intracellular lipid droplets in adipocytes. J. Lipid Res. 36:1211–1226. 10.1016/S0022-2275(20)41129-0 - DOI - PubMed
    1. Brock, T.J., Browse J., and Watts J.L.. 2006. Genetic regulation of unsaturated fatty acid composition in C. elegans. PLoS Genet. 2. e108. 10.1371/journal.pgen.0020108 - DOI - PMC - PubMed

Publication types