. 2024 Jun 3;223(6):e202308080.
doi: 10.1083/jcb.202308080. Epub 2024 Mar 29.

Subpopulation commensalism promotes Rac1-dependent invasion of single cells via laminin-332

Affiliations

Subpopulation commensalism promotes Rac1-dependent invasion of single cells via laminin-332

Sung Bo Yoon et al. J Cell Biol. .

Abstract

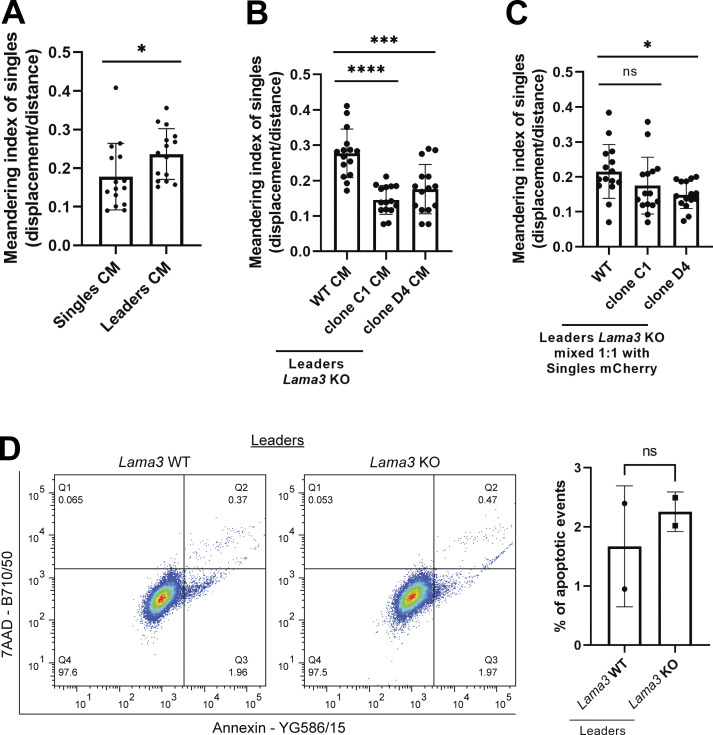
Phenotypic heterogeneity poses a significant hurdle for cancer treatment but is under-characterized in the context of tumor invasion. Amidst the range of phenotypic heterogeneity across solid tumor types, collectively invading cells and single cells have been extensively characterized as independent modes of invasion, but their intercellular interactions have rarely been explored. Here, we isolated collectively invading cells and single cells from the heterogeneous 4T1 cell line and observed extensive transcriptional and epigenetic diversity across these subpopulations. By integrating these datasets, we identified laminin-332 as a protein complex exclusively secreted by collectively invading cells. Live-cell imaging revealed that laminin-332 derived from collectively invading cells increased the velocity and directionality of single cells. Despite collectively invading and single cells having similar expression of the integrin α6β4 dimer, single cells demonstrated higher Rac1 activation upon laminin-332 binding to integrin α6β4. This mechanism suggests a novel commensal relationship between collectively invading and single cells, wherein collectively invading cells promote the invasive potential of single cells through a laminin-332/Rac1 axis.


Conflict of interest statement

Disclosures: The authors declare no competing interests exist.

Figures

Figure 1.
Figure 1.
Subpopulations derived from the invasively heterogeneous 4T1 cell line are morphologically distinct. (A) Schematic detailing the criteria by which leaders, followers, and singles would be identified and isolated via SaGA. (B) Brightfield image (10×) of a 3D 4T1 parental spheroid embedded in 3.0 mg/ml rat-tail collagen type I after 24 h. Select leaders, followers, and singles are encircled with red, blue, and green circles, respectively, and zoomed in. Scale bar, 50 μm. (C) Brightfield images of 4T1 parentals and purified leaders, followers, and singles in 2D (20×) and 3D culture (10×). Scale bar, 50 μm. (D) Protein levels of E-cadherin, N-cadherin, and P-cadherin in whole-cell lysates of 4T1 parentals, leaders, followers, and singles. Actin was used as a loading control. (E) Immunofluorescence images of E-cadherin on 3D spheroids of 4T1 parentals, leaders, followers, and singles at 1.25× zoom (left) and 5.0× zoom (right). Images were acquired at 10× magnification. Yellow in the overlay image denotes nuclei fluorescence emitted from H2B-Dendra2 and red denotes E-cadherin staining. Scale bar, 50 μm. For D and E, three biological replicates were performed. Source data are available for this figure: SourceData F1.
Figure S1.
Figure S1.
Human triple-negative breast cancer cell lines are invasively heterogeneous. (A) High magnification images (20× and 63×) of E-cadherin immunofluorescence on 3D spheroids of 4T1 leaders, followers, and singles. Green in the overlay image denotes nuclei fluorescence emitted from H2B-Dendra2 and red denotes E-cadherin staining. Scale bar, 50 µm. (B) Brightfield image of a SUM159 (10×) and HCC38 (20×) spheroid embedded in rat-tail collagen type I after 24 h invasion. Red circles denote collective chains and green circles denote single cells. Scale bar, 50 µm.
Figure 2.
Figure 2.
Collectively invading and single cells exhibit distinct transcriptional and epigenetic programs. (A) Heat maps from RNA sequencing data for each pair-wise comparison. Scale denotes z scores from log2-normalized expression counts of most DEGs. (B) Principal component (PC) analysis plot of leaders, followers, and singles based on RNA sequencing data (n = 3). (C) Volcano plots denoting DEGs for each pair-wise comparison. DEGs (small, unbordered red dots) were classified as gene transcripts with −Log10 P values of >1.3 (y-axis) and a log2 fold change difference of >2.0 or less than −2.0 (x-axis). Bordered red dots are select genes overexpressed in collectively invading cells and bordered green dots are select genes overexpressed in single cells. (D) Number of DEGs between each pair-wise comparison. (E) RNA counts for Cdh1, Cldn4, Tacstd2, Esrp1, Lama3, and Krt14 in leaders, followers, and singles (n = 3). (F) Heat map of mouse methylation beta values between leaders and singles and representation of the percentage of hypermethylated regions across all DMRs between leaders and singles. Scale on heat map denotes beta value difference values for each DMR. L-1, L-2, and L-3 denote three replicates of leaders and S-1, S-2, and S-3 denote three replicates of singles. (G) Annotation of DMRs in singles when compared to leaders. (H) Beta value comparison of CpG loci within the promoter region of Cdh1 (n = 7), Cldn4 (n = 4), Tacstd2 (n = 5), Esrp1 (n = 6), Lama3 (n = 7), and Krt14 (n = 3) between leaders and singles. For all panels: mean ± SEM is shown. Unless noted, n.s., no significance, **P ≤ 0.01, ***P ≤ 0.001, ****P ≤ 0.0001.
Figure 3.
Figure 3.
Collectively invading cells overexpress and abundantly secrete laminin-332. (A) Integration of RNA sequencing log2 fold change values (x-axis) and mouse methylation array beta difference values (y-axis) for the leaders (L) versus singles (S) pair-wise comparison. Lama3, Lamb3, and Lamc2 are highlighted as red dots among gene transcripts with high mRNA transcription in leaders and significant hypomethylation at the promoter region compared to singles. (B) Raw mRNA counts for gene transcripts of the laminin-332 subunits from RNA sequencing analysis (n = 3, ****P < 0.0001). (C) Volcano plot of the leaders versus singles pair-wise comparison derived from RNA sequencing data highlighting Lama3, Lamb3, and Lamc2 (bordered red dots) as prominent DEGs. (D) Beta value comparison of distinct CpG loci within the promoter regions of Lama3, Lamb3, and Lamc2 between leaders and singles. (E) Volcano plot of differentially secreted peptides extracted via LC-MS/MS from CM from leaders and singles. Red, unbordered dots denote peptides differentially secreted in leaders and green dots denote peptides differentially secreted in singles. (F) Label-free quantification (LFQ) intensity quantification of Lama3, Lamb3, and Lamc2 peptides. # denotes an absence of signal detected (n = 3, ****P < 0.0001). (G) Protein levels of laminin-332 in leaders CM and singles CM. Total protein staining via Ponceau S was used as a loading control. (H) Laminin-332 immunofluorescence (IF) staining on invasive leaders and singles in collagen I 3D culture (10× and 63×). Scale bar: 100 μm for 10× image, 20 μm for 63× image, and 10 μm for 63× zoomed image. For all panels: mean ± SEM is shown. For G and H, three biological replicates were performed. Source data are available for this figure: SourceData F3.
Figure S2.
Figure S2.
Fold change difference of laminin gene expression between leaders and singles. Positive values denote higher expression in leaders (L) relative to singles (S) and negative values denote higher expression in singles relative to leaders.
Figure 4.
Figure 4.
Laminin-332 enhances the invasive potential of singles. (A) Live-cell tracking analysis of singles spheroids after treating with singles CM or leaders CM for 24 h (n = 15). Representative five tracks highlighted for each group. Scale bar, 50 μm. (B) Protein levels of laminin-332 in CM extracted from leaders with WT Lama3, and Lama3 CRISPR/Cas9 KO (clones C1 and D4). Total protein staining via Ponceau S was used as a loading control. Brightfield images were acquired after 24 h. Scale bar, 50 μm. (C) Live-cell tracking analysis of singles spheroids after treating with CM from WT Lama3 leaders and Lama3 KO leaders (clones C1 and D4) (n = 15). Representative five tracks highlighted for each group. Scale bar, 50 μm. (D) Live-cell tracking analysis of mCherry-transfected singles within a spheroid mixed 1:1 with mCherry-transfected singles and either leaders WT, clone C1, or clone D4 (n = 15). Representative five tracks highlighted for each group. Scale bar, 50 μm. For all experiments, three biological replicates were performed. For all panels: mean ± SEM is shown. Px/t stands for pixels/time, and px stands for pixels. Unless noted, n.s., no significance, *P ≤ 0.05, **P ≤ 0.01, ****P ≤ 0.0001. Source data are available for this figure: SourceData F4.
Figure S3.
Figure S3.
Lama3 KO does not affect leader cell viability and suppresses directional movement of single cells. (A–C) Meandering index quantification for singles (A) treated with leader or singles CM, (B) Lama3 KO leaders CM, and (C) mixed 1:1 with Lama3 KO leaders (n = 15). (D) Quantification of apoptotic events on leaders with Lama3 WT and KO (n = 2). For all panels: mean ± SEM is shown. Unless noted, ns, no significance, *P ≤ 0.05, ***P ≤ 0.001, ****P ≤ 0.0001.
Figure 5.
Figure 5.
Singles activate Rac1 activity via binding of integrin α6β4 to leader-derived laminin-332. (A) Log2 fold change of integrin subunits expressed in leaders (L) and singles (S) within the RNA sequencing data. Positive values denote gene transcripts that were upregulated in singles relative to leaders. Red arrows highlight Itga6 and Itgb4 as being upregulated in singles and blue arrows highlight Itga3 and Itgb1 as being downregulated in singles. (B) RNA counts for Itga6 and Itgb4 in leaders and singles (n = 3). (C) Protein levels of integrin α6 and β4 in whole-cell lysates of leaders and singles. Actin was used as a loading control. (D) Relative Rac1 activity of leaders and singles upon direct interaction with 1 μg/cm2 laminin-332 for 5 min (n = 3). (E) Time course measurement of relative Rac1 activity in leaders and singles upon leader CM treatment (n = 3). (F) Time course measurement of relative Rac1 activity in singles upon treatment with CM from leaders Lama3 WT and two distinct leaders with Lama3 KO (clone C1 and clone D4) (n = 3). Statistical annotation only applies for the 10-min time points. (G) Relative Rac1 activity of singles upon treatment with Lama3 WT or Lama3 KO CM with a laminin-332 antibody (1:1,000 dilution) (n = 3). Laminin-332 antibody was mixed in with CM for 30 min prior to treatment. Rac1 activity of cells was measured after 5 min treatment with CM. (H) Protein levels of integrin α6 and total Rac1 upon Itga6 shRNA knockdown in singles. Actin was used as a loading control. (I) Relative Rac1 activity in singles with Itga6 shRNA knockdown (shItga6) upon treatment with CM from leaders Lama3 WT and leaders Lama3 KO. Rac1 activity was measured after 1 h treatment with CM (n = 3). For C–I, three biological replicates were performed. For all panels: mean ± SEM is shown. Unless noted, n.s., no significance, **P ≤ 0.01, ***P ≤ 0.001, ****P ≤ 0.0001. Source data are available for this figure: SourceData F5.
Figure S4.
Figure S4.
EGF activates Rac1 in single cells and not collectively invading cells. (A) Flow cytometric surface protein quantification of integrin α6 (Itga6) in leaders and singles. Dotted line denotes the unstained sample for each subpopulation. (B) Time course measurement of relative Rac1 activity in leaders and singles upon 50 ng/ml hEGF treatment (n = 3, ***P < 0.001, ****P < 0.0001). Mean ± SEM is shown. (C) Volcano plot of differentially secreted peptides extracted via LC-MS/MS from CM from leaders with Lama3 WT and KO (n = 3). Red circles denote peptides differentially secreted in Lama3 WT leaders and green circles denote peptides differentially secreted in Lama3 KO leaders (|Student’s T test Difference| >1, P value <0.05).

Comment in

Similar articles

Cited by

References

    1. Aceto, N., Bardia A., Miyamoto D.T., Donaldson M.C., Wittner B.S., Spencer J.A., Yu M., Pely A., Engstrom A., Zhu H., et al. . 2014. Circulating tumor cell clusters are oligoclonal precursors of breast cancer metastasis. Cell. 158:1110–1122. 10.1016/j.cell.2014.07.013 - DOI - PMC - PubMed
    1. Alvarez-Elizondo, M.B., and Weihs D.. 2022. Breast cancer stem cells: Mechanobiology reveals highly invasive cancer cell subpopulations. Cell. Mol. Life Sci. 79:134. 10.1007/s00018-022-04181-w - DOI - PMC - PubMed
    1. Anders, S., McCarthy D.J., Chen Y., Okoniewski M., Smyth G.K., Huber W., and Robinson M.D.. 2013. Count-based differential expression analysis of RNA sequencing data using R and Bioconductor. Nat. Protoc. 8:1765–1786. 10.1038/nprot.2013.099 - DOI - PubMed
    1. Anders, S., Pyl P.T., and Huber W.. 2015. HTSeq--a Python framework to work with high-throughput sequencing data. Bioinformatics. 31:166–169. 10.1093/bioinformatics/btu638 - DOI - PMC - PubMed
    1. Aryee, M.J., Jaffe A.E., Corrada-Bravo H., Ladd-Acosta C., Feinberg A.P., Hansen K.D., and Irizarry R.A.. 2014. Minfi: A flexible and comprehensive bioconductor package for the analysis of Infinium DNA methylation microarrays. Bioinformatics. 30:1363–1369. 10.1093/bioinformatics/btu049 - DOI - PMC - PubMed

Publication types