. 2024 Jun 20;143(25):2612-2626.
doi: 10.1182/blood.2023022777.

Loss of GABARAP mediates resistance to immunogenic chemotherapy in multiple myeloma

Affiliations

Loss of GABARAP mediates resistance to immunogenic chemotherapy in multiple myeloma

Annamaria Gulla et al. Blood. .

Abstract

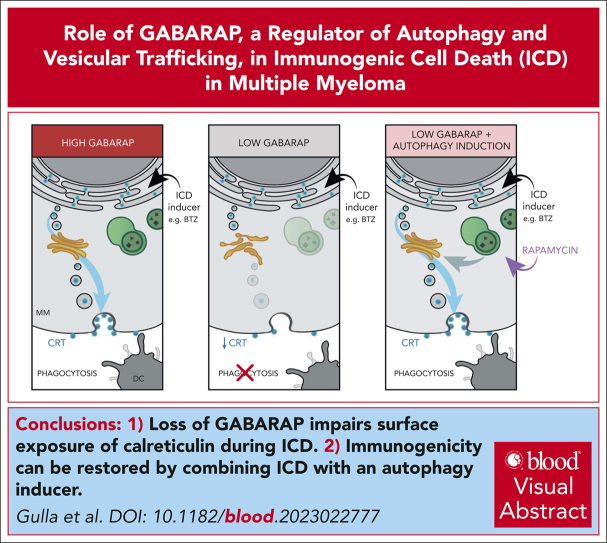
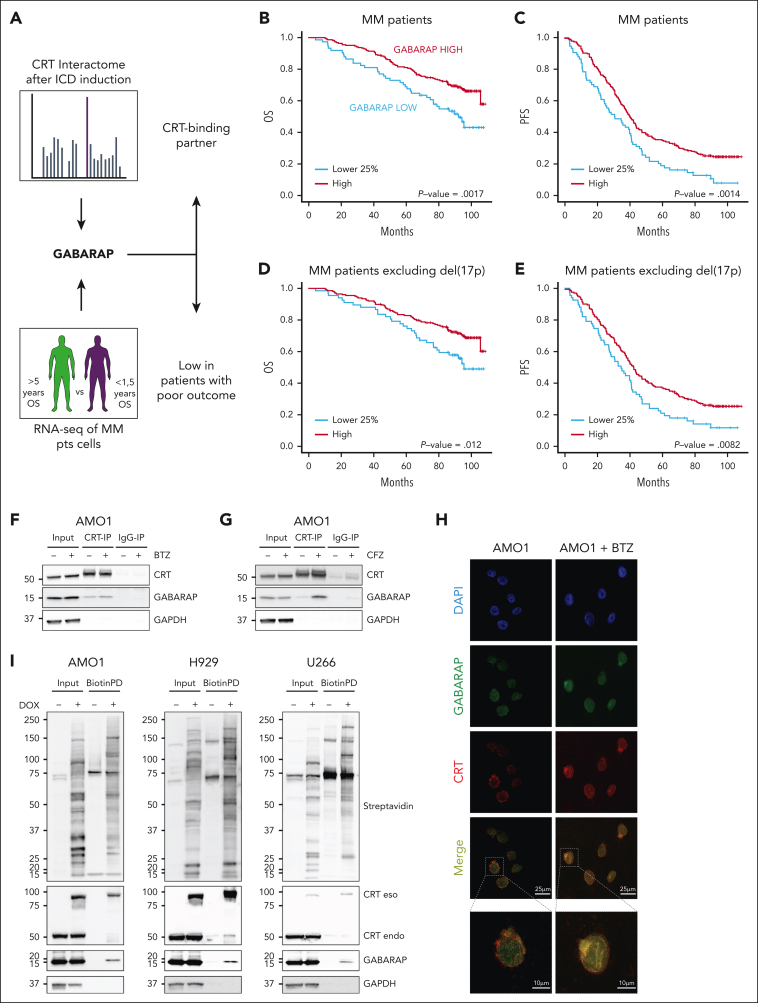
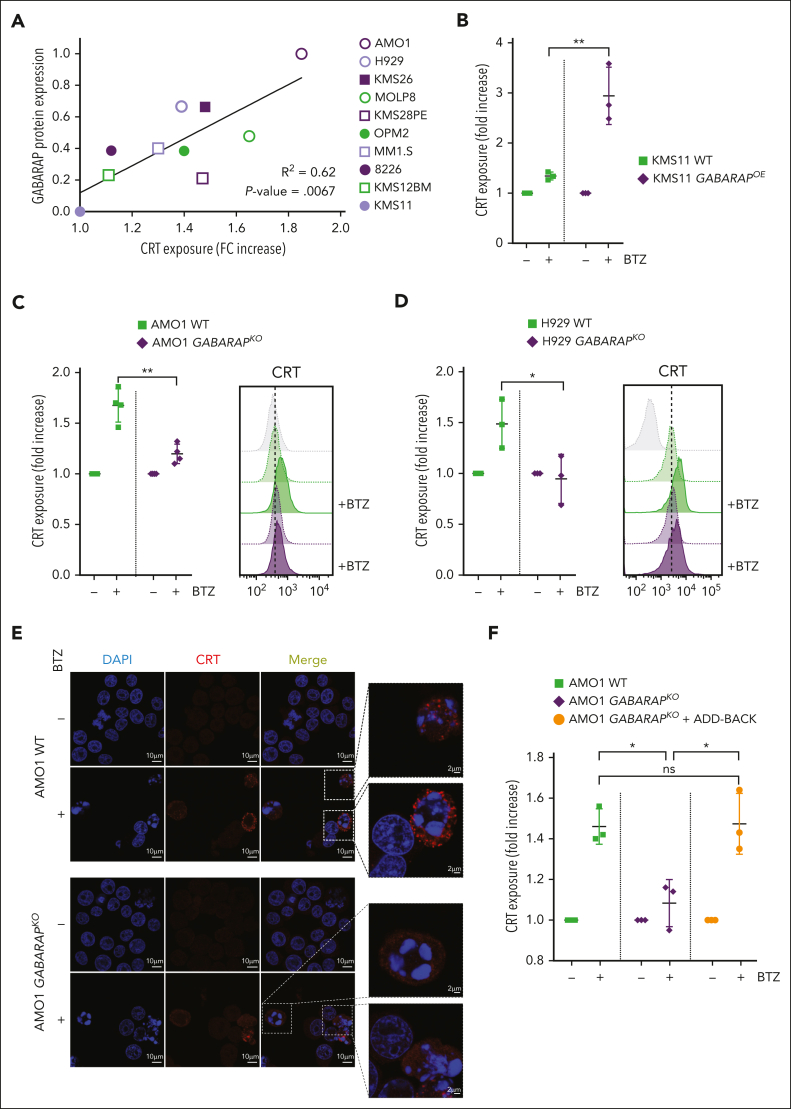
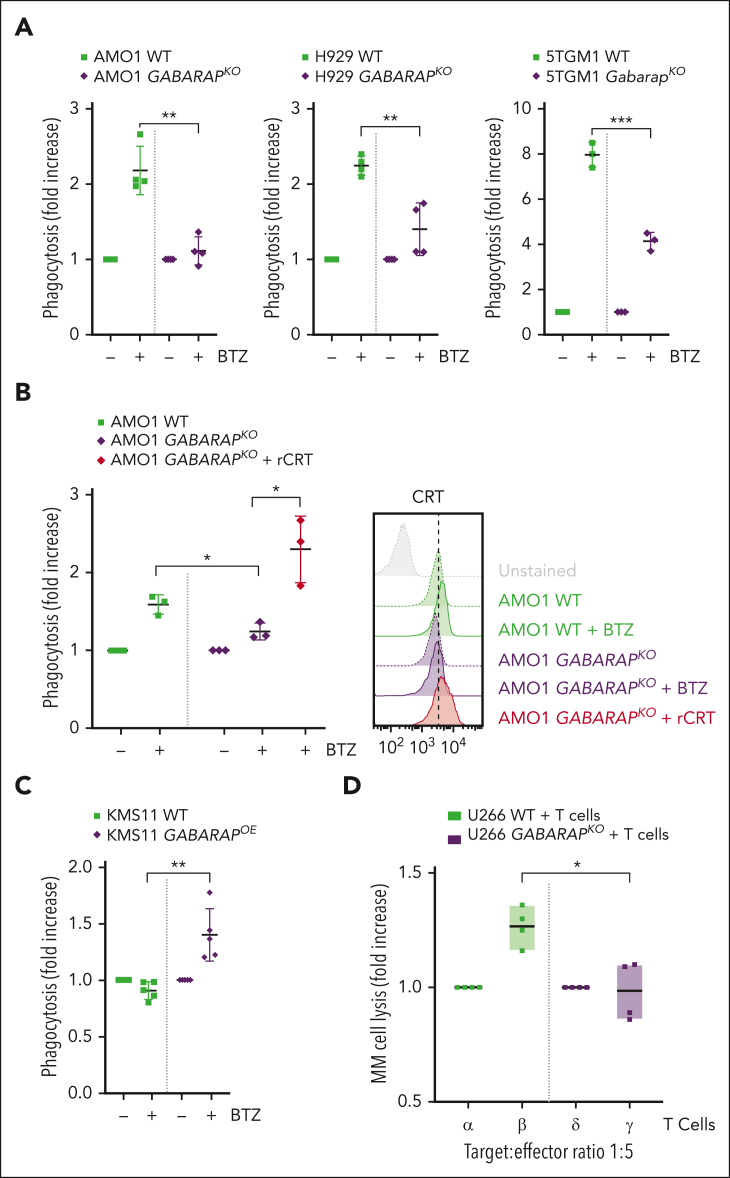
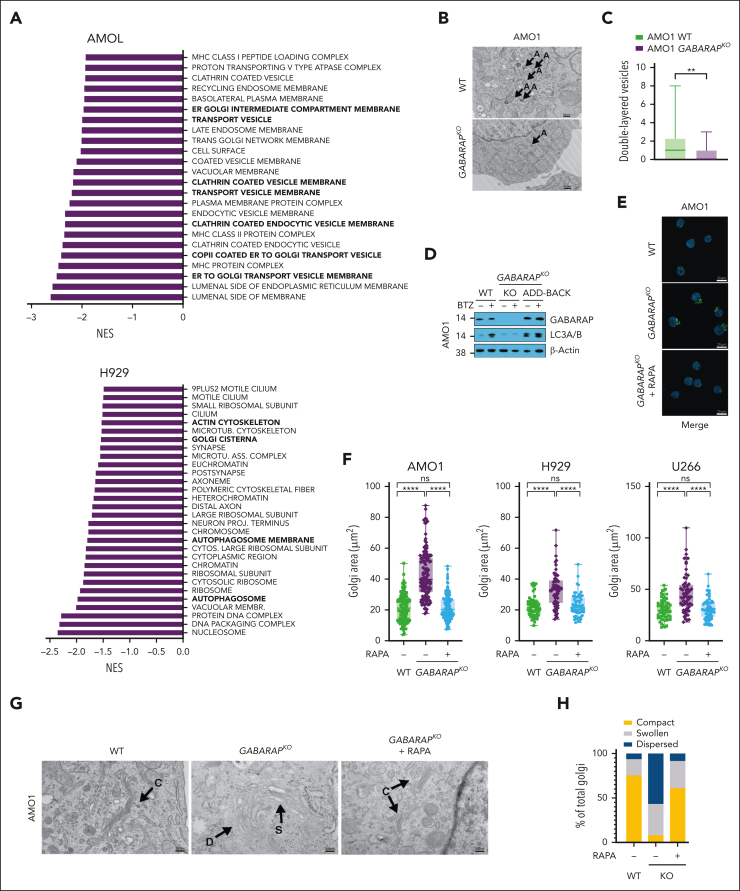
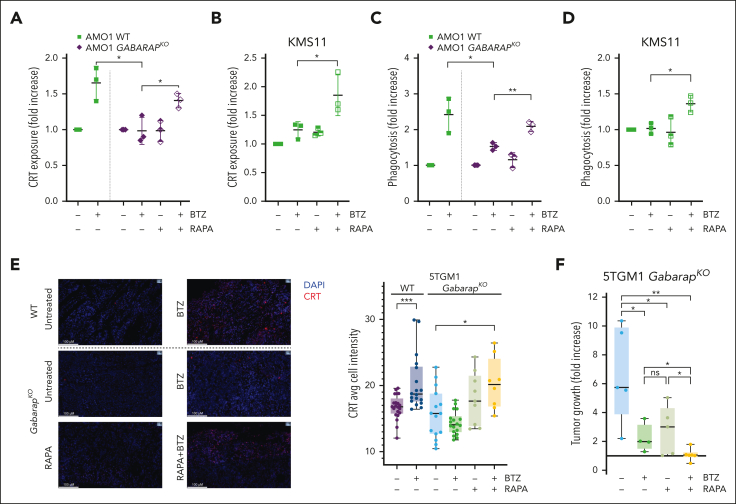
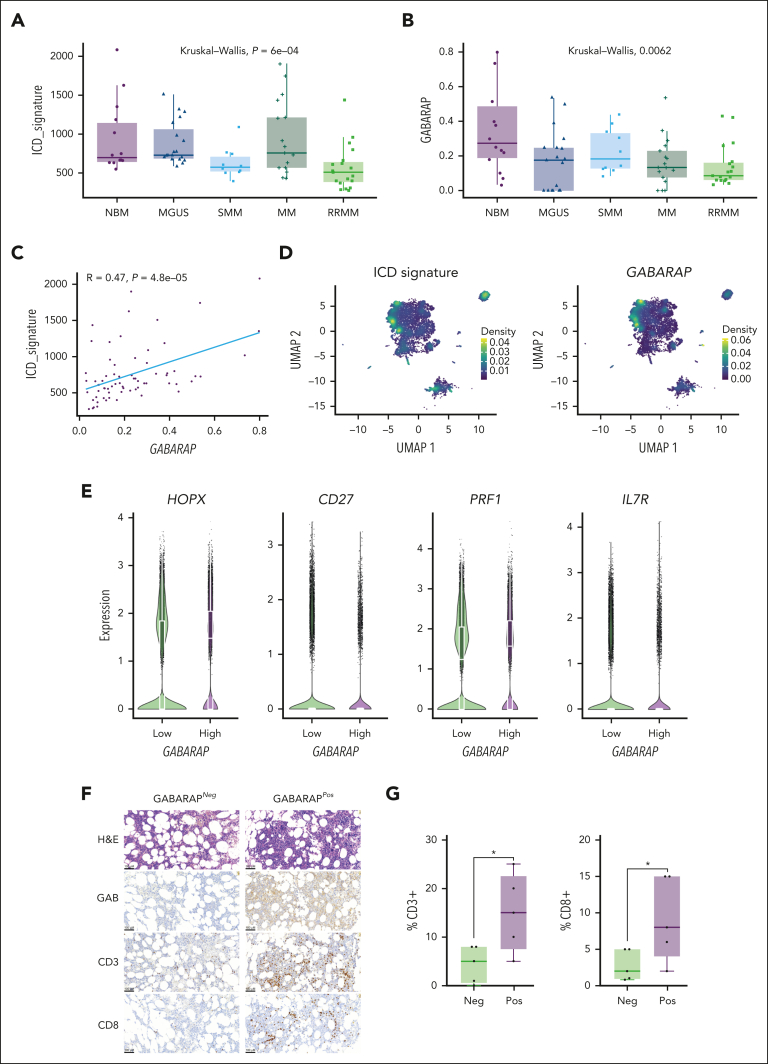
Immunogenic cell death (ICD) is a form of cell death by which cancer treatments can induce a clinically relevant antitumor immune response in a broad range of cancers. In multiple myeloma (MM), the proteasome inhibitor bortezomib is an ICD inducer and creates durable therapeutic responses in patients. However, eventual relapse and resistance to bortezomib appear inevitable. Here, by integrating patient transcriptomic data with an analysis of calreticulin (CRT) protein interactors, we found that GABA type A receptor-associated protein (GABARAP) is a key player whose loss prevented tumor cell death from being perceived as immunogenic after bortezomib treatment. GABARAP is located on chromosome 17p, which is commonly deleted in patients with high risk MM. GABARAP deletion impaired the exposure of the eat-me signal CRT on the surface of dying MM cells in vitro and in vivo, thus reducing tumor cell phagocytosis by dendritic cells and the subsequent antitumor T-cell response. Low GABARAP was independently associated with shorter survival in patients with MM and reduced tumor immune infiltration. Mechanistically, we found that GABARAP deletion blocked ICD signaling by decreasing autophagy and altering Golgi apparatus morphology, with consequent defects in the downstream vesicular transport of CRT. Conversely, upregulating autophagy using rapamycin restored Golgi morphology, CRT exposure, and ICD signaling in GABARAPKO cells undergoing bortezomib treatment. Therefore, coupling an ICD inducer, such as bortezomib, with an autophagy inducer, such as rapamycin, may improve patient outcomes in MM, in which low GABARAP in the form of del(17p) is common and leads to worse outcomes.


Conflict of interest statement

Conflict-of-interest disclosure: N.C.M. serves on advisory boards of and as consultant to Takeda, Bristol Myers Squibb, Celgene, Janssen, Amgen, AbbVie, Oncopep, Karyopharm, Adaptive Biotechnology, and Novartis; and holds equity ownership in Oncopep. K.C.A. is a consultant for Janssen, Pfizer, and AstraZeneca; and serves as a board member with equity ownership in Oncopep, C4Therapeutics, Starton, NextRNA, Window, and Dynamic Cell Therapies. A.G. and K.C.A filed a provisional patent on the role of GABARAP as modulator of ICD. M.K.S. is a consultant for AbbVie and serves as advisor for Neuberg Center for Genomic Medicine. G.B. is a consultant for Prothena. D.C. has equity ownership in C4 Therapeutics outside the submitted work. The remaining authors declare no competing financial interests.

Figures

None
Graphical abstract
Figure 1.
Figure 1.
GABARAP is a clinically relevant binding partner of CRT. (A) Schematic representation of the analysis combining proteomic and transcriptomic data. (B-C) Prognostic relevance (overall survival [OS] [B] or progression-free survival [PFS] [C]) of low GABARAP level estimated in patients enrolled in the IFM/DFCI. P value was calculated with a log-rank test. (D-E) Same analysis as in panels B and C but excluding patients from the IFM/DFCI carrying 17p deletion. P value was calculated with a log-rank test. (F-G) Immunoblot of GABARAP, CRT, and glyceraldehyde-3-phosphate dehydrogenase (GAPDH) on total protein lysates or proteins bound to CRT or Immunoglobulin G isotype control in AMO1 cells untreated or treated with BTZ (5 nM; 10 hours) (F) or CFZ (10 nM, 16 hours) (G). (H) Representative confocal images of coimmunofluorescence of intracellular staining of GABARAP (green) and CRT (red) in AMO1 WT cells untreated or treated with BTZ (5 nM; 10 hours). DAPI (4′,6-diamidino-2-phenylindole) was used to stain nuclei. An enlargement of the squared area shows colocalization with yellow fluorescence due to colocalizing signals; scale bars, 25 μm; enlargement scale bar, 10 μm. (I) Immunoblot of GABARAP, CRT, streptavidin, and GAPDH on total protein lysates and biotin pull-down proteins before and after doxycycline treatment (1 μg/mL; 24 hours) in AMO1, H929, and U266 CRT-3xHA-TurboID cells.
Figure 2.
Figure 2.
Loss of GABARAP abrogates CRT exposure during ICD. (A) Correlation between CRT exposure and GABARAP protein expression in a panel of 10 MM cell lines. The surface exposure of CRT was determined by flow cytometry on viable cells after 16 hours of treatment of different cell lines, according to their BTZ sensitivity. Fold change of CRT increase was correlated with abundance of GABARAP protein (as shown in supplemental Figure 2A). (B) Analysis of surface CRT exposure in KMS11 WT and GABARAPOE after treatment with BTZ (7.5 nM; 16 hours) by flow cytometry of viable cells. (C-D) Effect of BTZ treatment (16 hours) on the exposure of surface CRT in AMO1 (5 nM) (C) and H929 (2.5 nM) cells (D) both with WT and GABARAPKO as assessed by flow cytometry of viable cells (left). Representative overlay histogram (right) of surface CRT fluorescence (MFI) in AMO1 (C) and H929 (D). (E) Representative images of immunofluorescence staining of surface CRT (red) in nonpermeabilized AMO1 WT and GABARAPKO before and after treatment with BTZ. DAPI was used to stain nuclei; scale bars, 10 μm. Enlargement pictures of the squared area show CRT exposure on dying cells only in WT condition; scale bars, 2 μm. (F) Analysis of surface CRT exposure in AMO1 WT, GABARAPKO, and GABARAPKO in which GABARAP was re-expressed (GABARAPKO + add-back) after treatment with BTZ (5 nM; 16 hours) by flow cytometry of viable cells. For panels B-D,F, ∗P < .05; ∗∗P < .01. ns, not significant (unpaired Student t test).
Figure 3.
Figure 3.
Loss of GABARAP impairs ICD-induced phagocytosis and antitumor T-cell activation. (A) For phagocytosis assay, MM cells and DCs were prestained with different dyes (either far-red or carboxyfluorescein diacetate succinimidyl ester [CFSE]). Dye-stained AMO1, H929, and 5TGM1 cells either WT or GABARAPKO were left untreated or treated with BTZ (5, 2.5, and 7.5 nM, respectively) for 16 hours. Then, they were cocultured with dye-stained DCs. Analysis was performed after 4 hours. Shown in the graph is the fold increase in the percentage of double-positive DCs in treated cells compared with untreated cells, as assessed by flow cytometry. (B) Phagocytosis assay of BTZ-treated (5 nM; 16 hours) or -untreated stained AMO1 WT, GABARAPKO, and GABARAPKO with the addition of exogenous recombinant CRT (rCRT) cocultured with stained DCs for 4 hours. Fold increase in the percentage of double-positive DCs in treated cells compared with untreated cells is shown. Representative overlay histograms confirm the exposure of surface CRT in the different conditions (right), as assessed by flow cytometry. (C) Phagocytosis assay of BTZ-treated (7.5 nM; 16 hours) or -untreated stained KMS11 WT or GABARAPOE cocultured with stained DCs for 4 hours. Fold increase in the percentage of double-positive DCs in treated cells compared with untreated cells is shown. (D) BTZ-treated (16 hours) or -untreated U266 either WT or GABARAPKO cells were cocultured with HLA-matched DCs and T cells from the same healthy donors. After 5 days, T cells were negatively selected from all 4 coculture conditions (α, WT untreated; β, WT treated with BTZ, δ, GABARAPKO untreated; and γ, GABARAPKO treated with BTZ) and then cultured for 24 hours with new U266 cells at 1:5 target:effector (T:E) ratio, followed by 7-AAD staining and quantification of MM cell lysis by flow cytometry. Shown in the graph is the fold change increase of MM cell lysis induced by the T cells retrieved from the treated conditions versus the untreated ones. For panels A-D, ∗P < .05; ∗∗P < .01; ∗∗∗P < .001 (unpaired Student t test). GFP, green fluorescent protein.
Figure 4.
Figure 4.
Loss of GABARAP impairs autophagy induction and alters Golgi morphology. (A) AMO1 and H929 WT and GABARAPKO were subjected to proteomic analysis by multiplexed proteomics with mass spectrometry. Shown in panel A is the gene set enrichment analysis (GSEA) gene ontology cellular components (GOCC) that were significantly negatively enriched after GABARAP KO. (FDR <1% for AMO1 and FDR <25% for H929). (B-C) Analysis of autophagy in AMO1 WT and GABARAPKO cells by TEM. (B) Representative TEM images depicting Golgi morphology (A = double-layered vesicles); scale bars, 500 nm. (C) Histograms showing the number of double-layered vesicles as determined in a total of 30 images for AMO1 WT and 30 images for AMO1 GABARAPKO cells. (D) AMO1 WT, GABARAPKO, and GABARAPKO in which GABARAP was re-expressed (GABARAPKO + add-back) were left untreated or treated with BTZ (5 nM; 16 hours). Immunoblot of GABARAP and LC3A/B is shown. β-Actin was used as a loading control. (E) Representative confocal images of Golgi apparatus stained with GM-130 antibody (green) in AMO1 WT, GABARAPKO, and GABARAPKO treated with rapamycin (50 nM; 24 hours). DAPI was used to label nuclei. This merged figure is also reported as supplemental Figure 4L together with the ones of the single channels; scale bars, 20 μm. (F) Box plot showing the Golgi area (μm2) in the different conditions as determined in a total of 119 cells per condition for AMO1, 60 cells per condition for H929, and 60 cells per condition for U266. (G) Representative TEM images depicting Golgi morphology in AMO1 WT, GABARAPKO, and GABARAPKO treated with rapamycin (50 nM; 24 hours) (C = compact; D = dispersed; and S = swollen); scale bars, 500 nm. (H) Histogram showing the percentage of compact, swollen, and dispersed Golgi in each condition. Specifically, 61 Golgi were visible in 29 TEM images taken in AMO1 WT; 37 Golgi in 30 TEM images taken in AMO1 GABARAPKO; and 47 Golgi in 29 TEM images taken in AMO1 GABARAPKO treated with rapamycin. For panel C, ∗∗P < .01 based on the unpaired Student t test; for panel F, ∗∗∗∗P < .0001 Kruskal-Wallis test. RAPA, rapamycin.
Figure 5.
Figure 5.
Treatment with autophagy inducer restores CRT translocation after BTZ and in vivo drug efficacy. (A) Flow cytometry analysis of CRT exposure of AMO1 WT or GABARAPKO untreated or treated with BTZ (4 nM; 16 hours), rapamycin (100 nM; 24 hours) or a combination of both drugs. Fold increase as compared with untreated cells is shown. (B) Fold increase of CRT levels on surface of KMS11 cells untreated or treated with BTZ (6 nM; 16 hours), rapamycin (500 nM; 24 hours) or a combination of both drugs. (C) Phagocytosis assay of AMO1 WT or GABARAPKO untreated or pretreated with BTZ (4 nM; 16 hours), rapamycin (100 nM; 24 hours), or a combination of both drugs cocultured with far-red DCs for 4 hours. Shown is the fold increase of the percentage of double-positive DCs in treated conditions compared with untreated cells. (D) Phagocytosis assay of CFSE-stained KMS11 untreated or pretreated with BTZ (6 nM; 16 hours), rapamycin (500 nM; 24 hours), or a combination of both drugs cocultured with far-red DCs for 4 hours. Shown is the fold increase of the percentage of double-positive DCs in treated conditions compared with untreated cells. (E) 5TGM1 WT or GabarapKO were subcutaneously injected in immunocompetent C57BL/KaLwRijHsd mice. When tumors became palpable, mice bearing WT tumors were randomized to receive either BTZ (1 mg/kg) or phosphate-buffered saline (PBS); whereas mice bearing GabarapKO tumors were randomized to receive: PBS, BTZ (1 mg/kg), rapamycin (4 mg/kg), or a combination of both drugs. Tumors were retrieved 48 hours after BTZ treatment or in the combination group, 48 hours after BTZ and 24 hours after rapamycin. CRT expression was detected by immunofluorescence. Representative images of tumors retrieved from the different groups (left) stained with CRT antibody (red). DAPI was used to label nuclei (blue); scale bars, 100 μm (63× magnification). Average of cell intensity of CRT signal is shown (right), as analyzed by the Halo software. The numbers of observations reported are as follow: WT - BTZ (21 sections from 7 tumors); WT+BTZ (18 sections from 6 tumors); GabarapKO – BTZ (15 sections from 5 tumors); GabarapKO + BTZ (18 sections from 6 tumors); GabarapKO + RAPA (9 sections from 3 tumors); and GabarapKO + RAPA + BTZ (8 sections from 2 tumors); the signal from each section is represented as a dot in the graph. (F) Fold increase of tumor growth from day 1 (start of treatment) of subcutaneous 5TGM1 GabarapKO xenografts in C57BL/KaLwRijHsd mice treated with PBS (n = 5), BTZ (1 mg/kg twice per week for 2 weeks; n = 4), rapamycin (4 mg/kg per day for 5 days; n = 5), or a combination of both drugs (n = 6) ± standard error of the mean (SEM) for each group is reported. For panels A-F, ∗P < .05; ∗∗P < .01; ∗∗∗P < .001 (unpaired Student t test). RAPA, rapamycin.
Figure 6.
Figure 6.
Tumor intrinsic GABARAP correlates with tumor immune infiltration in patients with MM. (A-B) Analysis of ICD signature (A) and GABARAP (B) expression on data aggregated per a total of 80 patients across MM disease stages (NBM, n = 15; MGUS, n = 19; SMM, n = 10 ; MM, n = 17; RRMM, n = 19)., , (C) Linear regression of GABARAP with ICD signature expression in the same patient cohort. (D) Uniform manifold approximation and projection (UMAP) plots of single-cell transcriptomic of 80 patients with MM showing the density of ICD signature (left) and GABARAP (right) expression on MM plasma cells. (E) Quantification of the expression of selected markers in CD8+ T cells significantly differentially expressed between patients with MM with low vs high intratumoral GABARAP expression (median as dichotomizing value). (F) Representative images of hematoxylin and eosin (H&E) and immunohistochemistry (IHC) analysis of GABARAP expression in plasma cells, and CD3 and CD8 staining of T cells from bone marrow biopsies from patients with MM; scale bars, 100 μm. (G) Statistical analysis of the percentage of CD3+ or CD8+ T cells in 10 patients with negative (neg; n = 5) or positive (pos; n = 5) staining for intratumoral GABARAP. For panels A-B, P values were calculated using the Kruskal-Wallis test. For panel G, ∗P < .05, unpaired Student t test. NBM, normal bone marrow; RRMM, relapsed/refractory MM; SMM, smoldering MM.

Comment in

Similar articles

Cited by

References

    1. Sistigu A, Yamazaki T, Vacchelli E, et al. Cancer cell-autonomous contribution of type I interferon signaling to the efficacy of chemotherapy. Nat Med. 2014;20(11):1301–1309. - PubMed
    1. Kroemer G, Galluzzi L, Kepp O, Zitvogel L. Immunogenic cell death in cancer therapy. Annu Rev Immunol. 2013;31:51–72. - PubMed
    1. Kroemer G, Galassi C, Zitvogel L, Galluzzi L. Immunogenic cell stress and death. Nat Immunol. 2022;23(4):487–500. - PubMed
    1. Casares N, Pequignot MO, Tesniere A, et al. Caspase-dependent immunogenicity of doxorubicin-induced tumor cell death. J Exp Med. 2005;202(12):1691–1701. - PMC - PubMed
    1. Goel S, DeCristo MJ, Watt AC, et al. CDK4/6 inhibition triggers anti-tumour immunity. Nature. 2017;548(7668):471–475. - PMC - PubMed

Publication types

MeSH terms