. 2024 Apr 2;121(14):e2315264121.
doi: 10.1073/pnas.2315264121. Epub 2024 Mar 29.

A red-emitting carborhodamine for monitoring and measuring membrane potential

Affiliations

A red-emitting carborhodamine for monitoring and measuring membrane potential

Anneliese M M Gest et al. Proc Natl Acad Sci U S A. .

Abstract

Biological membrane potentials, or voltages, are a central facet of cellular life. Optical methods to visualize cellular membrane voltages with fluorescent indicators are an attractive complement to traditional electrode-based approaches, since imaging methods can be high throughput, less invasive, and provide more spatial resolution than electrodes. Recently developed fluorescent indicators for voltage largely report changes in membrane voltage by monitoring voltage-dependent fluctuations in fluorescence intensity. However, it would be useful to be able to not only monitor changes but also measure values of membrane potentials. This study discloses a fluorescent indicator which can address both. We describe the synthesis of a sulfonated tetramethyl carborhodamine fluorophore. When this carborhodamine is conjugated with an electron-rich, methoxy (-OMe) containing phenylenevinylene molecular wire, the resulting molecule, CRhOMe, is a voltage-sensitive fluorophore with red/far-red fluorescence. Using CRhOMe, changes in cellular membrane potential can be read out using fluorescence intensity or lifetime. In fluorescence intensity mode, CRhOMe tracks fast-spiking neuronal action potentials (APs) with greater signal-to-noise than state-of-the-art BeRST 1 (another voltage-sensitive fluorophore). CRhOMe can also measure values of membrane potential. The fluorescence lifetime of CRhOMe follows a single exponential decay, substantially improving the quantification of membrane potential values using fluorescence lifetime imaging microscopy (FLIM). The combination of red-shifted excitation and emission, mono-exponential decay, and high voltage sensitivity enable fast FLIM recording of APs in cardiomyocytes. The ability to both monitor and measure membrane potentials with red light using CRhOMe makes it an important approach for studying biological voltages.

Keywords: fluorescence; imaging; physiology; voltage.


Conflict of interest statement

Competing interests statement:The authors declare no competing interest.

Figures

Scheme 1.
Scheme 1.
Synthesis of carborhodamine fluorophores (79) and voltage dyes (1317).
Fig. 1.
Fig. 1.
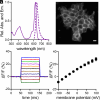
Characterization of CRhOMe (15) voltage sensitivity in HEK293T. (A) Absorption (solid line) and emission (dashed line) spectra of CRhOMe (15) in PBS, pH 7.4, 0.1% SDS. (B) Epifluorescence image of a group of HEK293T cells stained with 500 nM CRhOMe. (Scale bar is 10 µm.) (C) Change in fluorescence for a single HEK293T cell under whole-cell voltage clamp conditions in which the membrane potential was stepped from +100 to −100 mV in 20 mV increments. (D) Average fluorescence intensity change (%ΔF/F) observed across multiple voltage-clamped HEK293T cells. Error bars are ± SD for n = 8 cells.
Fig. 2.
Fig. 2.
CRhOMe tracks spontaneous and evoked APs in cultured neurons. (A) Wide-field microscopy fluorescence and (B) DIC images of cultured rat hippocampal neurons stained with CRhOMe (500 nm, 30 min). (Scale bar is 20 μm.) (C) Optical traces of spontaneous activity of the neurons in panels (A and B) recorded at 500 Hz and shown as ΔF/F vs. time. (D) Highlighted APs from panel (C). (E) Plots of ΔF/F vs. time for neurons stained with either CRhOMe (blue) or BeRST 1 (red) and then subjected to field stimulation to evoke AP responses. (F) Comparison of SNR for CRhOMe (blue) and BeRST 1 (red) in neurons stimulated as in panel E. Data represent mean ± SEM for n = 50 or 21 neurons for CRhOMe and BeRST 1, respectively. Structures of the fluorophores for CRhOMe and BeRST 1 are provided for comparison purposes.
Fig. 3.
Fig. 3.
CRhOMe displays single-exponential fluorescence lifetime decays and a linear fluorescence lifetime-voltage relationship. (A) Plots of fluorescence lifetime decay expressed as normalized photon counts (log scale) vs. time for CRhOMe. Circles indicate photon count data; dashed line is a single exponential decay. Weighted residuals are plotted in the lower graph. (B) Lifetime (colored) and intensity (grayscale) images of HEK293T cells voltage-clamped at the indicated potentials. The lifetime heatmap is scaled from 2.3 to 3.1 ns. (Scalebar is 20 µm.) Arrowhead indicates the voltage-clamped cell. (C) Plot of CRhOMe fluorescence lifetime vs. membrane potential in HEK293T cells. Gray lines are individual cell calibrations (n = 17). The average calibration is in black. Error bars are mean ± SEM.
Fig. 4.
Fig. 4.
CRhOMe reports on EGF-induced hyperpolarization events in A431 cells with enhanced temporal and spatial resolution. Snapshots from a τ time series of serum-starved A431 cells treated with either (A) vehicle (imaging buffer) or (B) EGF. (Scale bar is 20 μm.) Each snapshot is acquired at the indicated time after starting the experiment. Vehicle or EGF is added 20 s into the experiment. (C) Mean lifetime of CRhOMe or (D) TMCRhZero across the full recording. Shading represents SEM. Vehicle or 500 ng/mL EGF was added at the black arrow. Sample sizes: CRhOMe Veh 5, EGF 5; TMCRhZero Veh 3, EGF 3.
Fig. 5.
Fig. 5.
Fluorescence lifetime imaging of spontaneously beating cardiomyocytes using CRhOMe avoids artifacts associated with intensity-based imaging. (A) Representative confocal images of regions of iCMs used for 20 Hz lifetime imaging. Images here are fluorescence intensity only and were acquired for 400 ms (line averaged) to improve contrast. iCMs were stained with 500 nM CRhOMe. (Scale bar is 10 µm.) (B) Plots of fluorescence lifetime of CRhOMe vs. time in active hiPSC-CMs, quantified from the fields of view in A. (C) Plots of fluorescence intensity of CRhOMe vs. time in active hiPSC-CMs from the same regions as in A and B. (Top) arrow depicts photobleaching; (Middle) asterisks depict apparent AP morphological artifact; (Bottom) arrowheads show AP artifact. None of these artifacts appears in the lifetime recording. (D) Representative recordings of CRhOMe absolute Vmem imaging of iCMs treated with 1 µM isoproterenol, which accelerates beat rate. (E) Amplitude of iCM APs, as measured by the change in τ of CRhOMe. Data represent 38 recordings from 8 iCM wells. Bin size for histogram was determined by the Freedman-Diaconis rule.

Update of

References

    1. Bean B. P., The action potential in mammalian central neurons. Nat. Rev. Neurosci. 8, 451–465 (2007). - PubMed
    1. Sanguinetti M. C., Tristani-Firouzi M., hERG potassium channels and cardiac arrhythmia. Nature 440, 463–469 (2006). - PubMed
    1. Nattel S., Carlsson L., Innovative approaches to anti-arrhythmic drug therapy. Nat. Rev. Drug Discov. 5, 1034–1049 (2006). - PubMed
    1. Nichols C. G., KATP channels as molecular sensors of cellular metabolism. Nature 440, 470–476 (2006). - PubMed
    1. Huang X., Jan L. Y., Targeting potassium channels in cancer. J. Cell Biol. 206, 151–162 (2014). - PMC - PubMed

Substances

LinkOut - more resources