. 2024 Apr 23;43(4):113993.
doi: 10.1016/j.celrep.2024.113993. Epub 2024 Mar 27.

Topographical and cell type-specific connectivity of rostral and caudal forelimb corticospinal neuron populations

Affiliations

Topographical and cell type-specific connectivity of rostral and caudal forelimb corticospinal neuron populations

Lina Marcela Carmona et al. Cell Rep. .

Abstract

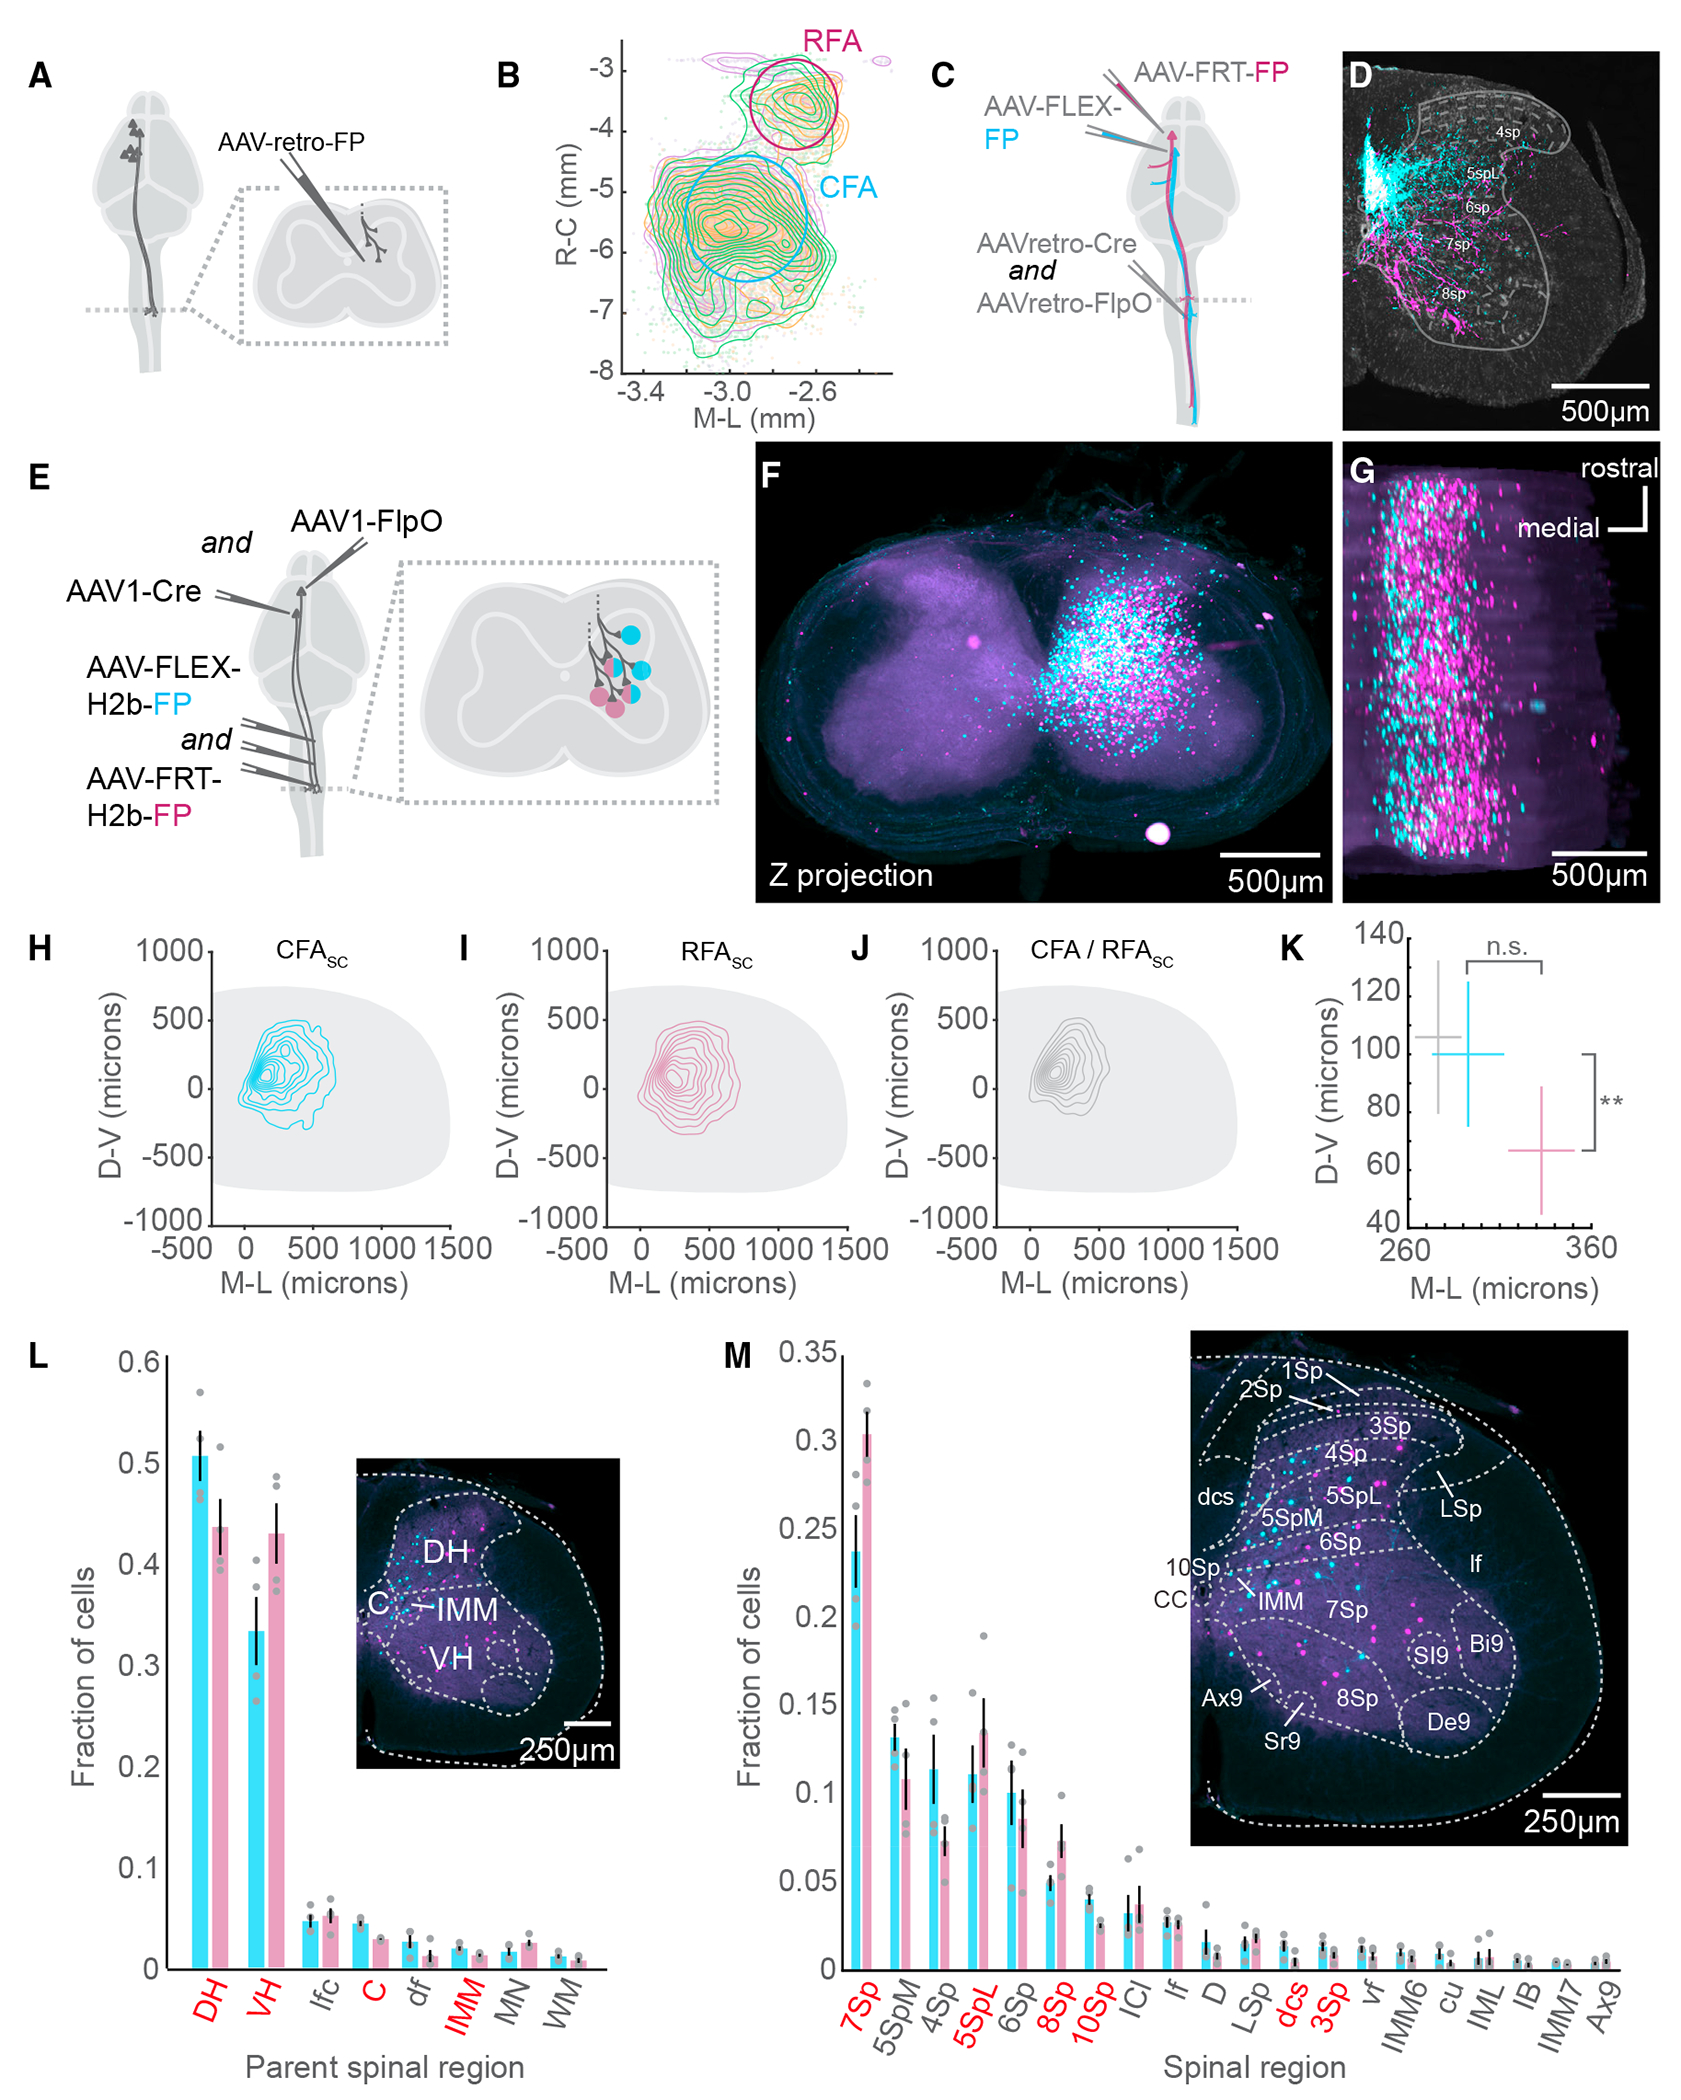
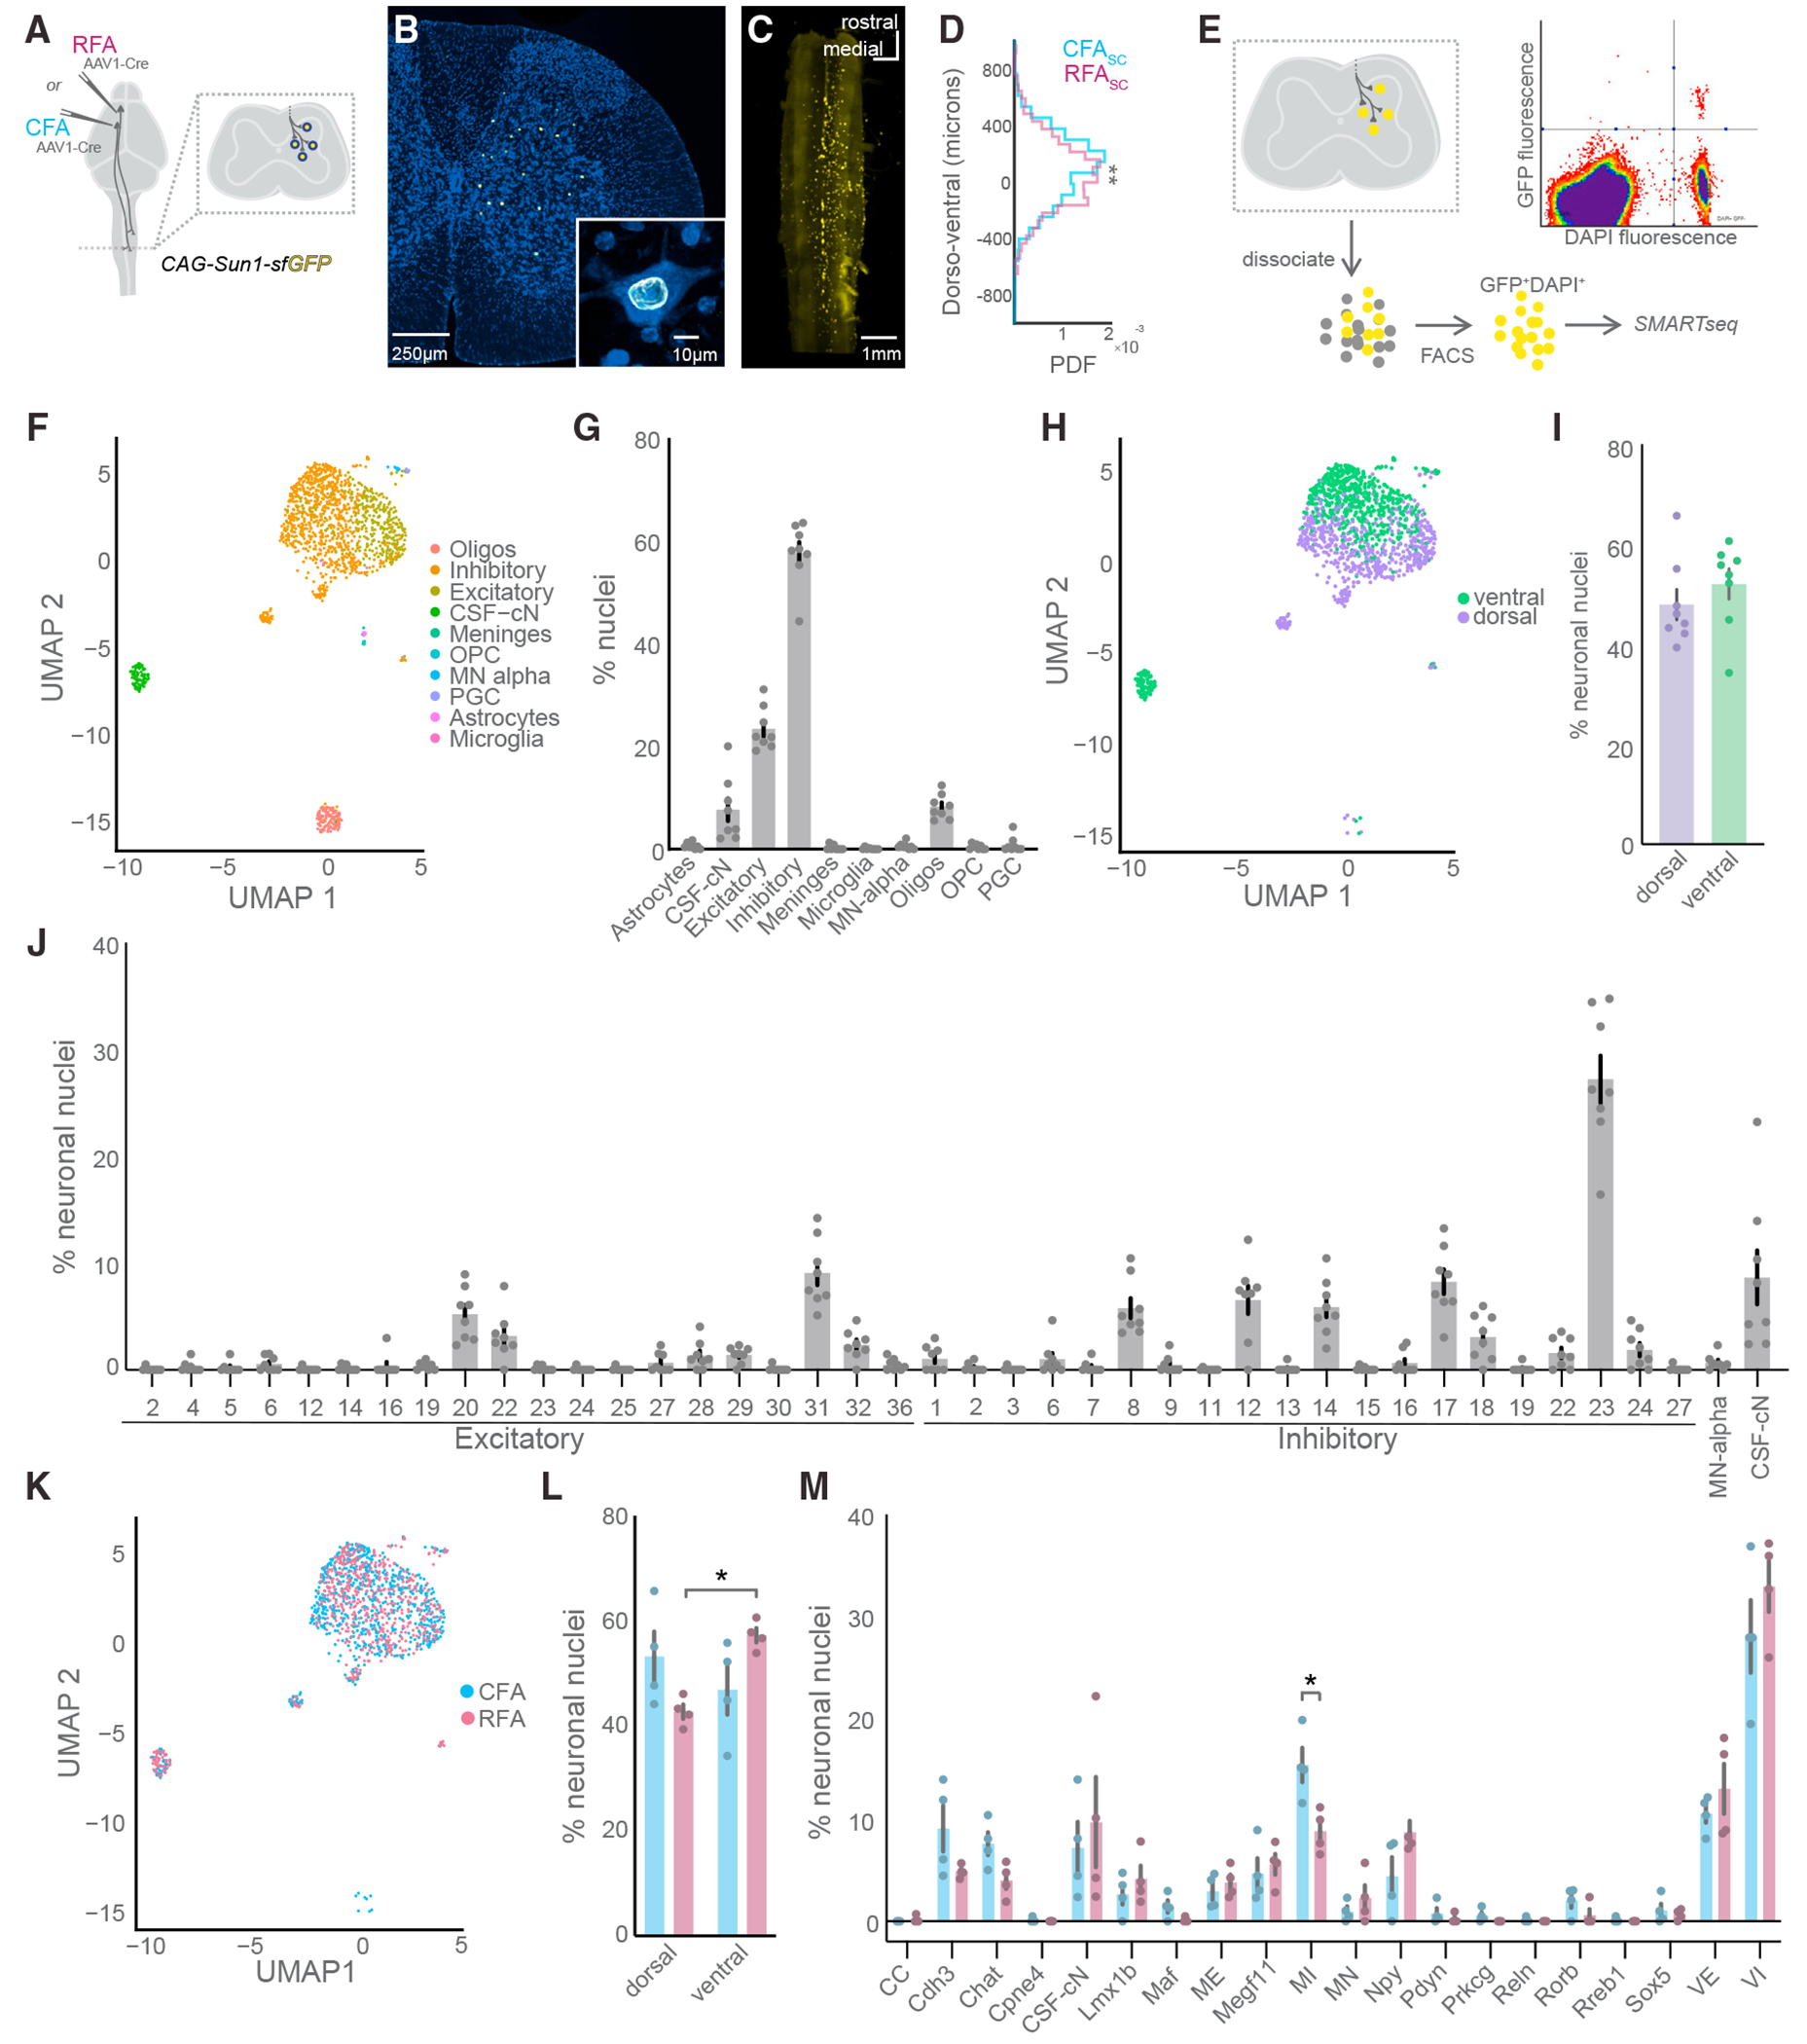
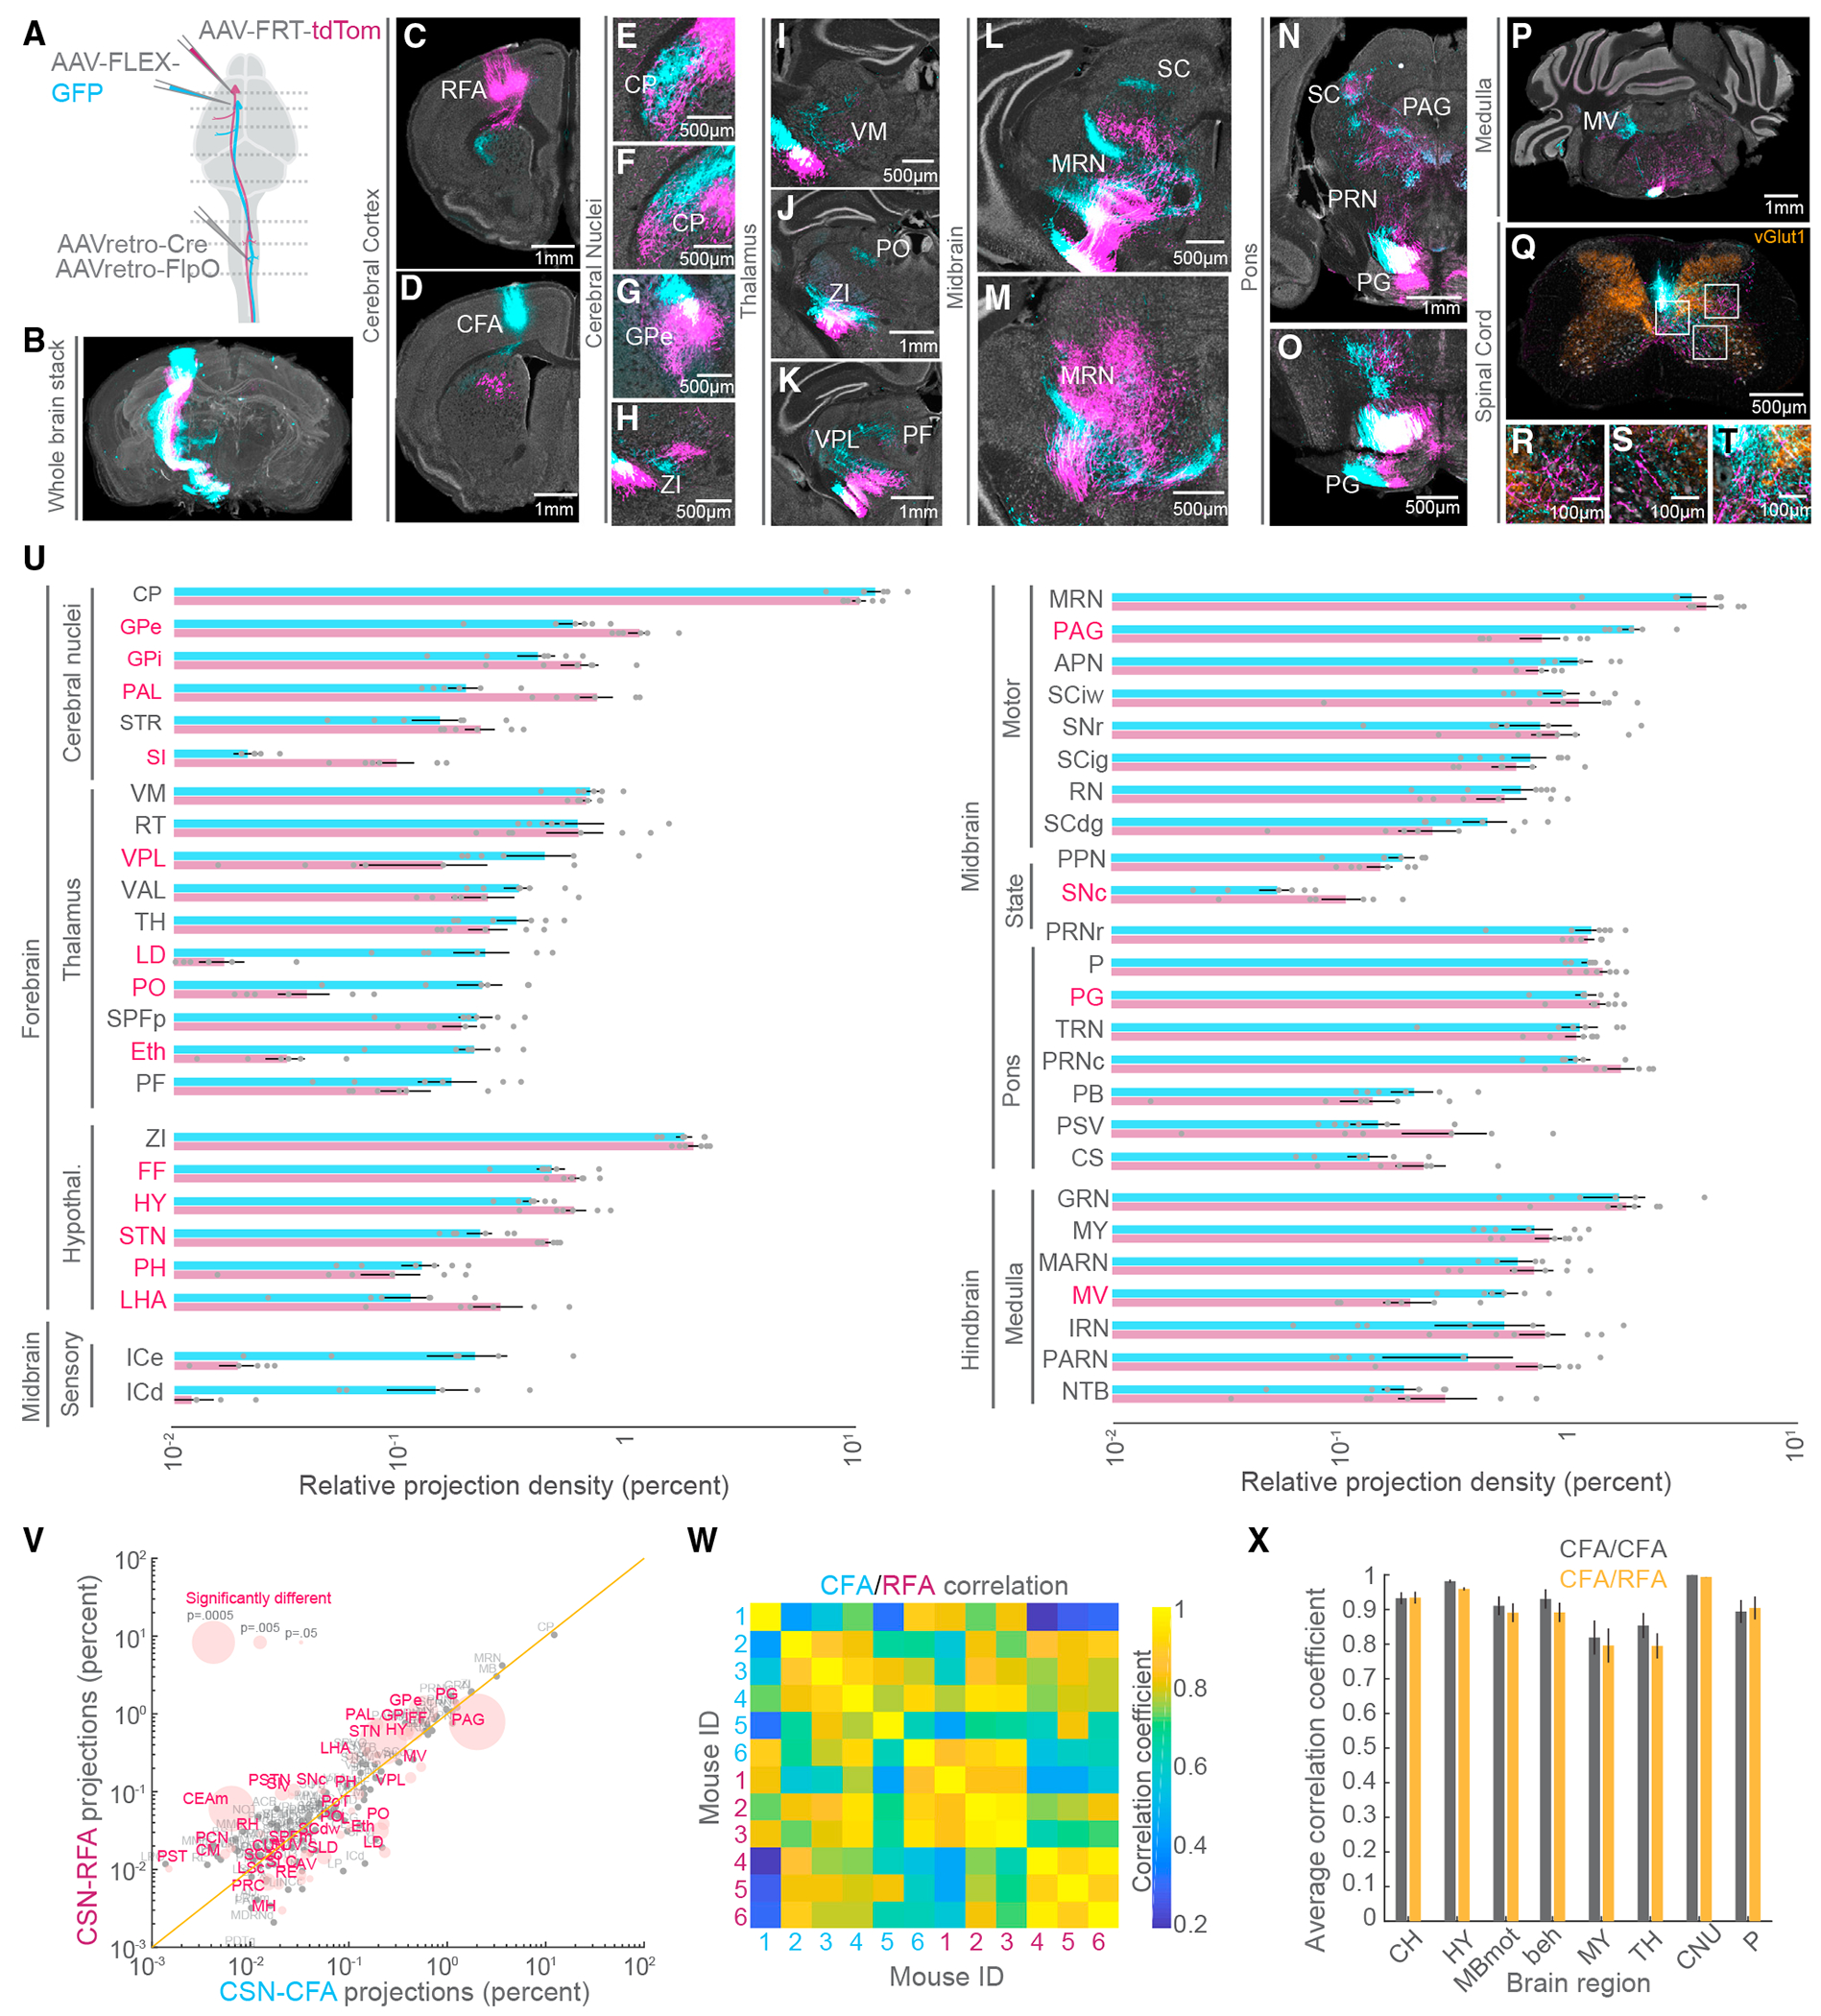
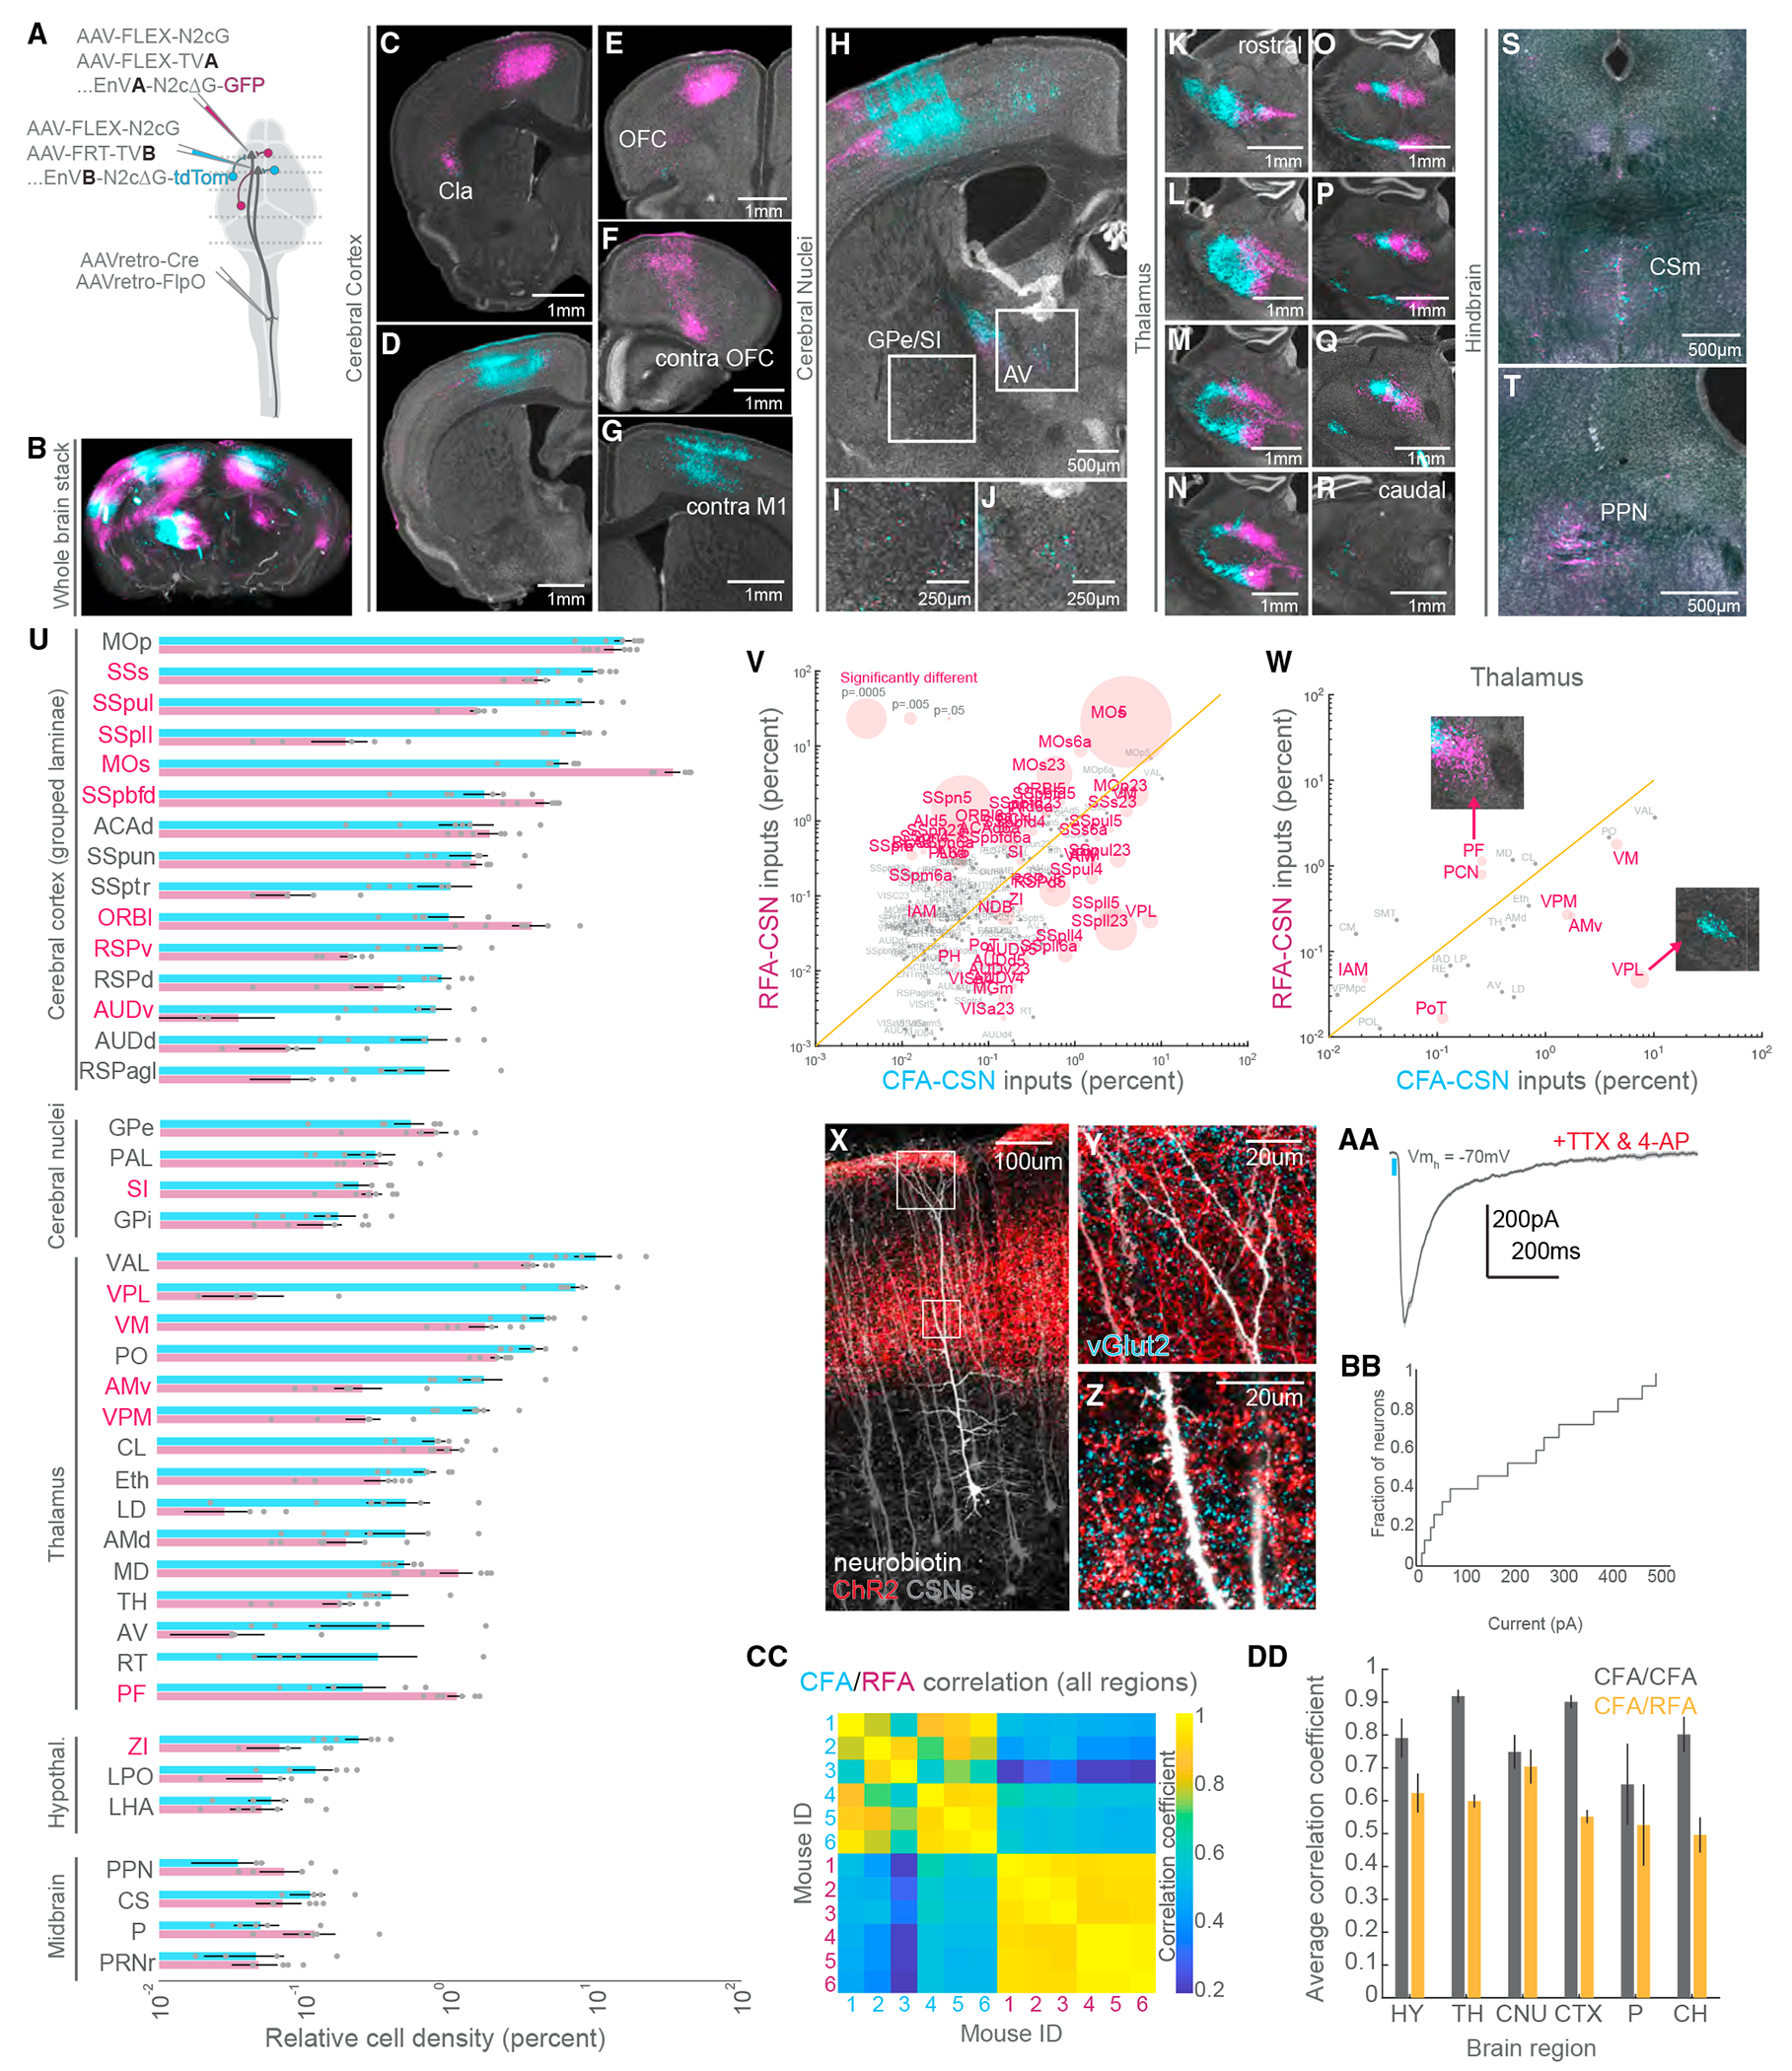
Corticospinal neurons (CSNs) synapse directly on spinal neurons, a diverse assortment of cells with unique structural and functional properties necessary for body movements. CSNs modulating forelimb behavior fractionate into caudal forelimb area (CFA) and rostral forelimb area (RFA) motor cortical populations. Despite their prominence, the full diversity of spinal neurons targeted by CFA and RFA CSNs is uncharted. Here, we use anatomical and RNA sequencing methods to show that CSNs synapse onto a remarkably selective group of spinal cell types, favoring inhibitory populations that regulate motoneuron activity and gate sensory feedback. CFA and RFA CSNs target similar spinal neuron types, with notable exceptions that suggest that these populations differ in how they influence behavior. Finally, axon collaterals of CFA and RFA CSNs target similar brain regions yet receive highly divergent inputs. These results detail the rules of CSN connectivity throughout the brain and spinal cord for two regions critical for forelimb behavior.

Keywords: AnteroT-seq; CFA; CP: Neuroscience; RFA; corticospinal; motor control; motor cortex; spinal cord; transneuronal.


Conflict of interest statement

Declaration of interests The authors declare no competing interests.

Figures

Figure 1.
Figure 1.. CFA and RFA corticospinal neurons target neurons in distinct spinal regions
(A) Strategy to label brain-wide inputs to the cervical spinal cord. (B) Top-down view of a 3D reconstruction of the mouse brain showing CSNs as individual points. A contour map of CSN cell bodies is superimposed. The approximate locations of CFA and RFA are indicated. The three colors indicate samples from 3 separate experiments (N = 3 mice for A and B). (C) Strategy to simultaneously label CFA and RFA CSNs. (D) Photomicrograph of a transverse section of the spinal cord with fluorescently labeled CFA (cyan) and RFA (magenta) axons. Neurotrace is in gray. Major spinal laminae are demarcated (representative of N = 6 mice for C and D). (E) Strategy to simultaneously label spinal neurons that are innervated by CFA or RFA. (F) z stack projection of aligned photomicrographs of the cervical spinal cord. CFASC is in cyan and RFASC is in magenta (representative of N = 4 mice for [F] and [G]). (G) Rotated 3D reconstruction of a section of the cervical spinal cord. (H) Contour plot of CFASC labeling. D-V, dorsoventral; M-L, mediolateral (N = 4 mice for [H]–[M]). (I) Contour plot of RFASC labeling. (J) Contour plot of double-labeled neurons (CFA/RFASC neurons). (K) Mean centroid positions of CFASC, RFASC, and CFA/RFASC populations. (L) The major spinal cord structures containing CFASC and RFASC neurons. Regions colored red indicate a significant difference between CFASC and RFASC fractions. The inset is a photomicrograph with major spinal structures indicated. (M) The spinal cord laminae and nuclei containing CFASC and RFASC neurons. The inset is a photomicrograph with spinal structures indicated. Refer to Table S1 for a complete list of the spinal cord structures and their corresponding acronyms. Data are represented as mean ± SEM. Red text in (F) and (M): p < 0.05, **p < 0.01 See also Figure S1.
Figure 2.
Figure 2.. CSNs are selective in their spinal neuron targets
(A) Strategy to label spinal cord nuclei targeted by CFA or RFA with GFP. (B) Exemplar photomicrograph of CFASC nuclei in the spinal cord. (C) Light-sheet microscopy reconstruction of CFASC nuclear labeling (N = 1 mouse). (D) Histogram of the dorsoventral distribution of CFASC and RFASC labeling (CFASC: N = 2 mice, RFASC: N = 2 mice, data compiled across mice). (E) Strategy to isolate and perform RNA-seq on CFASC or RFASC neurons. An exemplar FACS plot is shown depicting GFP and DAPI co-labeled nuclei in the top right quadrant. (F) Uniform manifold approximation and projection (UMAP) plot of all CSNSC sequenced nuclei passing quality control mapped to the major cell types of the harmonized spinal cord atlas from Russ et al. (N = 8 mice for F–M). (G) The percentage of nuclei belonging to each major cell type across individual experiments. (H) UMAP plot with neuronal nuclei labeled by dorsal and ventral positional identity. (I) The positional identity of neuronal nuclei across individual experiments. (J) The percentage of neuronal nuclei belonging to harmonized spinal neuron type clusters across individual experiments. (K) UMAP plot of sequenced neuronal nuclei labeled by CFA or RFA experimental condition. (L) The positional identity of CFASC and RFASC neurons across individual experiments. (M) The percentage of neuronal nuclei belonging to the harmonized spinal neuron families across individual experiments. Oligos, oligodendrocytes; OPC, oligodendrocyte precursor cells. Refer to Table S2 for a complete list spinal neuronal cell types, families, and their corresponding acronyms. Data are represented as mean ± SEM.*:p < 0.05, **: p < 0.01 See also Figures S2 and S3.
Figure 3.
Figure 3.. The supraspinal topography of CFA and RFA axon collaterals
(A) Strategy to simultaneously label CFA and RFA CSNs. (B) 3D reconstruction of a brain with CFA (cyan) and RFA (magenta) CSNs labeled (representative of N = 6 mice for B–T). (C–T) Exemplar photomicrographs of CFA and RFA CSN labeling throughout the central nervous system. Select regions are indicated. In (Q)–(T), vGlut1 axonal boutons are immunolabeled and shown in orange. (U) The brain regions that are targeted by CFA and RFA CSNs excluding isocortical structures (N = 6 mice for U–X). Regions are grouped by their ontology (see Table S3). Regions with significantly different fractions of CFA and RFA labeling are indicated in red. Note the log scale, given the large range of labeling. (V) Scatterplot of regions containing CFA versus RFA projections. Regions with significantly different fractions of CFA and RFA labeling are colored red. The size of points corresponds to the p value of the comparison (paired t tests). Note the log scale, given the large range of labeling. (W) Matrix depicting the correlation of labeling within and across all 6 mice. Quadrants correspond to CFA versus CFA (top left quadrant), RFA versus RFA (bottom right quadrant), or CFA versus RFA (bottom left and top right quadrants) labeling. (X) The average correlation coefficients of CFA versus CFA (gray) labeling or CFA versus RFA labeling (orange) within major brain regions across all mice. CH, cerebrum; HY, hypothalamus; MBmot, motor midbrain; beh, behavioral-state-related midbrain; MY, medulla; TH, thalamus; CNU, cerebral nuclei; P, pons. Refer to Table S3 for a complete list of the brain structures and their corresponding acronyms. Data are represented as mean ± SEM. Red text in (U) and (V): p < 0.05 See also Figure S4.
Figure 4.
Figure 4.. CFA and RFA CSNs are defined by unique brain-wide inputs
(A) Strategy to simultaneously label brain-wide inputs to CFA and RFA CSNs. (B) 3D reconstruction of a brain with inputs to CFA (cyan) and RFA (magenta) CSNs labeled (representative of N = 6 mice). (C–T) Exemplar photomicrographs of inputs to CFA and RFA CSNs throughout the brain. Select regions are indicated (representative of N = 6 mice for B–T). (U) The brain regions that give rise to neurons that synapse on CFA or RFA CSNs (N = 6 mice for U–W, CC, and DD). Regions are grouped by their ontology (see Table S3). Regions with significantly different fractions of input to CFA and RFA CSNs are indicated in red. Note the log scale, given the large range of labeling. (V) Scatterplot of regions containing inputs to CFA versus RFA CSNs. Regions with significantly different fractions of CFA and RFA inputs are colored red. The size of points corresponds to the p value of the comparison (paired t tests). Note the log scale, given the large range of labeling. (W) Same as (V) but only showing thalamic inputs. The insets are photomicrographs illustrating the biases in thalamic input to CFA or RFA CSNs. (X) Photomicrograph illustrating CSNs (gray), thalamocortical axons (red), and a select CSN targeted for whole-cell intracellular recording (white, representative of N = 3 mice for X–Z). (Y) An expanded view of the superficial boxed region from (X) depicting axons surrounding the apical dendrites of CSNs. Presynaptic terminals are labeled with vGlut2 (cyan). (Z) An expanded view of the lower boxed region from (X) depicting axons surrounding the trunk dendrites of CSNs. Presynaptic terminals are labeled with vGlut2 (cyan). (AA) Example average EPSC evoked through optogenetic stimulation of thalamocortical axons (blue bar). Recordings are made in TTX and 4AP to isolate monosynaptic transmission. (BB) Cumulative distribution of the current evoked through stimulation of thalamocortical axons (N = 3 mice, n = 15 neurons for AA and BB). (CC) Matrix depicting the correlation of input labeling within and across all 6 mice. Quadrants correspond to CFA versus CFA (top left quadrant), RFA versus RFA (bottom right quadrant), or CFA versus RFA (bottom left and top right quadrants) labeling. (DD) The average correlation coefficients of inputs to CFA versus CFA (gray) or CFA versus RFA labeling (orange) within major brain regions across all mice. Refer to Table S3 for a complete list of the brain structures and their corresponding acronyms. Data are represented as mean ± SEM. Red text in (U)–(W): p < 0.05 See also Figures S5–S7.

Update of

Similar articles

Cited by

References

    1. Arber S, and Costa RM (2018). Connecting neuronal circuits for movement. Science 360, 1403–1404. 10.1126/science.aat5994. - DOI - PubMed
    1. Lemon RN (2008). Descending pathways in motor control. Annu. Rev. Neurosci 31, 195–218. 10.1146/annurev.neuro.31.060407.125547. - DOI - PubMed
    1. Jessell TM (2000). Neuronal specification in the spinal cord: inductive signals and transcriptional codes. Nat. Rev. Genet 1, 20–29. 10.1038/35049541. - DOI - PubMed
    1. Lu DC, Niu T, and Alaynick WA (2015). Molecular and cellular development of spinal cord locomotor circuitry. Front. Mol. Neurosci 8, 25. 10.3389/fnmol.2015.00025. - DOI - PMC - PubMed
    1. Russ DE, Cross RBP, Li L, Koch SC, Matson KJE, Yadav A, Alkaslasi MR, Lee DI, Le Pichon CE, Menon V, and Levine AJ (2021). A harmonized atlas of mouse spinal cord cell types and their spatial organization. Nat. Commun 12, 5722. 10.1038/s41467-021-25125-1. - DOI - PMC - PubMed

Publication types

LinkOut - more resources