. 2024 Aug 2;14(8):1476-1495.
doi: 10.1158/2159-8290.CD-23-1220.

BRCA1-Mediated Dual Regulation of Ferroptosis Exposes a Vulnerability to GPX4 and PARP Co-Inhibition in BRCA1-Deficient Cancers

Affiliations

BRCA1-Mediated Dual Regulation of Ferroptosis Exposes a Vulnerability to GPX4 and PARP Co-Inhibition in BRCA1-Deficient Cancers

Guang Lei et al. Cancer Discov. .

Abstract

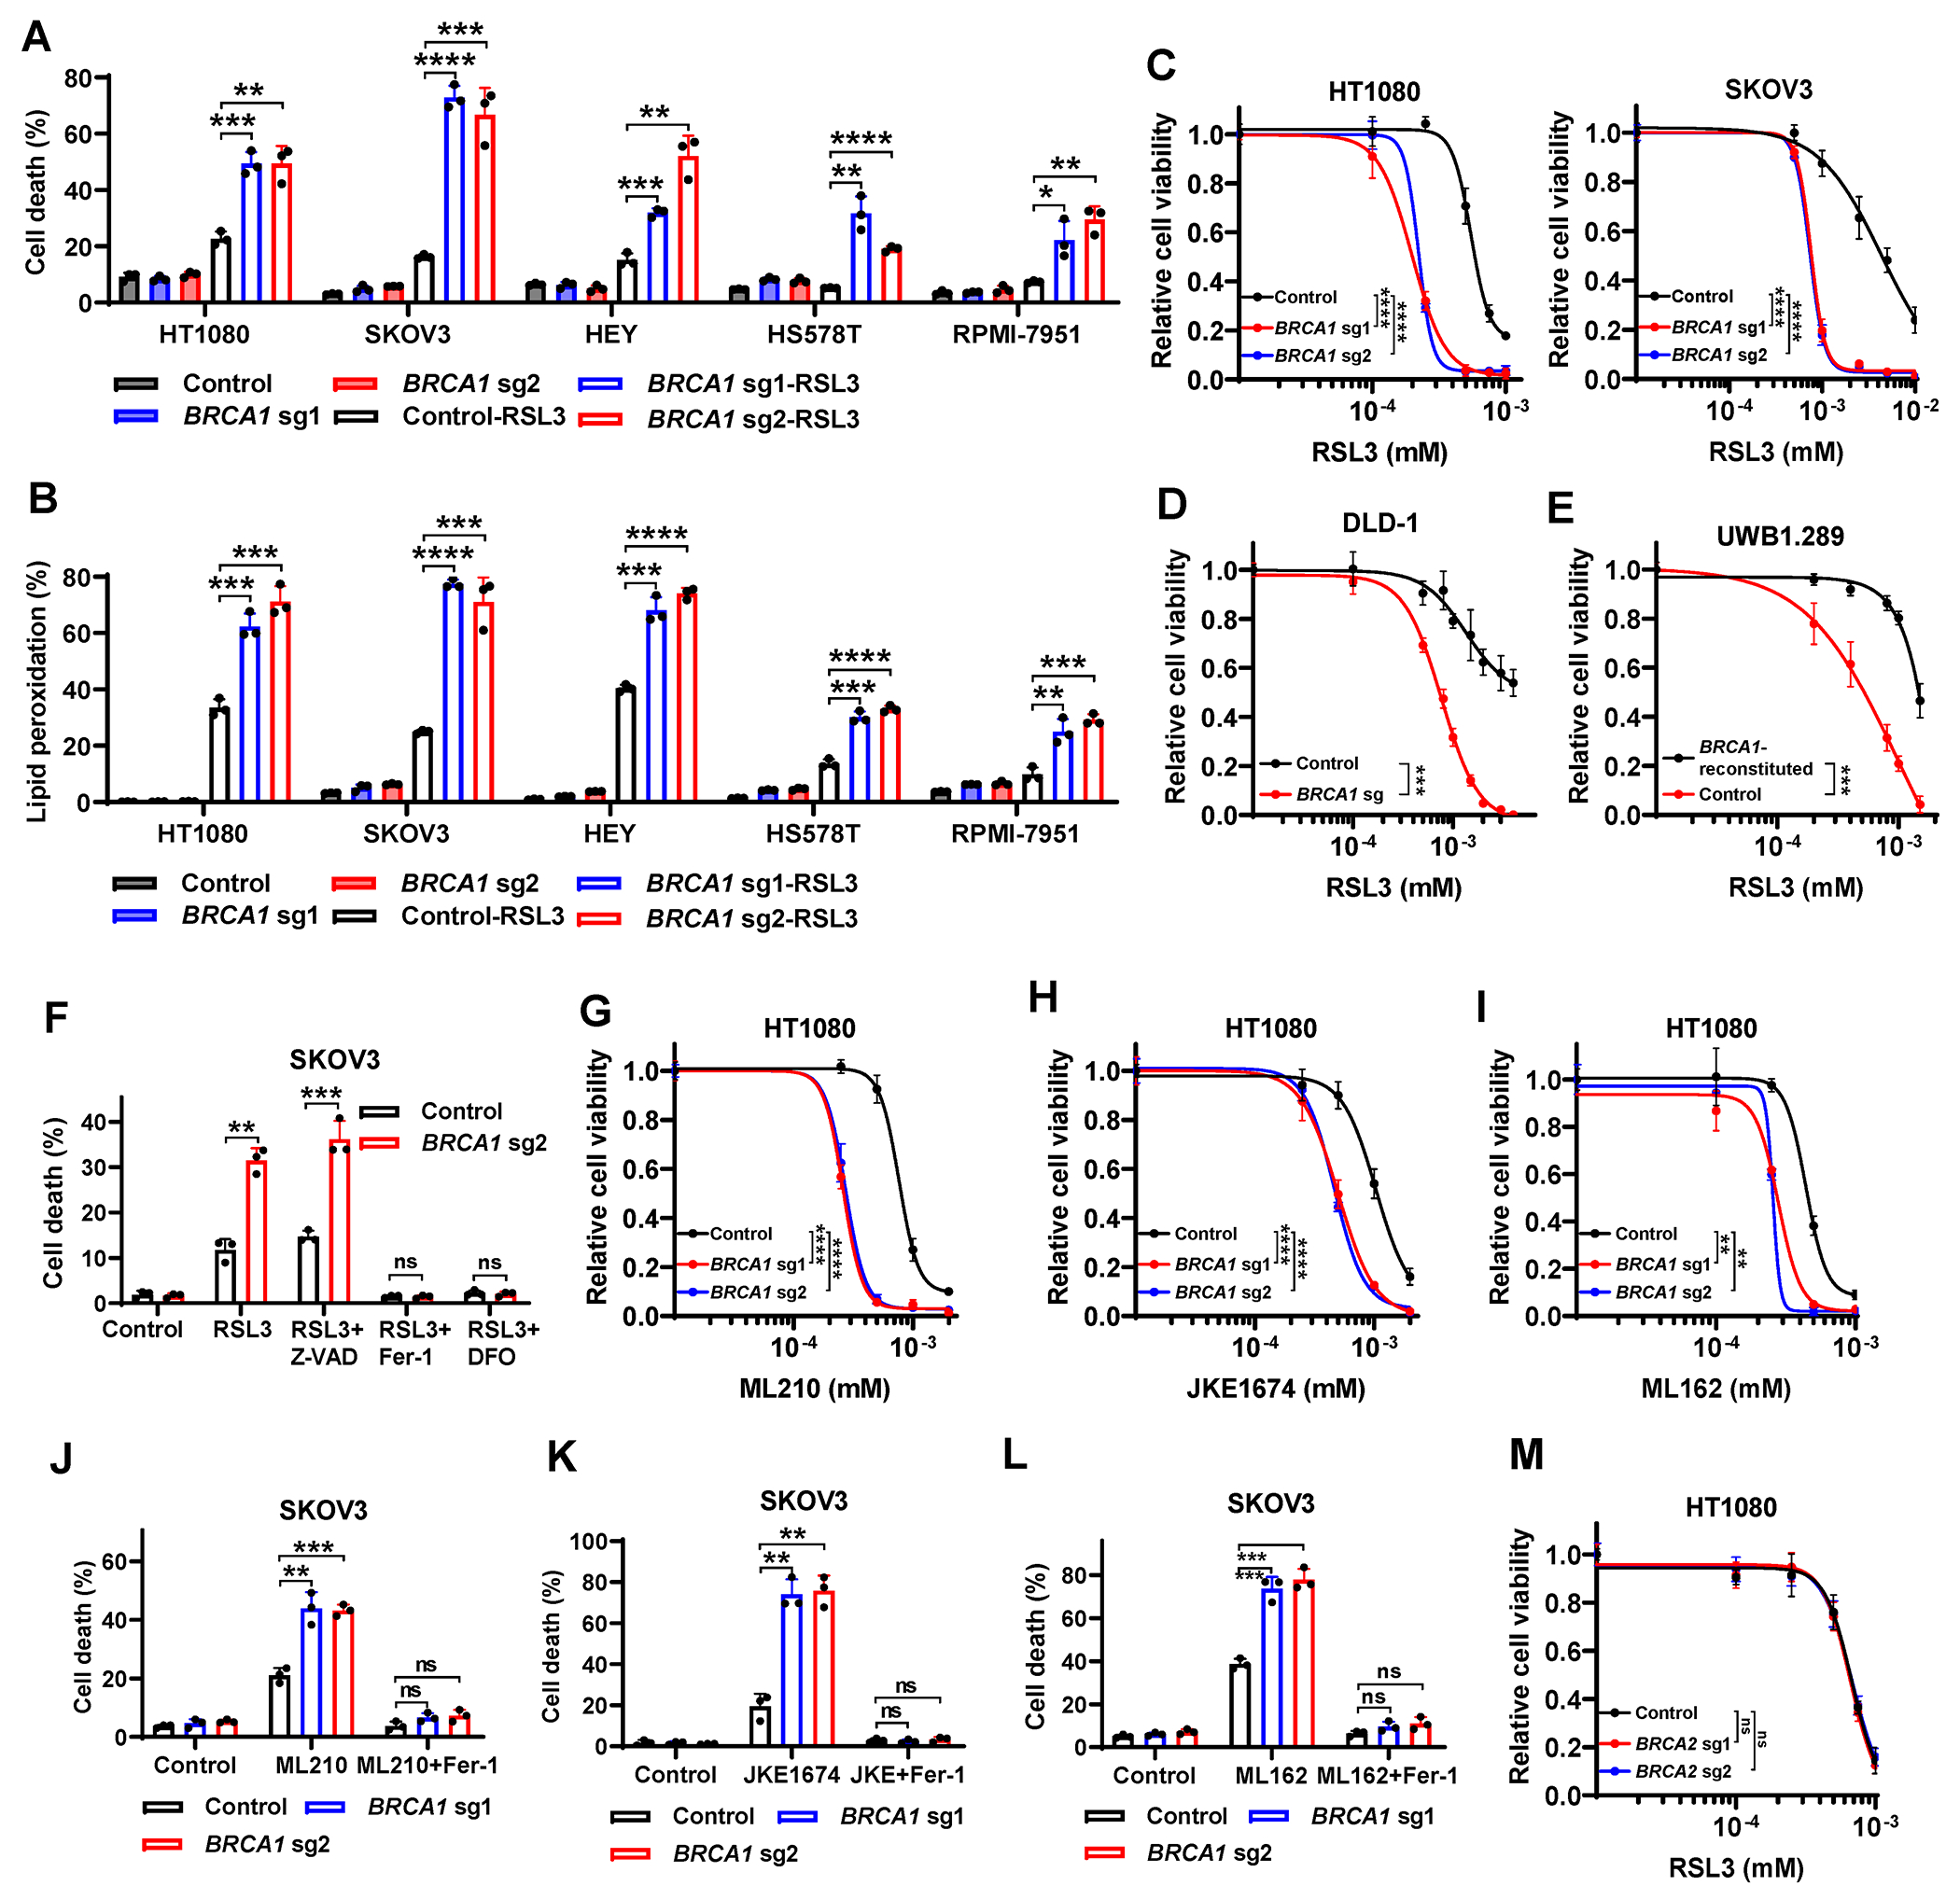
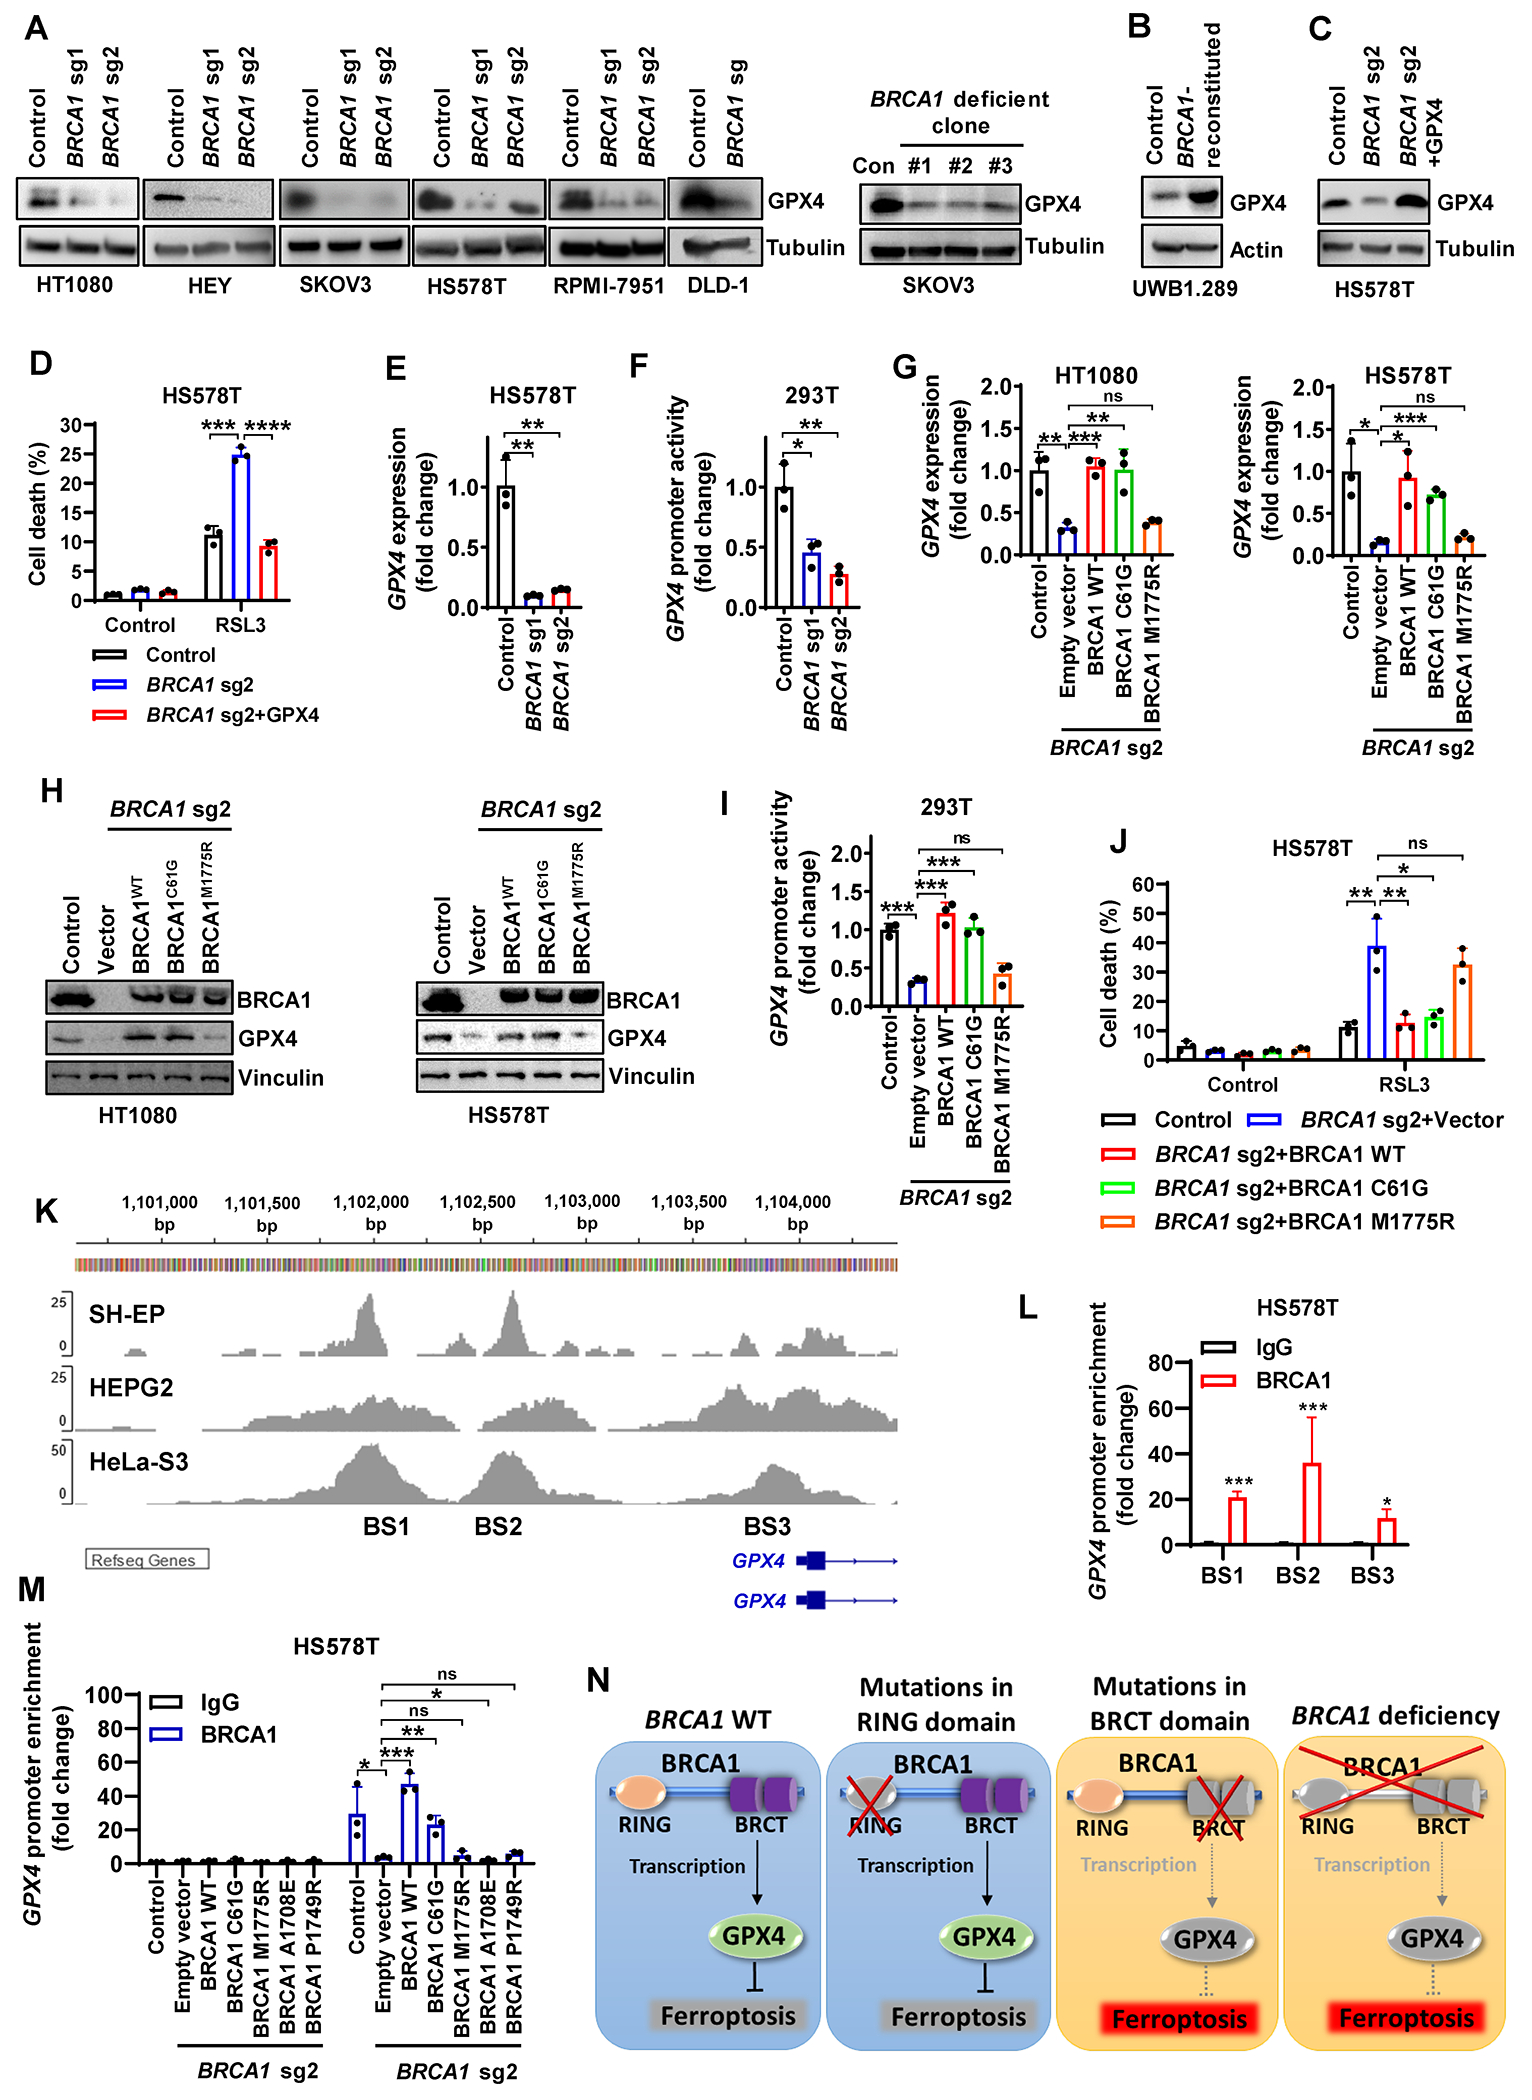
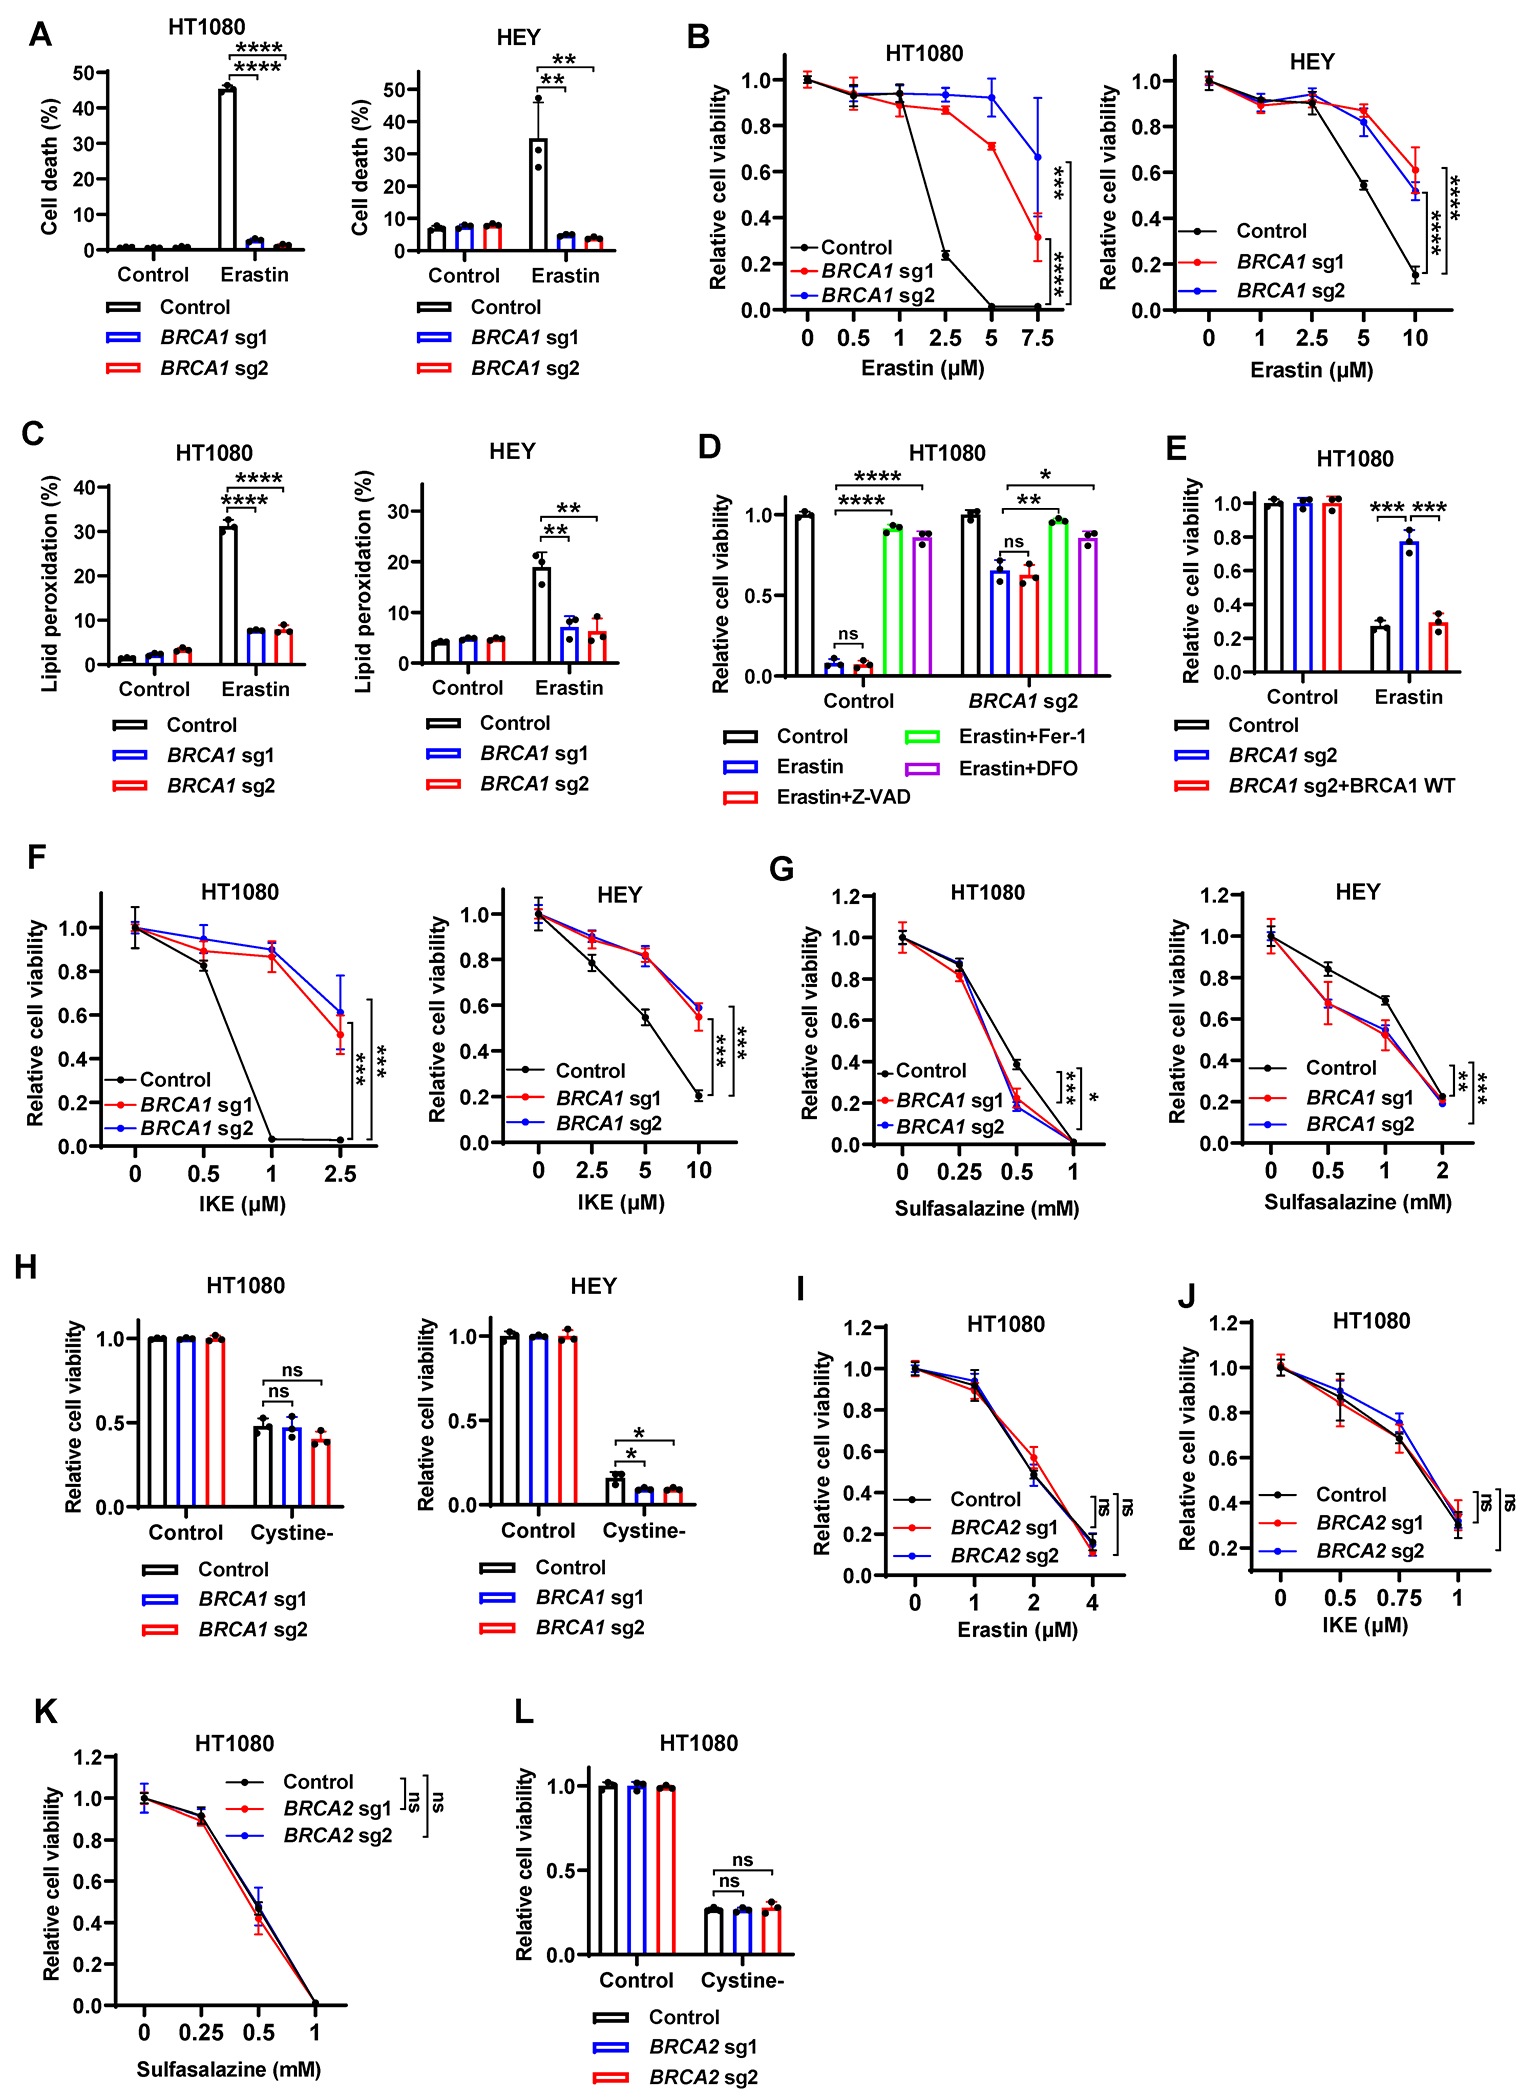
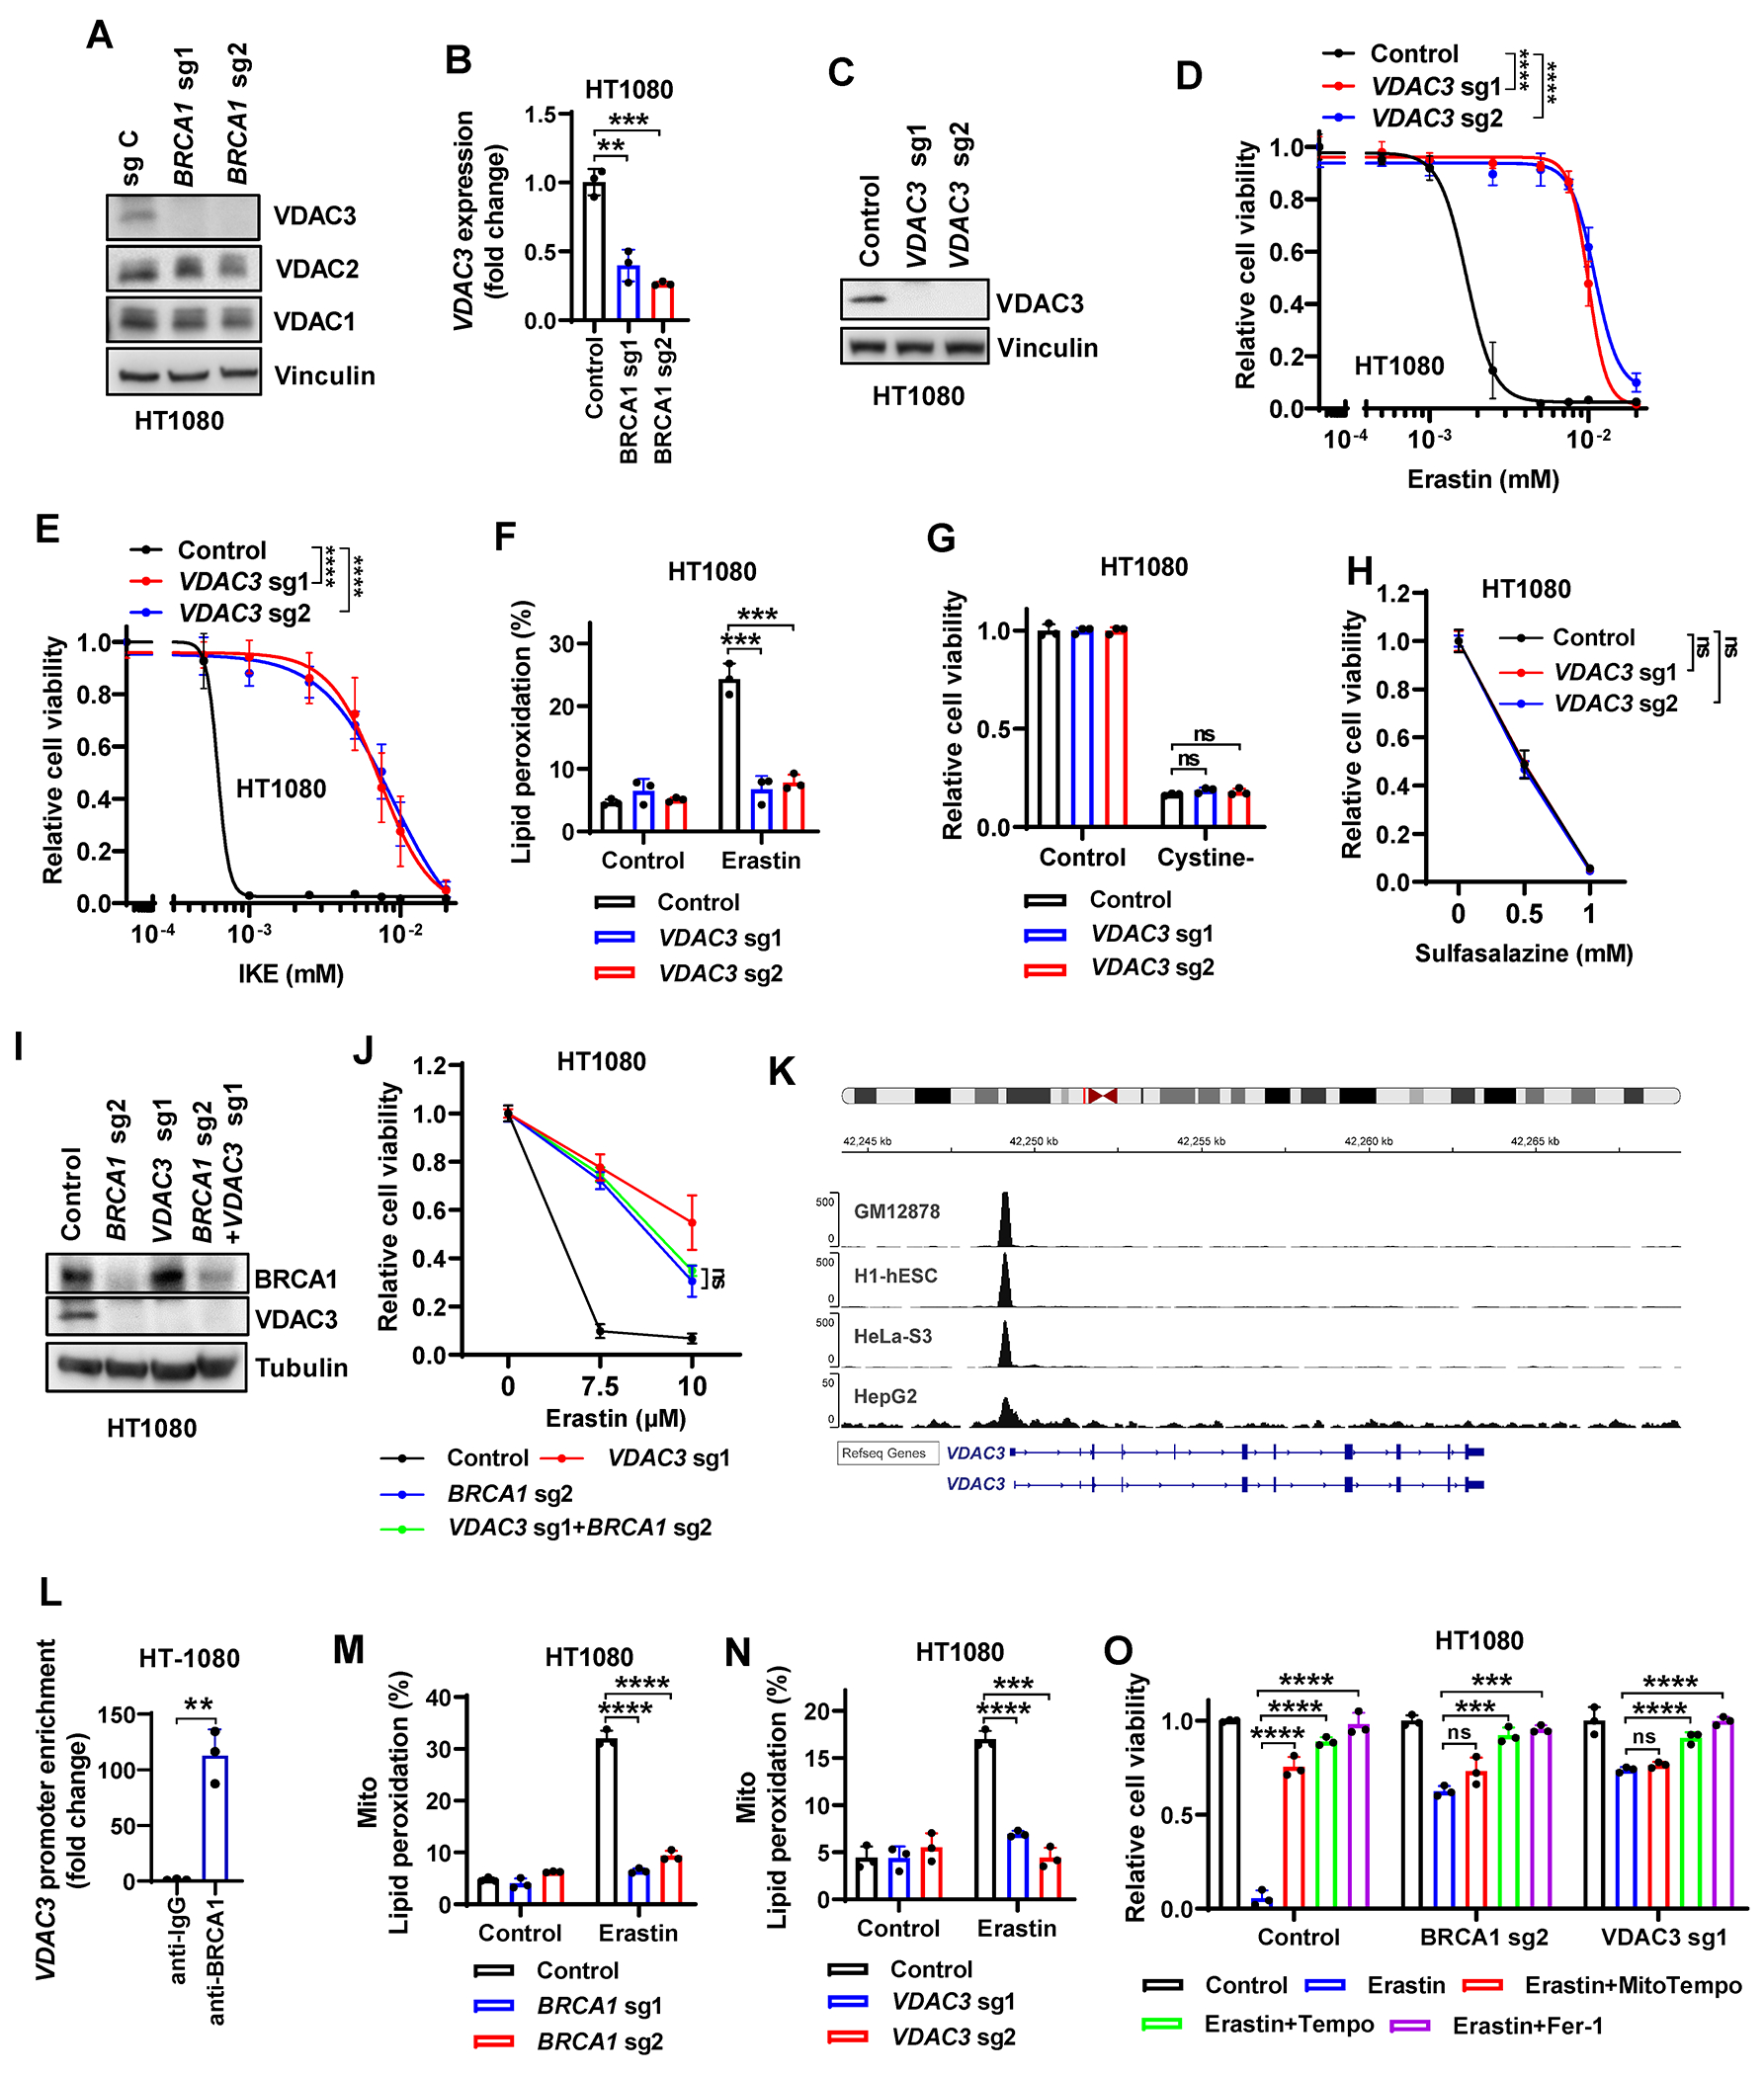
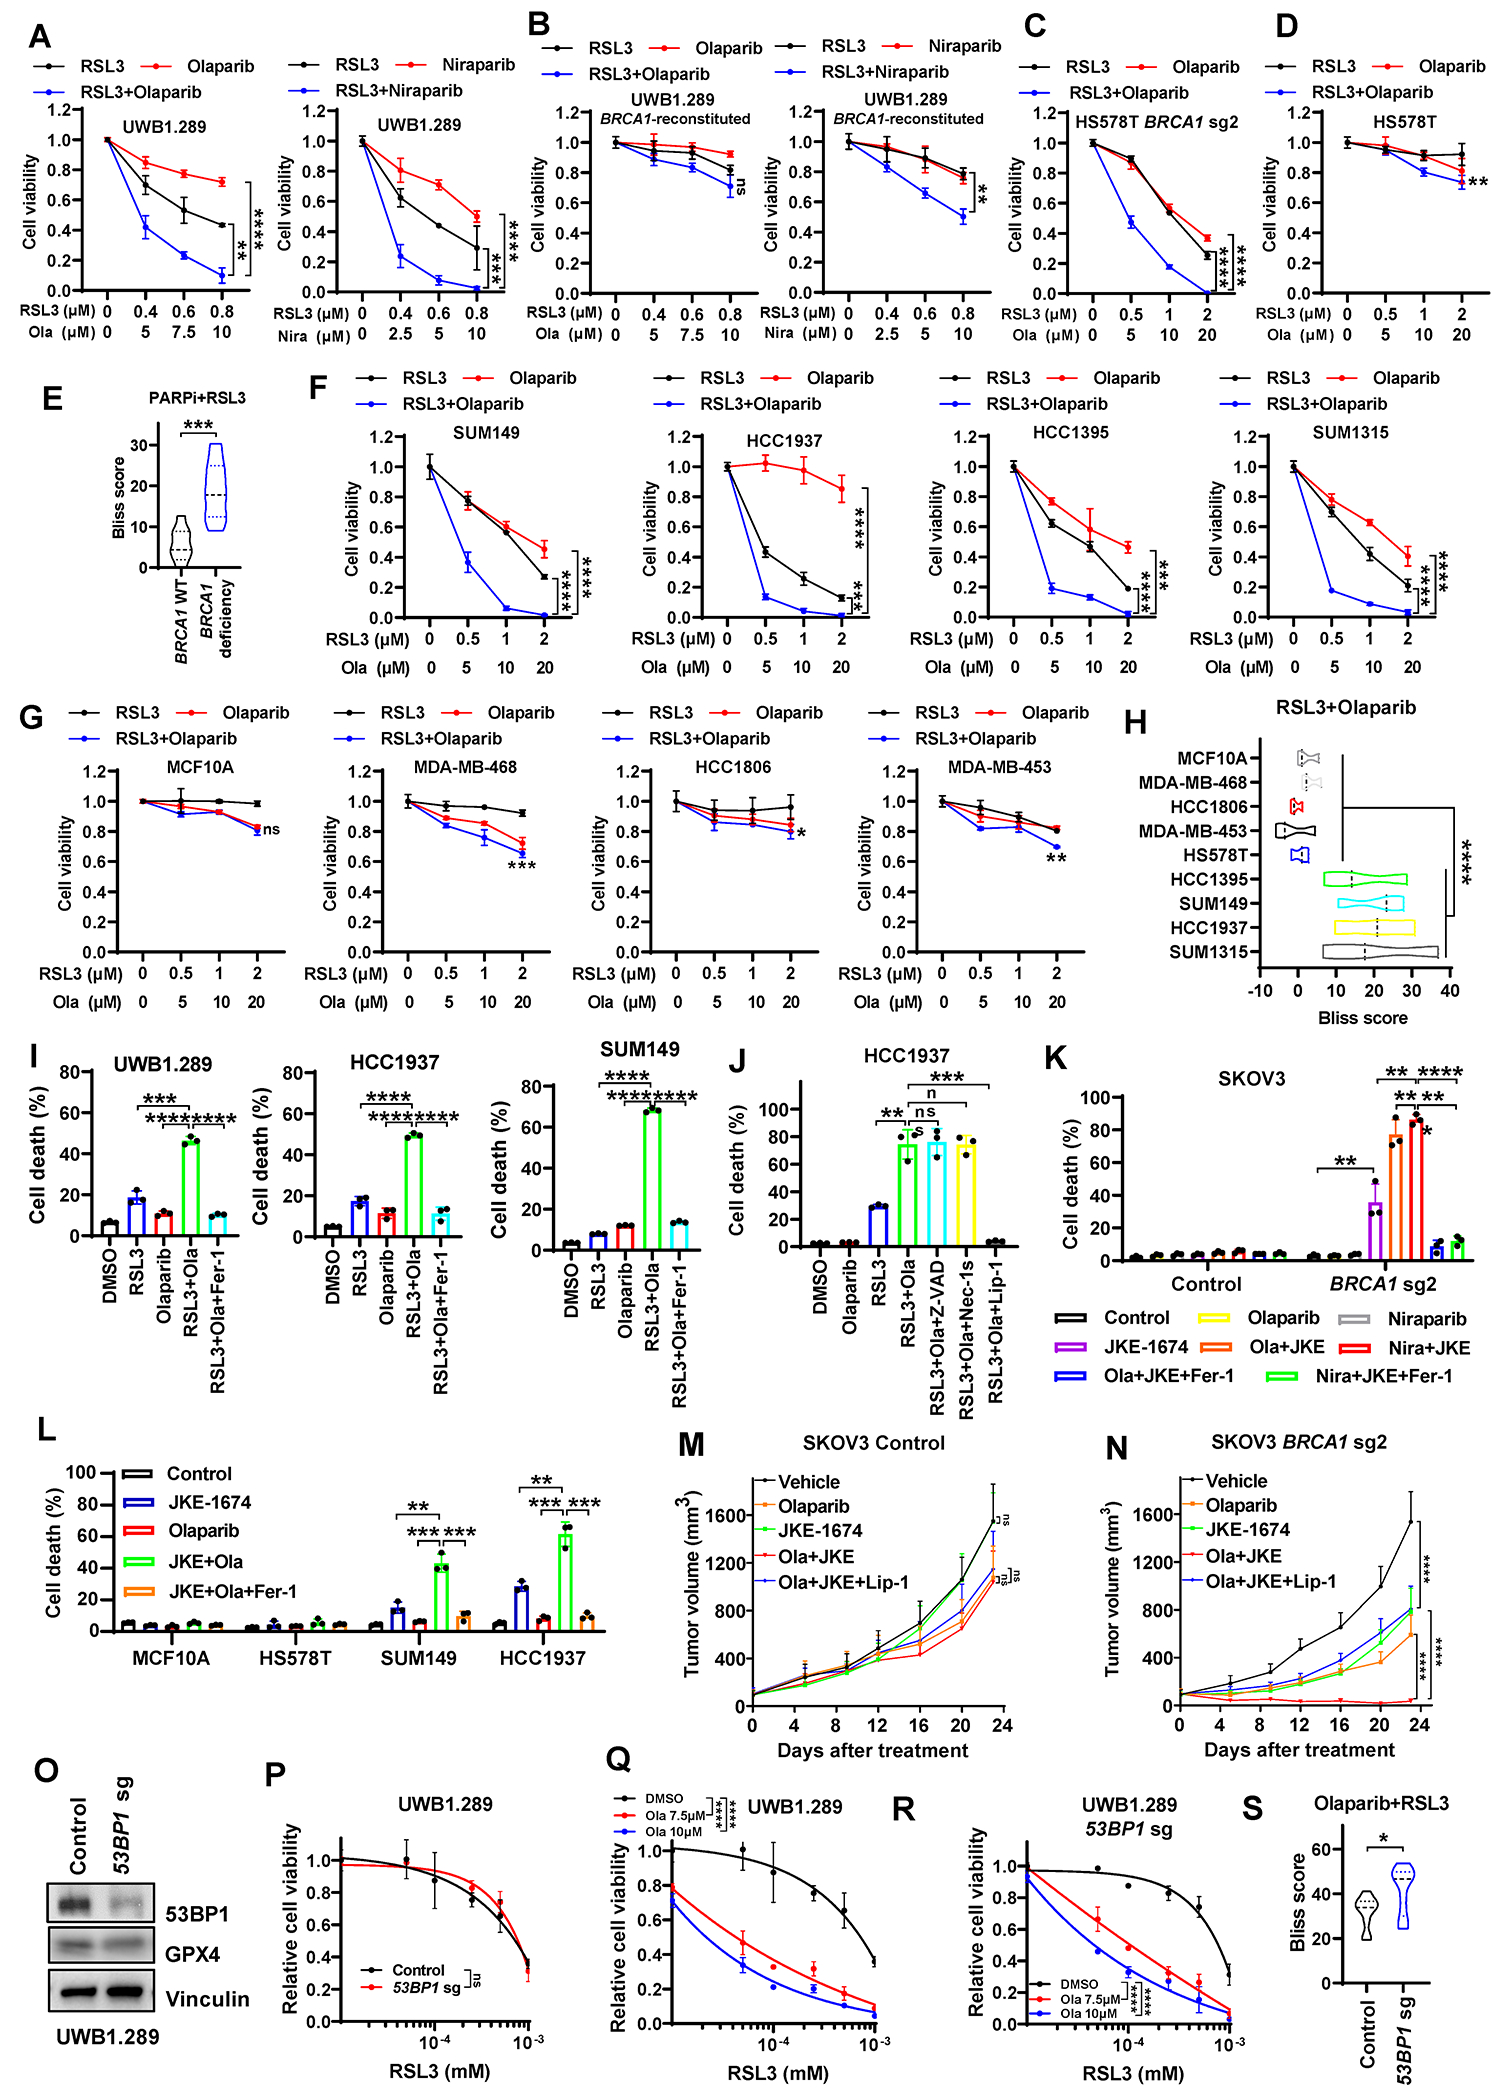
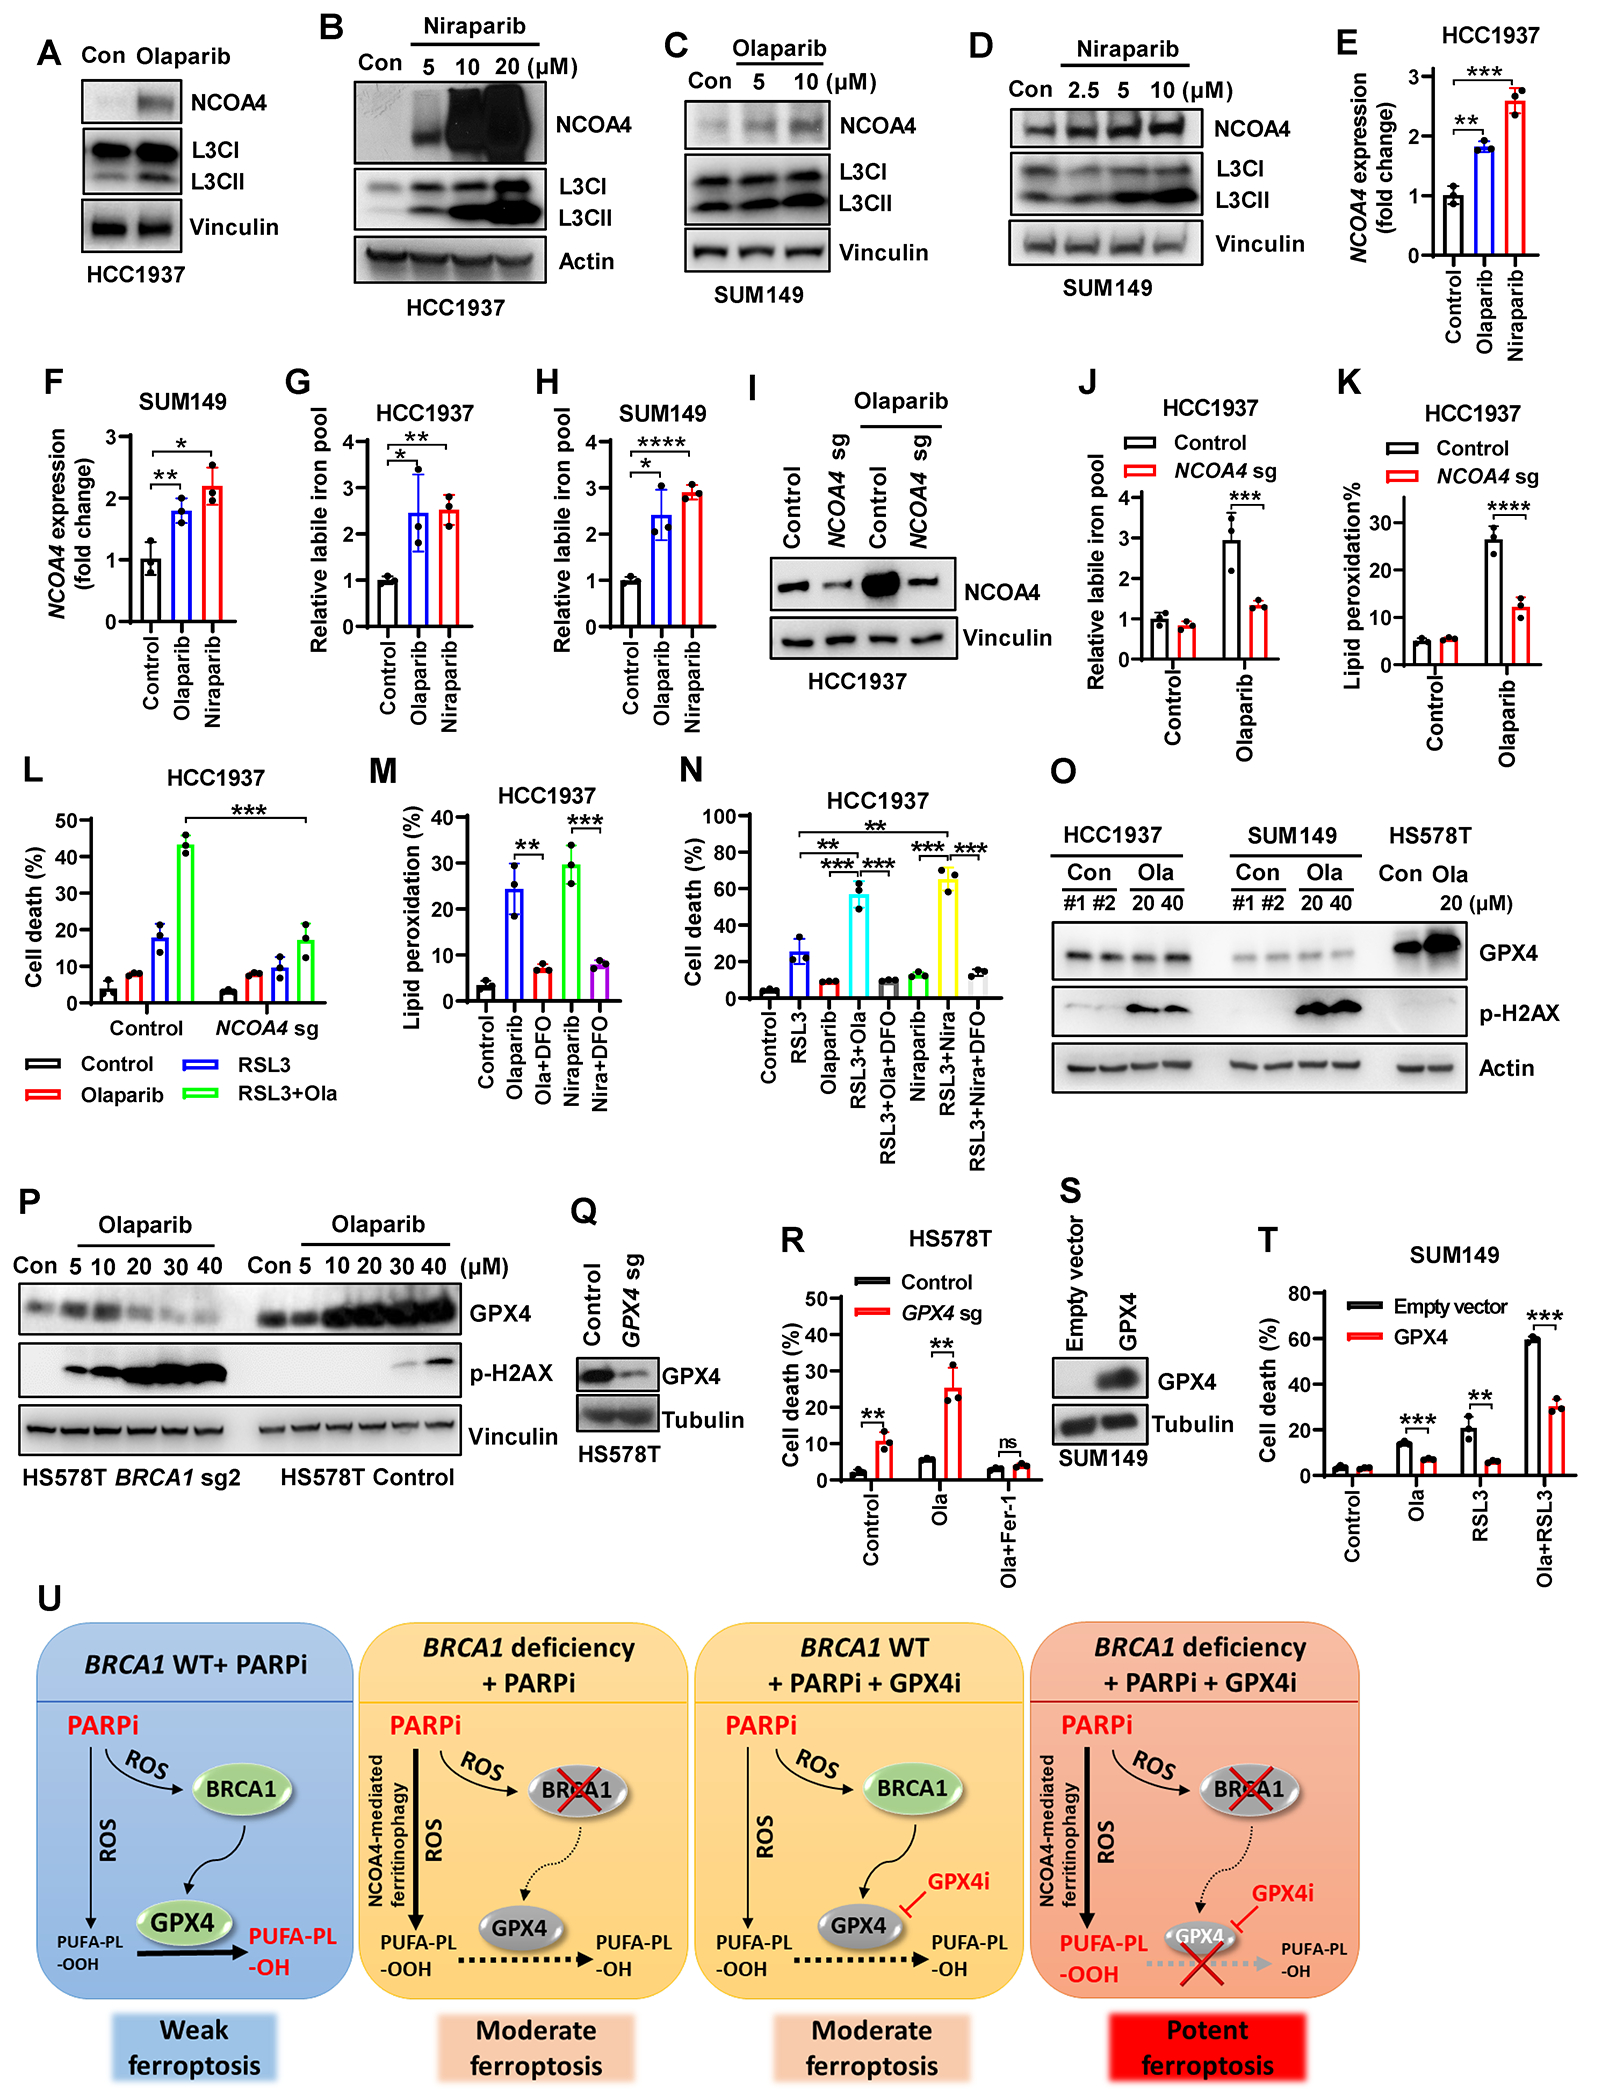
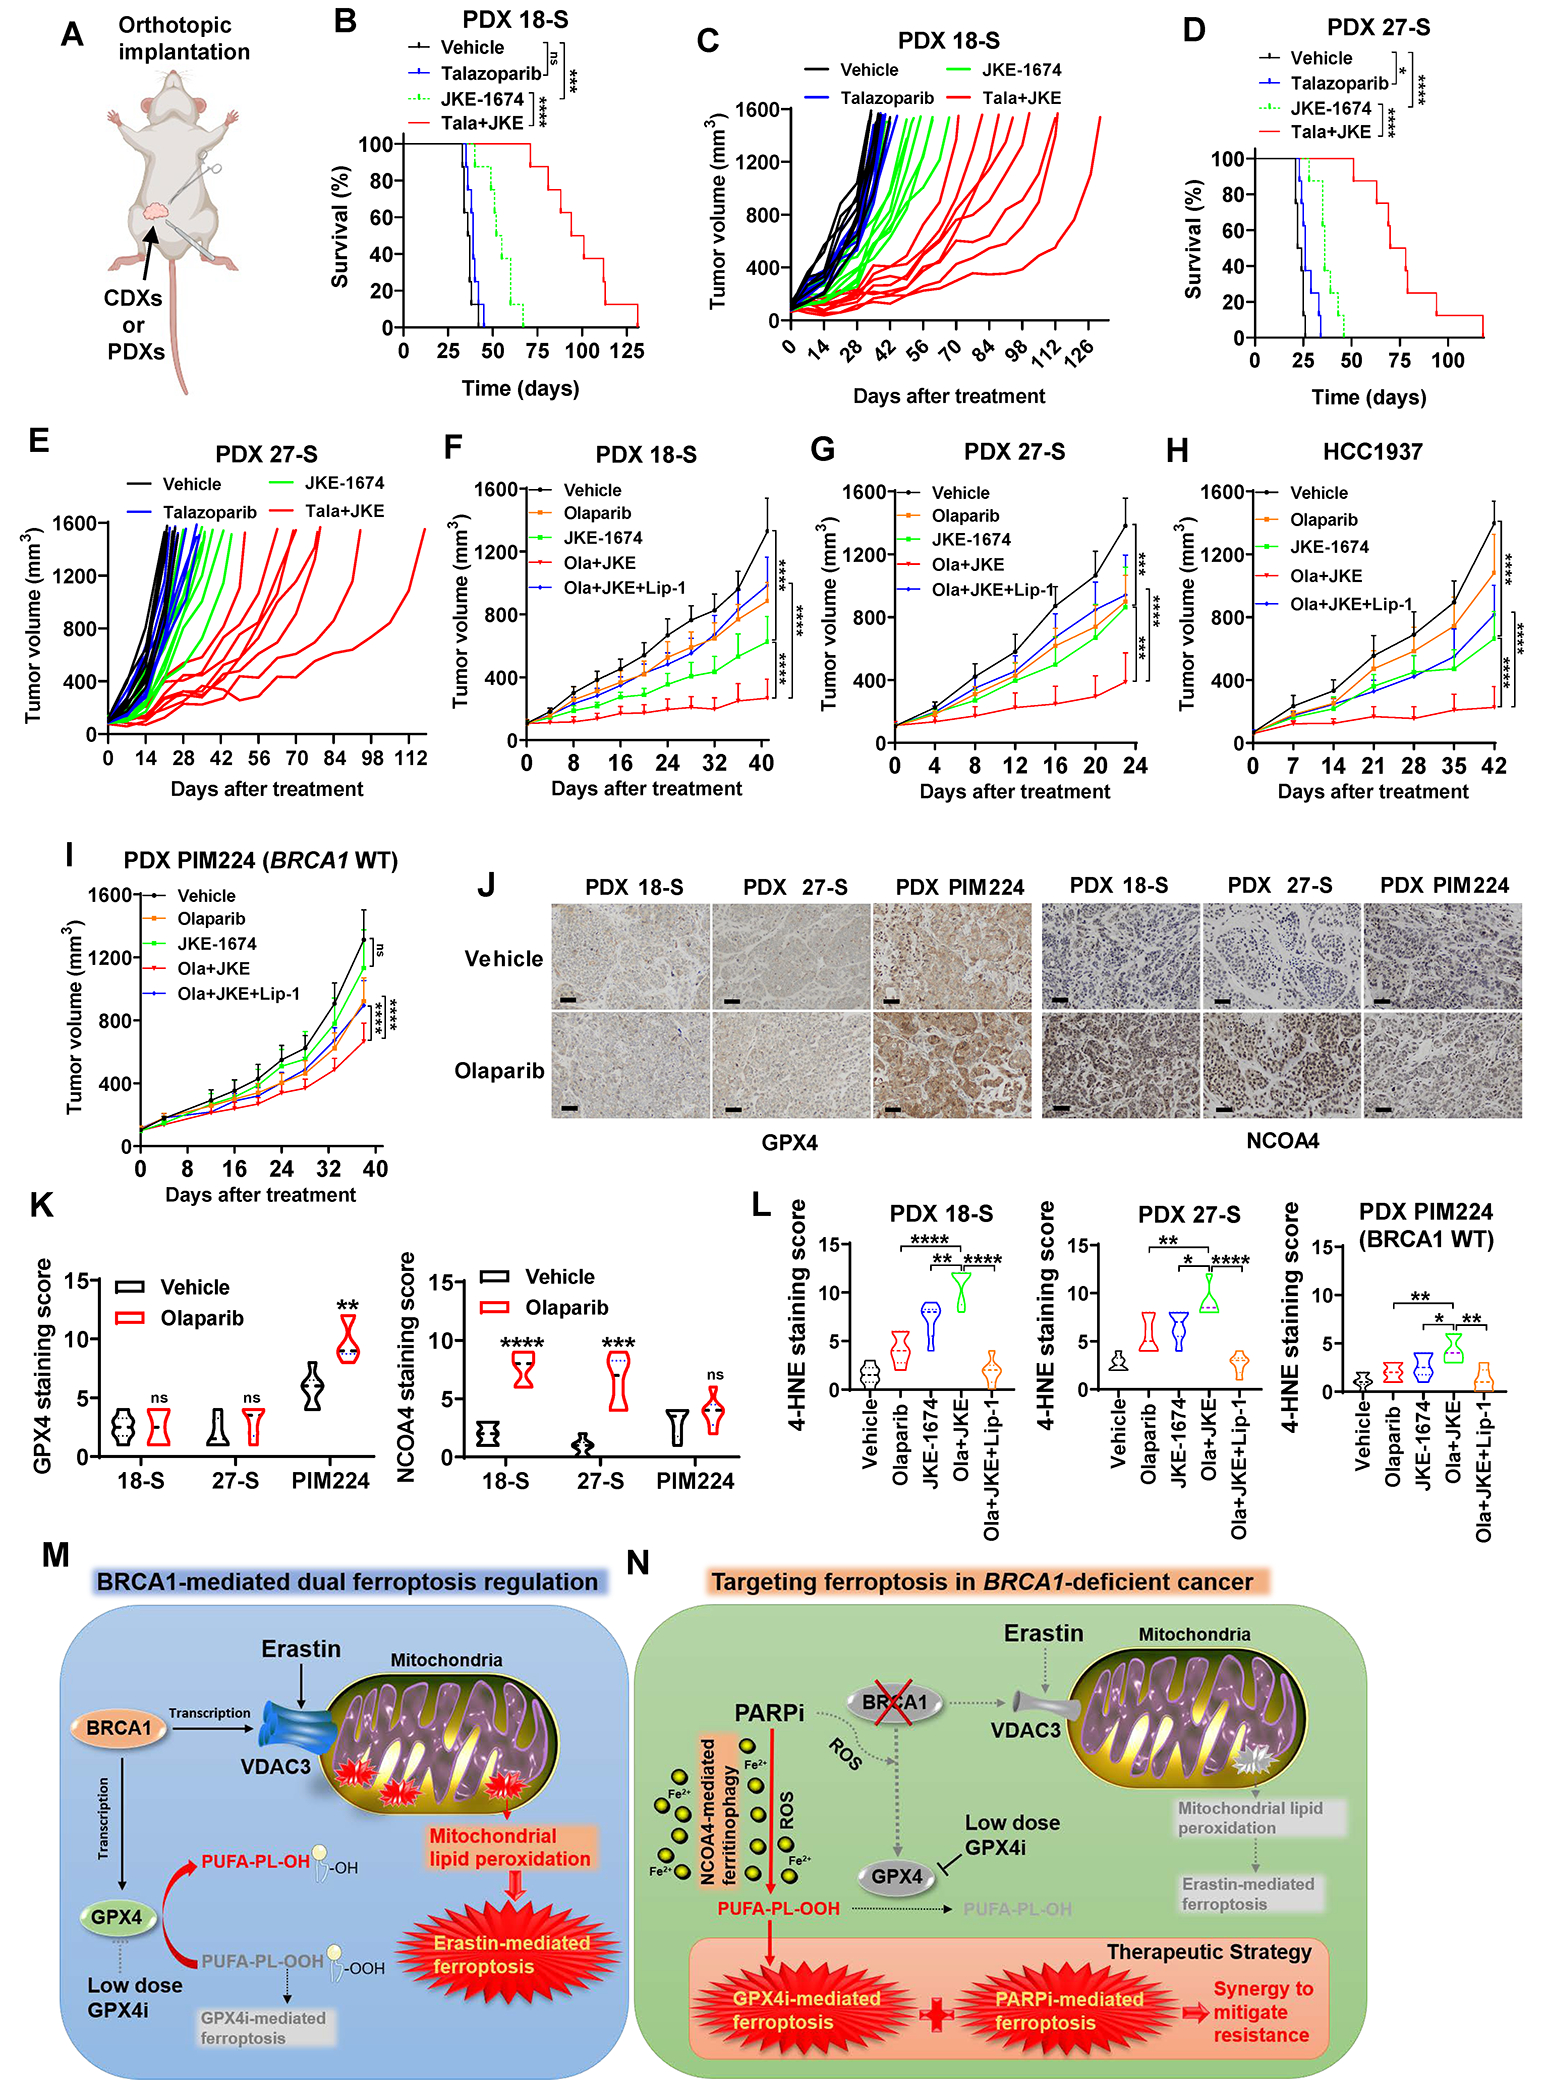
Resistance to poly (ADP-ribose) polymerase inhibitors (PARPi) limits the therapeutic efficacy of PARP inhibition in treating breast cancer susceptibility gene 1 (BRCA1)-deficient cancers. Here we reveal that BRCA1 has a dual role in regulating ferroptosis. BRCA1 promotes the transcription of voltage-dependent anion channel 3 (VDAC3) and glutathione peroxidase 4 (GPX4); consequently, BRCA1 deficiency promotes cellular resistance to erastin-induced ferroptosis but sensitizes cancer cells to ferroptosis induced by GPX4 inhibitors (GPX4i). In addition, nuclear receptor coactivator 4 (NCOA4)-mediated ferritinophagy and defective GPX4 induction unleash potent ferroptosis in BRCA1-deficient cancer cells upon PARPi and GPX4i co-treatment. Finally, we show that xenograft tumors derived from patients with BRCA1-mutant breast cancer with PARPi resistance exhibit decreased GPX4 expression and high sensitivity to PARP and GPX4 co-inhibition. Our results show that BRCA1 deficiency induces a ferroptosis vulnerability to PARP and GPX4 co-inhibition and inform a therapeutic strategy for overcoming PARPi resistance in BRCA1-deficient cancers. Significance: BRCA1 deficiency promotes resistance to erastin-induced ferroptosis via blocking VDAC3 yet renders cancer cells vulnerable to GPX4i-induced ferroptosis via inhibiting GPX4. NCOA4 induction and defective GPX4 further synergizes GPX4i with PARPi to induce ferroptosis in BRCA1-deficient cancers and targeting GPX4 mitigates PARPi resistance in those cancers. See related commentary by Alborzinia and Friedmann Angeli, p. 1372.


Conflict of interest statement

B.G. and G.L. have filed a patent application relating to the use of GPX4 inhibitors in combination with PARP inhibitors for treating BRCA1-deficienct cancers. B.G. reports personal fees from Guidepoint Global, Cambridge Solutions, and NGM Bio. T.A.Y. received research support (to institution) from Acrivon, Artios, AstraZeneca, Bayer, Beigene, BioNTech, Blueprint, BMS, Boundless bio, Clovis, Constellation, Cyteir, Eli Lilly, EMD Serono, Forbius, F-Star, GlaxoSmithKline, Genentech, Haihe, Ideaya ImmuneSensor, Ionis, Ipsen, Jounce, Karyopharm, KSQ, Kyowa, Merck, Mirati, Novartis, Pfizer, Ribon Therapeutics, Regeneron, Repare, Rubius, Sanofi, Scholar Rock, Seattle Genetics, Tesaro, Vivace and Zenith. T.A.Y. has received fees for consulting from AbbVie, AstraZeneca, Acrivon, Adagene, Almac, Aduro, Amphista, Artios, Athena, Atrin, Avoro, Axiom, Baptist Health Systems, Bayer, Beigene, Blueprint Medicines, Boxer, Bristol Myers Squibb, C4 Therapeutics, Calithera, Cancer Research UK, Circle Pharma, Clovis, CUHK Committee, Cybrexa, Dark Blue Therapeutics, Diffusion, Ellipses.Life, EMD Serono, F-Star, Genentech, Genmab, Gerson and Lehrman Group, Glenmark, GLG, Globe Life Sciences, GSK, Guidepoint, Idience, Ignyta, I-Mab, ImmuneSensor, Institut Gustave Roussy, Intellisphere, Jansen, Kyn, LRG1, MEI pharma, Mereo, Merck, Natera, Nexys, Novocure, OHSU, OncoSec, Ono Pharma, Panangium, Pegascy, PER, Pfizer, Piper-Sandler, Pliant Therapeutics, Prolynx, Radiopharm Theranostics, Repare, resTORbio, Roche, Sanofi, Schrodinger, Seagen, Synthis Therapeutics, Terremoto Biosciences, Tessellate Bio, TD2 Theragnostics, Tome Biosciences, Varian, Versant, Vibliome, Xinthera, Zai Labs, Zentalis and ZielBio. T.A.Y. is the stockholder in Seagen. All other authors declare no competing financial interests.

Figures

Figure 1.
Figure 1.. BRCA1 deficiency promotes GPX4i-induced ferroptosis.
(A, B) Cell death (A) or lipid peroxidation (B) in Cas9 control or BRCA1-sgRNA–infected HT1080, SKOV3, HEY, HS578T, or RPMI-7951 cells treated with or without RSL3. (C, D) Cell viability in Cas9 control or BRCA1-sgRNA–infected HT1080 (C), SKOV3 (C), or DLD-1 (D) cells treated with RSL3 for 24 or 8 hours. (E) Cell viability in control or BRCA1-reconstituted UWB1.289 cells treated with RSL3 for 24 hours. (F) Cell death in Cas9 control or BRCA1-sgRNA–infected SKOV3 cells treated with 2.5μM RSL3 for 24 hours, following pretreatment with 10μM Z-VAD-FMK, 5μM ferrostatin-1, or 100μM DFO. (G-I) Cell viability in Cas9 control or BRCA1-sgRNA–infected HT1080 cells treated with ML210 (G), JKE-1674 (H), and ML162 (I) for 24 hours. (J-L) Cell death in Cas9 control or BRCA1-sgRNA–infected SKOV3 cells treated with 5μM ML210 (J), 10μM JKE-1674 (K), or 2μM ML162 (L) for 24 hours, following pretreatment with 5μM ferrostatin-1. (M) Cell viability in Cas9 control or BRCA2-sgRNA–infected HT1080 cells treated with RSL3 for 24 hours. Data are presented as mean ± standard deviation, n = 3 independent repeats. Unpaired two-tailed t-test or two-way ANOVA analysis; *P < 0.05, **P < 0.01, ***P < 0.001, ****P < 0.0001, ns, not significant.
Figure 2.
Figure 2.. BRCA1 deficiency promotes GPX4i-induced ferroptosis via interference with GPX4 transcription.
(A, B) GPX4 protein levels in control, BRCA1-sgRNA–infected cells, BRCA1-deficient clones, or BRCA1-reconstituted cells. (C) GPX4 protein levels in HS578T cells with Cas9 control, BRCA1-sgRNA infection, or BRCA1-sgRNA infection supplemented with GPX4. (D) Cell death in HS578T cells with Cas9 control, BRCA1-sgRNA infection, or BRCA1-sgRNA infection supplemented with GPX4 after treatment with 5μM RSL3 for 24 hours. (E, F) GPX4 mRNA levels (E) and GPX4 promoter-luciferase activity (F) in Cas9 control or BRCA1-sgRNA–infected HS578T or 293T cells. (G-I) GPX4 mRNA levels (G), BRCA1 and GPX4 protein levels (H), and GPX4 promoter-luciferase activity (I) in Cas9 control or BRCA1-sgRNA–infected HT1080, HS578T (G, H) or 293T (I) cells expressing empty vector, WT BRCA1 construct, or mutant BRCA1 construct (C61G or M1775R). (J) Cell death in Cas9 control or BRCA1-sgRNA–infected HS578T cells expressing empty vector, WT BRCA1 construct, or mutant BRCA1 construct (C61G or M1775R) after treatment with 5μM RSL3 for 24 hours. (K) BRCA1 ChIP-seq profiles from GEO datasets (GSE31477 and GSE111905) showing the BRCA1 binding sites (BS) at the GPX4 promoter region. (L) ChIP analyses confirming the binding sites (BS) of BRCA1 at GPX4 promoter region in HS578T cells. (M) ChIP analyses showing GPX4 promoter enrichment in Cas9 control or BRCA1-sgRNA–infected HS578T cells expressing empty vector, WT BRCA1 construct, or mutant BRCA1 construct (C61G, M1775R, A1708E, or P1749R). (N) Schematic depicting how BRCA1 regulates GPX4 transcription and GPX4i–induced ferroptosis. See main text for a detailed description. Data are presented as mean ± standard deviation, n = 3 independent repeats. Unpaired two-tailed t-test; *P < 0.05, **P < 0.01, ***P < 0.001, ****P < 0.0001, ns, not significant.
Figure 3.
Figure 3.. BRCA1 deficiency suppresses erastin-induced ferroptosis without blocking sulfasalazine or cystine starvation.
(A) Cell death in Cas9 control or BRCA1-sgRNA–infected HT1080 or HEY cells treated with 2.5μM or 5μM erastin for 24 hours. (B) Cell viability in Cas9 control or BRCA1-sgRNA–infected HT1080 or HEY cells treated with indicated concentrations of erastin for 24 hours. (C) Lipid peroxidation in Cas9 control or BRCA1-sgRNA–infected HT1080 or HEY cells treated with erastin. (D) Cell viability in Cas9 control or BRCA1-sgRNA–infected HT1080 cells treated with 7.5μM erastin for 24 hours, following pretreatment with 10μM Z-VAD-FMK, 5μM ferrostatin-1, or 100μM DFO. (E) Cell viability in Cas9 control cells, BRCA1-sgRNA–infected cells, or BRCA1-sgRNA–infected cells with WT BRCA1 re-expression after treatment with 2.5μM erastin for 24 hours. (F-H) Cell viability in Cas9 control or BRCA1-sgRNA–infected HT1080 or HEY cells treated with indicated concentrations of IKE (F), sulfasalazine (G), or cystine-free medium (H) for 24 hours. (I-L) Cell viability in Cas9 control or BRCA2-sgRNA–infected HT1080 cells treated with indicated concentrations of erastin (I), IKE (J), sulfasalazine (K), or cystine-free medium (L) for 24 hours. Data are presented as mean ± standard deviation, n = 3 independent repeats. Unpaired two-tailed t-test or two-way ANOVA analysis; *P < 0.05, **P < 0.01, ***P < 0.001, ****P < 0.0001, ns, not significant.
Figure 4.
Figure 4.. BRCA1 deficiency suppresses erastin-induced ferroptosis via interference with VDAC3 transcription and mitochondrial lipid peroxidation.
(A) VDAC3, VDAC2, and VDAC1 protein levels in Cas9 control or BRCA1-sgRNA–infected HT1080 cells. (B) VDAC3 mRNA levels in Cas9 control or BRCA1-sgRNA–infected HT1080 cells. (C) VDAC3 protein levels in Cas9 control or VDAC3-sgRNA–infected HT1080 cells. (D) Cell viability in Cas9 control or VDAC3-sgRNA–infected HT1080 cells treated with indicated concentrations of erastin for 24 hours. (E) Cell viability in Cas9 control or VDAC3-sgRNA–infected HT1080 cells treated with indicated concentrations of IKE for 24 hours. (F) Lipid peroxidation in Cas9 control or VDAC3-sgRNA–infected HT1080 cells treated with erastin. (G, H) Cell viability in Cas9 control or VDAC3-sgRNA–infected HT1080 cultured in cystine-free medium (G) or treated with indicated concentrations of sulfasalazine for 24 hours (H). (I) BRCA1 and VDAC3 protein levels in Cas9 control, BRCA1-sgRNA–, VDAC3-sgRNA–, or BRCA1-sgRNA+VDAC3-sgRNA–infected HT1080 cells. (J) Cell viability in Cas9 control, VDAC3-sgRNA–infected, BRCA1-sgRNA–infected, or BRCA1-sgRNA+VDAC3-sgRNA–infected HT1080 cells treated with indicated concentrations of erastin for 24 hours. (K) BRCA1 ChIP-seq profiles from GEO datasets (GSE31477) showing a sharp peak of BRCA1 binding at the site of the VDAC3 gene promoter. (L) ChIP analyses confirming the BRCA1 binding on VDAC3 promoter in HT1080 cells. (M, N) Mitochondrial lipid peroxidation in Cas9 control, BRCA1-sgRNA–infected (M), or VDAC3-sgRNA–infected (N) HT1080 cells treated with erastin. (O) Cell viability in Cas9 control, VDAC3-sgRNA–infected, or BRCA1-sgRNA–infected HT1080 cells with indicated treatment for 24 hours. Data are presented as mean ± standard deviation, n = 3 independent repeats. Unpaired two-tailed t-test or two-way ANOVA analysis; **P < 0.01, ***P < 0.001, ****P < 0.0001, ns, not significant.
Figure 5.
Figure 5.. PARPi synergize with GPX4i in BRCA1-deficient cancers via ferroptosis.
(A, B) Cell viability in control or BRCA1-reconstituted UWB1.289 cells treated with PARPi (olaparib or niraparib, 42 hours) and/or RSL3 (18 hours). (C, D) Cell viability in BRCA1-sgRNA–infected or control HS578T cells treated with olaparib (42 hours) and/or RSL3 (18 hours). (E) Synergy scores from the Bliss independence model indicating the combination effects of PARPi and RSL3 in cells featured in panels A-D. (F, G) Cell viability in indicated BRCA1-mutant cancer cells (F), BRCA1–WT breast epithelial cells (G), or BRCA1–WT cancer cells (G) treated with olaparib (42 hours) and/or RSL3 (18 hours). (H) Synergy scores from the Bliss independence model indicating the combination effects of olaparib and RSL3 in cells featured in panel F and G. (I) Cell death in UWB1.289, HCC1937, or SUM149 cells treated with 10μM olaparib (36 hours) and/or 1μM RSL3 (12 hours) in the absence or presence of 5μM ferrostatin-1. (J) Cell death in HCC1937 cells treated with 10μM olaparib (36 hours) and/or 1μM RSL3 (12 hours) in the absence or presence of 5μM Z-VAD, 2μM Nec-1s, or 2μM liproxstatin-1. (K) Cell death in Cas9 control or BRCA1–sgRNA-infected SKOV3 cells treated with 10μM olaparib (48 hours), 5μM niraparib (48 hours), and/or 5μM JKE-1674 (24 hours) in the absence or presence of 5μM ferrostatin-1. (L) Cell death in indicated cells treated with 10μM olaparib (48 hours) and/or JKE-1674 (5μM for SUM149, MCF10A, HS578T and 3μM for HCC1937; 24 hours) in the absence or presence of 5μM ferrostatin-1. (M, N) Tumor volumes of Cas9 control (M) or BRCA1-sgRNA–infected (N) SKOV3 xenografts with indicated treatments over time. (O) 53BP1 and GPX4 protein levels in Cas9 control or 53BP1-sgRNA–infected UWB1.289 cells. (P-R) Cell viability in Cas9 control or 53BP1-sgRNA–infected UWB1.289 cells treated with RSL3 (18 hours) and/or olaparib (42 hours). (S) Synergy scores from the Bliss independence model indicating the combination effects of PARPi and RSL3 in Cas9 control or 53BP1-sgRNA–infected UWB1.289 cells featured in panel Q and R. Data are presented as mean ± standard deviation, n = 3 independent repeats (n = 7-8 independent tumors for panel M or N). Data in panel E, H or S are presented as violin plots with median and interquartile range, n = 3 or 10 dose combinations per cell line. Unpaired two-tailed t-test or two-way ANOVA analysis; *P < 0.05, **P < 0.01, ***P < 0.001, ****P < 0.0001, ns, not significant.
Figure 6.
Figure 6.. NCOA4-mediated ferritinophagy coupled with defective GPX4 induction contributes to the synergy of PARPi and GPX4i in BRCA1-deficient cancer cells.
(A-D) NCOA4 and LC3II protein levels in HCC1937 (A, B) or SUM149 (C, D) cells treated with olaparib or niraparib. (E, F) NCOA4 mRNA levels in HCC1937 (E) or SUM149 (F) cells treated with niraparib or olaparib. (G, H) Labile iron pool in HCC1937 (G) or SUM149 (H) cells treated with 10μM olaparib or 5μM niraparib. (I) NCOA4 protein levels in Cas9 control or NCOA4- sgRNA–infected HCC1937 cells treated with 10μM olaparib. (J, K) Labile iron pool (J) or lipid peroxidation (K) in Cas9 control or NCOA4-sgRNA–infected HCC1937 cells treated with 10μM olaparib. (L) Cell death in Cas9 control or NCOA4-sgRNA–infected HCC1937 cells treated with 10μM olaparib (36 hours) and/or 1μM RSL3 (12 hours). (M) Lipid peroxidation in HCC1937 cells treated with 10μM olaparib or 5μM niraparib in the absence or presence of 100μM DFO. (N) Cell death in HCC1937 cells treated with 10μM olaparib (36 hours), 5μM niraparib (36 hours), and/or 1μM RSL3 (12 hours) in the absence or presence of 100μM DFO. (O-P) GPX4 or p-H2AX protein levels in HCC1937 cells (O), SUM149 cells (O), or BRCA1-sgRNA–infected or Cas9 control HS578T cells (P) treated with olaparib. (Q) GPX4 protein levels in Cas9 control or GPX4–sgRNA-infected HS578T cells. (R) Cell death in Cas9 control or GPX4-sgRNA–infected HS578T cells treated with 10μM olaparib for 48 hours in the absence or presence of 5μM ferrostatin-1. (S) GPX4 protein levels in empty vector- or GPX4-expressing SUM149 cells. (T) Cell death in empty vector- or GPX4-expressing SUM149 cells treated with 10μM olaparib (42 hours) and/or 2.5μM RSL3 (18 hours). (U) Schematic depicting mechanisms underlying the synergy between PARPi and GPX4i in BRCA1-deficent cells. See main text for a detailed description. Data are presented as mean ± standard deviation, n = 3 independent repeats. Unpaired two-tailed t-test; **P < 0.01, ***P < 0.001, ****P < 0.0001, ns, not significant.
Figure 7.
Figure 7.. GPX4i overcome resistance to PARPi in BRCA1-mutant tumors.
(A) Schematic of the orthotopic implantation model for cell line–derived xenografts (CDXs) and PDXs. (B-E) Kaplan-Meier survival plots or individual tumor volume plots for mice with 18-S PDXs (B, C; n=8) or 17-S PDXs (D, E; n=8) in the indicated treatment groups. (F-H) Tumor volumes of BRCA1-mutant 18-S PDXs (F; n=6-7), 27-S PDXs (G; n=8-10), or HCC1937 xenografts (H; n=10) with indicated treatments over time. Data are presented as mean ± standard deviation. (I) Tumor volumes of BRCA1-WT PIM224 PDXs with indicated treatments over time. Data are presented as mean ± standard deviation, n=7-8. (J) Representative GPX4 or NCOA4 immunochemistry staining images from 18-S PDXs, 27-S PDXs, or PIM224 PDXs treated with or without olaparib. Scale bars, 50 μm. (K) Immunochemistry scoring of GPX4 or NCOA4 staining in 18-S PDXs, 27-S PDXs, or PIM224 PDXs treated with or without olaparib, n=6 randomly selected magnification fields. (L) Immunochemistry scoring of 4-HNE staining in 18-S PDXs, 27-S PDXs, or PIM224 PDXs with indicated treatments, n=6 randomly selected magnification fields. (M) Schematic depicting the dual role of BRCA1 in ferroptosis regulation by governing GPX4 or VDAC3 transcription. (N) Schematic depicting the vulnerability of BRCA1-deficient cancer to PARP and GPX4 co-inhibition and its underlying mechanisms. Data in panel K or L are presented as violin plots with median and interquartile range. Unpaired two-tailed t-test, two-way ANOVA analysis, or log-rank test; *P < 0.05, **P < 0.01, ***P < 0.001, ****P < 0.0001, ns, not significant.

Similar articles

Cited by

References

    1. Roy R, Chun J, Powell SN. BRCA1 and BRCA2: different roles in a common pathway of genome protection. Nat Rev Cancer 2011;12(1):68–78 doi 10.1038/nrc3181. - DOI - PMC - PubMed
    1. Mersch J, Jackson MA, Park M, Nebgen D, Peterson SK, Singletary C, et al. Cancers associated with BRCA1 and BRCA2 mutations other than breast and ovarian. Cancer 2015;121(2):269–75 doi 10.1002/cncr.29041. - DOI - PMC - PubMed
    1. Huen MS, Sy SM, Chen J. BRCA1 and its toolbox for the maintenance of genome integrity. Nat Rev Mol Cell Biol 2010;11(2):138–48 doi 10.1038/nrm2831. - DOI - PMC - PubMed
    1. Savage KI, Harkin DP. BRCA1, a ‘complex’ protein involved in the maintenance of genomic stability. FEBS J 2015;282(4):630–46 doi 10.1111/febs.13150. - DOI - PubMed
    1. Bryant HE, Schultz N, Thomas HD, Parker KM, Flower D, Lopez E, et al. Specific killing of BRCA2-deficient tumours with inhibitors of poly(ADP-ribose) polymerase. Nature 2005;434(7035):913–7 doi 10.1038/nature03443. - DOI - PubMed

MeSH terms

Substances

LinkOut - more resources