. 2024 Aug 2;14(8):1418-1439.
doi: 10.1158/2159-8290.CD-23-1300.

Spatially Segregated Macrophage Populations Predict Distinct Outcomes in Colon Cancer

Affiliations

Spatially Segregated Macrophage Populations Predict Distinct Outcomes in Colon Cancer

Magdalena Matusiak et al. Cancer Discov. .

Abstract

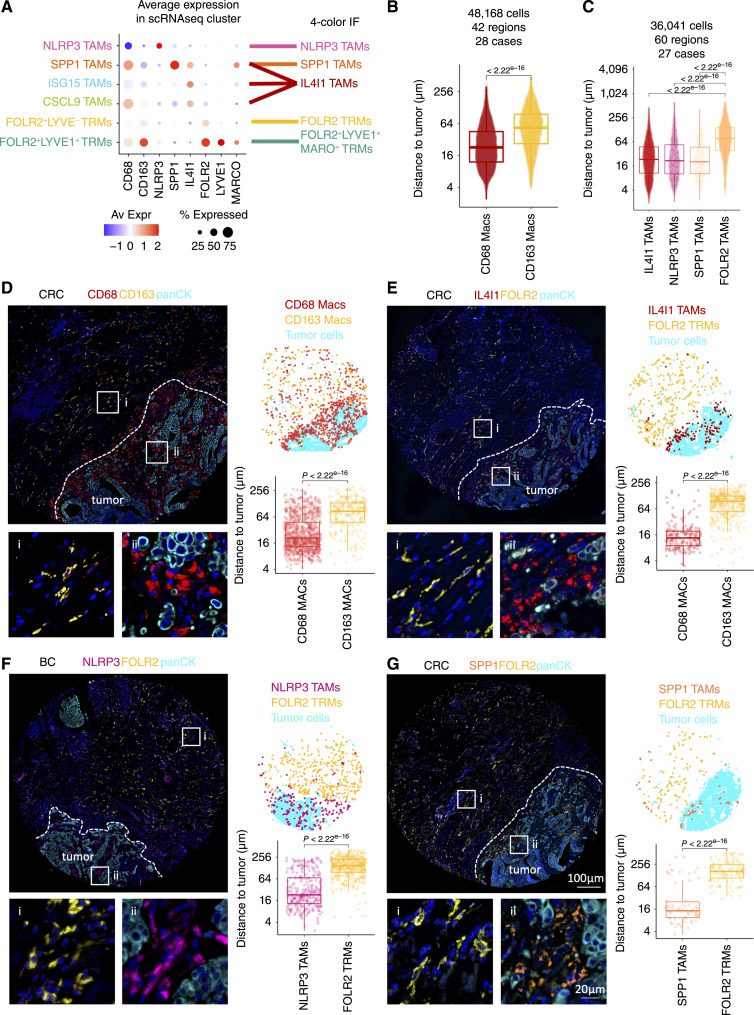
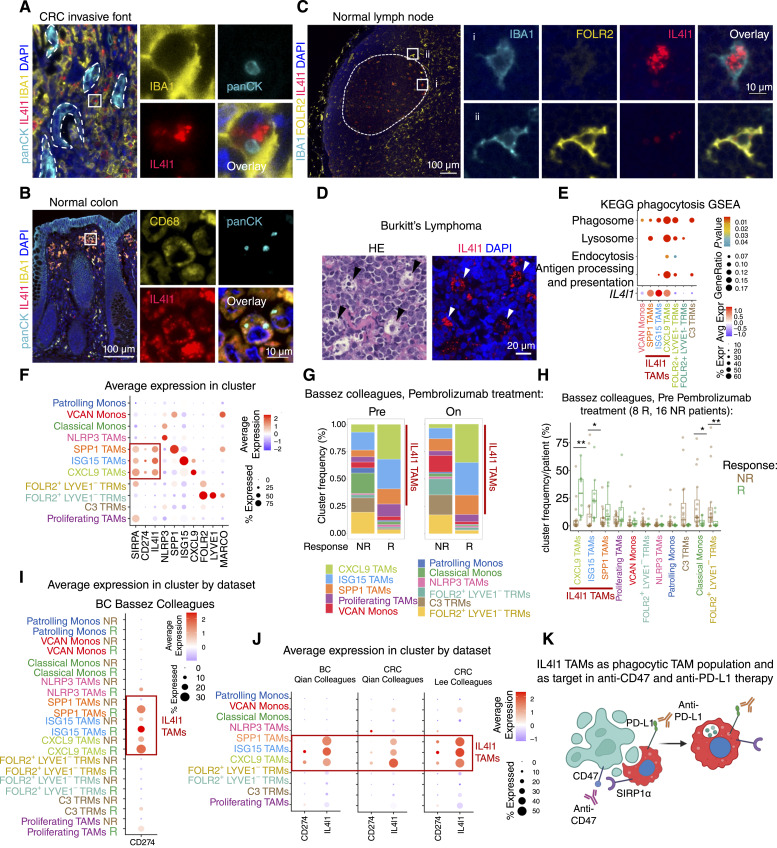
Tumor-associated macrophages are transcriptionally heterogeneous, but the spatial distribution and cell interactions that shape macrophage tissue roles remain poorly characterized. Here, we spatially resolve five distinct human macrophage populations in normal and malignant human breast and colon tissue and reveal their cellular associations. This spatial map reveals that distinct macrophage populations reside in spatially segregated micro-environmental niches with conserved cellular compositions that are repeated across healthy and diseased tissue. We show that IL4I1+ macrophages phagocytose dying cells in areas with high cell turnover and predict good outcome in colon cancer. In contrast, SPP1+ macrophages are enriched in hypoxic and necrotic tumor regions and portend worse outcome in colon cancer. A subset of FOLR2+ macrophages is embedded in plasma cell niches. NLRP3+ macrophages co-localize with neutrophils and activate an inflammasome in tumors. Our findings indicate that a limited number of unique human macrophage niches function as fundamental building blocks in tissue. Significance: This work broadens our understanding of the distinct roles different macrophage populations may exert on cancer growth and reveals potential predictive markers and macrophage population-specific therapy targets.


Conflict of interest statement

M. Matusiak reports grants from NIH, and grants from D.K. Ludwig Fund for Cancer Research during the conduct of the study. M. van de Rijn reports grants from NIH during the conduct of the study. No disclosures were reported by the other authors.

Figures

Figure 1.
Figure 1.
Identification of macrophage subset markers by single-cell RNA sequencing. A and B, Flow charts of experimental design. C, UMAP projection of monocyte and macrophage scRNA transcriptomes from four studies colored by annotated populations (left) and a breakdown of cells, samples, and patient numbers by study (right). D, Dotplot of average marker gene expression per scRNA myeloid population. Highlighted in bold are six markers for which FFPE-compatible antibodies were identified. E, Volcano plot shows top differentially expressed genes between FOLR2+, LYVE1 and FOLR2+, LYVE1+ TRMs. F, Barplot of the ratio of log2 average fractional scRNA myeloid population enrichment between colorectal cancer and breast cancer in tumor samples with more than 35 monocytes and macrophages detected. G, Immunofluorescence images show overlap of the established FFPE antibodies and CD68, confirming their reactivity with macrophages.
Figure 2.
Figure 2.
FOLR2, IL4I1, NLRP3, and SPP1 mark spatially distinct macrophage niches in the TME. A, Dotplot shows average macrophage marker expression in scRNA macrophage populations and indicates which scRNA macrophage populations are detectable in four-color IF staining by anti-NLRP3, -SPP1, -IL4I1, -FOLR2, and a combination of anti-FOLR2, -LYVE1, and -MARCO antibodies. B, Distance (μm) of CD68 and CD63 macrophages to the closest tumor cell. C, Distance (μm) of IL4I1 TAMs, NLRP3 TAMs, SPP1 TAMs, FOLR2 TAMs to the closest tumor cell. B and C, Cells were identified on CODEX images, P values were calculated with a linear mixed-effect model with Bonferroni’s corrections for multiple comparisons. D–G, Left: CODEX image (D) or Immunofluorescence (IF) images (E–G) show the distribution of CD68 and CD163 (D), or FOLR2 and IL4I1 (E), NLRP3 (F), SPP1 (G) protein expression in representative cases of colorectal cancer (D, E, G) and breast cancer (F). PanCK marks tumor cells. Close-up images on the (bottom) correspond to boxed regions on the (top). Top right: Scatterplots show the distribution of CD68 Macs, CD163 Macs, FOLR2 TRMs, IL4I1 TAMs, NLRP3 TAMs, SPP1 TAMs corresponding to IF images on the (left). Bottom right: Boxplots show the distance quantification of each macrophage to the closest tumor cell corresponding cells identified on IF images on the (left). Pairwise comparisons were determined using a two-sided Wilcoxon rank-sum test on 1,092 (D) 580 (E), 739 (F), and 203 (G) cells.
Figure 3.
Figure 3.
IL4I1, FOLR2, LYVE1, and MARCO label spatially segregated TRM niches in normal colon and breast. A, The schematic shows the distribution of TRM populations in normal colon mucosa and submucosa (left) and around normal breast glands (right). B and C, IF images show three TRM layers marked by IL4I1, FOLR2, and LYVE1 in normal colon mucosa and submucosa. Note that LYVE1 also stains normal lymph vessels. D, IF image shows that FOLR2+, LYVE1+ TRMs in normal colon submucosa are MARCO+. E and F, IF images show TRMs in normal breast marked by FOLR2, LYVE1, and MARCO, depending on whether they are lobular (i) or PV (ii). B–F, Close-up images correspond to boxed regions. The scale bar of 10 μm is identical for all close-up images.
Figure 4.
Figure 4.
IL4I1 marks phagocytosing macrophages. A, IF images of invasive front of colorectal cancer stained with IL4I1, IBA1, panCK, and DAPI show the presence of panCK+ material within IL4I1 macrophages. B, Same as (A) but stained with IL4I1, CD68 and panCK in normal colon mucosa. C, IF images of normal Lymph node stained with IL4I1, FOLR2, IBA1, and DAPI. (i) is a close-up image of a germinal center TBM, (ii) is a close-up image of interfollicular FOLR2 TRMs. (A–C) Close-up images on the (right) correspond to the boxed region on the (left). D, Images of TBMs in Burkitt’s lymphoma stained with left: H&E and right: IL4I1 and DAPI. E, Top: KEGG pathways enrichment analysis of phagocytosis-related pathways across scRNA macrophage populations. Populations with no significantly enriched pathways were omitted. Bottom: average IL4I1 gene expression across scRNA macrophage populations with enriched phagocytosis-related gene sets. F, Dotplot shows average gene expression in scRNA macrophage populations. G, Barplots show frequency of scRNA monocyte and macrophage clusters in dataset from Bassez and colleagues (23), stratified by response to pembrolizumab and time of sample collection. H, Boxplots show frequency of scRNA monocyte and macrophage clusters pre pembrolizumab treatment from Bassez and colleagues (23) (I and J) Same as (F) but from (I) Bassez and colleagues dataset (23), and (J) across Qian and colleagues (22) and Lee and colleagues (21) datasets. K, Schematic illustrating IL4I1 TAM association with cell death and efferocytosis and highlighting IL4I1 TAMs as potential anti-CD47 (indirect as IL4I1 TAMs express CD47 ligand-SIRP1α) and anti-PD-L1 (direct) therapy targets.
Figure 5.
Figure 5.
CODEX reveals spatial cellular interactions in macrophage niches within colon and breast cancer tissues. A, Schematic shows CODEX imaging and cellular neighborhood analysis workflow. B, Heatmap shows CODEX cell types (x axis) enrichment (color) in the identified cellular neighborhoods (y axis). C, Boxplot shows distance (μm) to the closest tumor cell for every macrophage identified by CODEX labeled by the neighborhood it belongs to. D, Barplot shows a percentage of the epithelial cells occupied in each CODEX macrophage neighborhood. E, Barplot presents the frequency of CODEX macrophage neighborhoods grouped by anatomical location. CT, center of tumor colorectal cancer; DCIS, ductal carcinoma in situ breast; IDC, invasive ductal carcinoma breast; IF, invasive front colorectal cancer; NB, normal breast; NGI, normal GI tract. F, Schematic shows cellular macrophage neighborhood organization and closeness to the tumor.
Figure 6.
Figure 6.
SPP1 TAMs are enriched in hypoxic and necrotic tumor areas and NLRP3 TAMs activate NLRP3 inflammasome in the TME. A, Immunohistochemical image shows NLRP3 TRMs surrounded by neutrophils (arrowheads). B, Immunohistochemical image shows SPP1 TRMs surrounded by karyorrhectic debris in necrotic material (arrowheads). C, Volcano plot shows differential gene expression between scRNA transcriptomes of SPP1 TAMs and NLRP3 TAMs. D, Dotplot of average expression of genes associated with neutrophil chemoattraction, lipid metabolism and phagocytosis across scRNA macrophage populations. E, Dotplot shows the annotation of tumor (green) and necrotic (brown) areas (top left) and normalized expression of SPP1 (top right) and NLRP3 (bottom right) on the 10× Visium FFPE Human Breast Cancer sample, and barplot shows normalized log2 SPP1 expression in tumor and necrosis regions (bottom left). F, IF shows a representative breast cancer region stained with NLRP3, CD68, Calprotectin (CPTN), and DAPI. Scale bar of 10 μm is identical for all close-up images. G, Quantification of the number of neutrophils present on nine breast cancer 1.5 mm2 tissue regions stratified by whether they contained diffuse NLRP3 (three regions) or NLRP3 specks (six regions). P value was computed using a two-sided Wilcoxon’s rank-sum test. H, Schematic of a possible mechanism through which NLRP3 TAMs can contribute to the recruitment of neutrophils in the TME. I, Sina plots show marker protein expression profiled using CosMx SMI 64-plex Human Immuno-Oncology Protein Panel.
Figure 7.
Figure 7.
IL4I1 TAM infiltration predicts good and SPP1 TAM infiltration predicts bad outcome in colorectal cancer. A, IF image shows spatial distribution of SPP1 and IL4I1 staining in colorectal cancer. B, Heatmap shows normalized IF intensity in cells annotated as IL4I1 TAMs, SPP1 TAMs, and IL4I1+SPP1+ double-positive TAMs. C–D, Total proportion (C) and proportion by tissue region (D) of IL4I1 TAMs, SPP1 TAMs, and IL4I1+SPP1+ double-positive TAMs detected in 254 0.5 mm2 tissue regions spanning 135 patients with colorectal cancer. E, IF image of a single tissue core from TA118 used for outcome analysis in (H), shows CD68 and IL4I1 protein expression in cells annotated as IL4I1 TAMs. F, IF image of a single-tissue core from TA118 used for outcome analysis in (I), shows CD68 and SPP1 protein expression in cells annotated as SPP1 TAMs. G–I, Kaplan–Meier plot of samples from patients with colorectal cancer stratified by normalized count of IL4I1 TAMs (G and H) or SPP1 TAMs (I). Presented are 40% (top) and 40% (bottom) cases.

References

    1. Gordon S, Plüddemann A. Tissue macrophages: heterogeneity and functions. BMC Biol 2017;15:53. - PMC - PubMed
    1. DeNardo DG, Ruffell B. Macrophages as regulators of tumour immunity and immunotherapy. Nat Rev Immunol 2019;19:369–82. - PMC - PubMed
    1. Lazarov T, Juarez-Carreño S, Cox N, Geissmann F. Physiology and diseases of tissue-resident macrophages. Nature 2023;618:698–707. - PMC - PubMed
    1. Fridman WH, Zitvogel L, Sautès-Fridman C, Kroemer G. The immune contexture in cancer prognosis and treatment. Nat Rev Clin Oncol 2017;14:717–34. - PubMed
    1. Papadopoulos KP, Gluck L, Martin LP, Olszanski AJ, Tolcher AW, Ngarmchamnanrith G, et al. . First-in-human study of AMG 820, a monoclonal anti-colony-stimulating factor 1 receptor antibody, in patients with advanced solid tumors. Clin Cancer Res 2017;23:5703–10. - PubMed

LinkOut - more resources