. 2024 Mar 29;10(13):eadk0858.
doi: 10.1126/sciadv.adk0858. Epub 2024 Mar 29.

Antiviral memory B cells exhibit enhanced innate immune response facilitated by epigenetic memory

Affiliations

Antiviral memory B cells exhibit enhanced innate immune response facilitated by epigenetic memory

Xiping Zhu et al. Sci Adv. .

Abstract

The long-lasting humoral immunity induced by viral infections or vaccinations depends on memory B cells with greatly increased affinity to viral antigens, which are evolved from germinal center (GC) responses. However, it is unclear whether antiviral memory B cells represent a distinct subset among the highly heterogeneous memory B cell population. Here, we examined memory B cells induced by a virus-mimicking antigen at both transcriptome and epigenetic levels and found unexpectedly that antiviral memory B cells exhibit an enhanced innate immune response, which appeared to be facilitated by the epigenetic memory that is established through the memory B cell development. In addition, T-bet is associated with the altered chromatin architecture and is required for the formation of the antiviral memory B cells. Thus, antiviral memory B cells are distinct from other GC-derived memory B cells in both physiological functions and epigenetic landmarks.


Figures

Fig. 1.
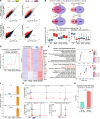
Fig. 1.. Memory B cells induced by Qβ-VLP evolve with progressive accumulation of SHM and an increase in affinity.
(A) Splenocytes were collected from mice immunized with Qβ-VLP at the indicated time points. Representative flow cytometry data from mice immunized 5 months previously show the gating strategy for Qβ+ MemB and Qβ+ IgM+ B, along with the staining of CD73 and PD-L2 in Qβ+ MemB. (B) Representative histograms show the down-regulation of CD23 and up-regulation of CD80 and Fcrl5 in Qβ+ MemB at 5 months after immunization compared with naïve B cells. (C) Single Qβ+ MemB sorted at the indicated time points underwent sequencing of the variable region of the heavy chain (VH). Mutations resulting in amino acid changes are quantified. (D) The affinity of Qβ+ MemB to Qβ-VLP was measured by competitive inhibition at the indicated time points. The half-maximal inhibitory concentrations (IC50) are plotted over time. (E) Qβ+ MemB collected at 5 to 7 months after immunization underwent RNA-seq. Qβ+ MemB versus NB DEGs are highlighted in the volcano plot based on expression change (|Log2FoldChange| > 2) and statistical significance (–Log10P value >16). Genes of interest are circled. (F) GSEA showing the enrichment of human swIg+ memory B cell–specific genes in Qβ+ MemB versus NB DEGs (see also figs. S1 and S2).
Fig. 2.
Fig. 2.. Previous experiences of memory B cells are recorded as epigenetic memory.
(A) NB and Qβ+ B cell subsets collected at the indicated time points from mice immunized with Qβ-VLP once or twice underwent RNA-seq and ATAC-seq. PCA of RNA-seq and ATAC-seq data for the indicated cell groups are shown. (B to F) MemB versus NB open DARs are grouped by k-means clustering based on their accessibility at the indicated cell stages. Normalized peak reads (Z score) are shown in a heatmap (B) or as means of each cluster (C). (D) Examples of genes associated with one or multiple MemB versus NB DARs. Genes labeled in colors are further presented for their expression changes in (E). (F) Tcf7 serves as an example demonstrating the progressive increases in chromatin accessibility in nearby regulatory regions. Gray stripes indicate MemB versus NB DARs (see also figs. S3 to S5).
Fig. 3.
Fig. 3.. Epigenetic alterations predispose Qβ+ MemB to enhanced transcription of antiviral genes upon antigen re-challenge.
(A) DEGs (|Log2FoldChange| > 1) and DARs (|Log2FoldChange| > 0.5) induced in primary (NB6h versus NB) and secondary (MemB6h versus MemB) responses to Qβ-VLP are highlighted in correlation plots of gene expression and peak accessibility (expressed as Log2FPKM). (B) Venn diagrams show overlaps between the primary and secondary response-induced DEGs or DARs. (C) DARs specific to the primary response are analyzed for peak accessibility at the indicated cell stages, presented as boxplots of normalized reads. (D) Combined up-regulated DEGs from the primary and secondary responses are clustered into two groups by the k-means algorithm, with cluster 1 genes being commonly up-regulated in both primary and secondary responses and cluster 2 genes exhibiting enhanced transcription in the secondary response. Representative genes from cluster 2 are listed. (E) Top 10 over-represented GO terms of biological pathways from cluster 1 and cluster 2 genes. (F and G) Examples of cytokines and chemokines up-regulated in the secondary response to Qβ-VLP (F), with pre-existing chromatin accessibility changes in the quiescent Qβ+ MemB (G). Gray stripes indicate MemB versus NB DARs. (H) The proportion of genes from cluster 1 or cluster 2 associated with MemB versus NB open DARs. Chi-square test was used for statistical analysis (***P < 0.001) (see also fig. S6).
Fig. 4.
Fig. 4.. The enhanced innate immune response in Qβ+ MemB is determined by the nature of immunogens.
(A) The diagram shows the regime for PE immunization. PE+ MemB are gated as indicated, and the staining of CD73 and PD-L2 in PE+ MemB is shown. (B) Expression levels of Ig isotypes and (C) common markers of memory B cells in Qβ+ and PE+ MemB. (D) Venn diagrams illustrate overlaps between MemB versus NB DEGs or MemB6h versus MemB DEGs induced by Qβ-VLP and PE. (E) Genes are selected from the overlapped MemB6h versus MemB DEGs [595 genes in (D)] induced by Qβ-VLP and PE, which exhibit enhanced transcription in the secondary responses compared with the Qβ-VLP–induced primary response (see also fig. S8E). (F) PCA of transcriptomes of the indicated cell groups. (G) Top 20 over-represented GO terms from Qβ-VLP versus PE specifically induced secondary response DEGs [788 genes in (D)]. (H) Venn diagram shows DEGs that are specific to the Qβ-VLP–induced secondary response. (I) Examples of genes from the 542 genes in (H) are shown for their expression levels (see also figs. S7 and S8).
Fig. 5.
Fig. 5.. T-bet is involved in maintaining the chromatin structures of Qβ+ MemB.
(A) Newly formed peaks from Qβ+ MemB versus NB DARs were subjected to motif enrichment analysis. The top five statistically significant motifs are shown. (B) The expression level of T-bet at the indicated cell stages of Qβ+ cells. (C) Progressive changes in chromatin accessibilities at the T-bet locus during the indicated cell stages. Gray stripes indicate Qβ+ MemB versus NB DARs. The conserved noncoding sequence (CNS) at +6 kb from the T-bet promoter overlaps with one of the indicated DARs. (D) A comparison of chromatin accessibility at the Tbx21 locus between Qβ+ MemB and PE+ MemB (see also fig. S9).
Fig. 6.
Fig. 6.. T-bet is required for the formation of Qβ+ MemB.
(A) Bone marrow chimeric mice derived from WT and T-bet KO mice were immunized with Qβ-VLP and examined 2 to 3 months later. Representative flow cytometry data show the relative contribution of each donor to the indicated Qβ+ cell groups. (B) Histogram of T-bet staining from the bone marrow chimeric mice as in (A). (C) Quantification of donor ratios for each indicated Qβ+ cell group, as in (A). NB are total naïve B cells without gating for antigen specificity. The fold changes of the donor ratios from NB to the indicated Qβ+ B cell groups are indicated in red letters. (D) Bone marrow chimeric mice were immunized and examined 2 to 3 weeks later. Surface IgDIgM (sIgDIgM) cells gated from Qβ+ B cells are further gated by different Ig isotypes as indicated. GL-7+ GCB and CD38+ MemB from each donor are then examined. (E) Quantification of MemB to GCB ratios for each isotype group as in (D). For (C) and (E), data from the same animal are connected by lines. A paired t test was used for statistical analysis (*P < 0.05, **P < 0.01, ***P < 0.001; ns, nonsignificant) (see also figs. S10 and S11).

Similar articles

Cited by

References

    1. Tarlinton D., Good-Jacobson K., Diversity among memory B cells: Origin, consequences, and utility. Science 341, 1205–1211 (2013). - PubMed
    1. Tangye S. G., Tarlinton D. M., Memory B cells: Effectors of long-lived immune responses. Eur. J. Immunol. 39, 2065–2075 (2009). - PubMed
    1. McHeyzer-Williams M., Okitsu S., Wang N., McHeyzer-Williams L., Molecular programming of B cell memory. Nat. Rev. Immunol. 12, 24–34 (2011). - PMC - PubMed
    1. Weill J. C., Le Gallou S., Hao Y., Reynaud C. A., Multiple players in mouse B cell memory. Curr. Opin. Immunol. 25, 334–338 (2013). - PubMed
    1. Kurosaki T., Kometani K., Ise W., Memory B cells. Nat. Rev. Immunol. 15, 149–159 (2015). - PubMed

Publication types

Substances