. 2024;98(4):1467-1482.
doi: 10.3233/JAD-231362.

Remote Associations Between Tau and Cortical Amyloid-β Are Stage-Dependent

Affiliations

Remote Associations Between Tau and Cortical Amyloid-β Are Stage-Dependent

Seyed Hani Hojjati et al. J Alzheimers Dis. 2024.

Abstract

Background: Histopathologic studies of Alzheimer's disease (AD) suggest that extracellular amyloid-β (Aβ) plaques promote the spread of neurofibrillary tau tangles. However, these two proteinopathies initiate in spatially distinct brain regions, so how they interact during AD progression is unclear.

Objective: In this study, we utilized Aβ and tau positron emission tomography (PET) scans from 572 older subjects (476 healthy controls (HC), 14 with mild cognitive impairment (MCI), 82 with mild AD), at varying stages of the disease, to investigate to what degree tau is associated with cortical Aβ deposition.

Methods: Using multiple linear regression models and a pseudo-longitudinal ordering technique, we investigated remote tau-Aβ associations in four pathologic phases of AD progression based on tau spread: 1) no-tau, 2) pre-acceleration, 3) acceleration, and 4) post-acceleration.

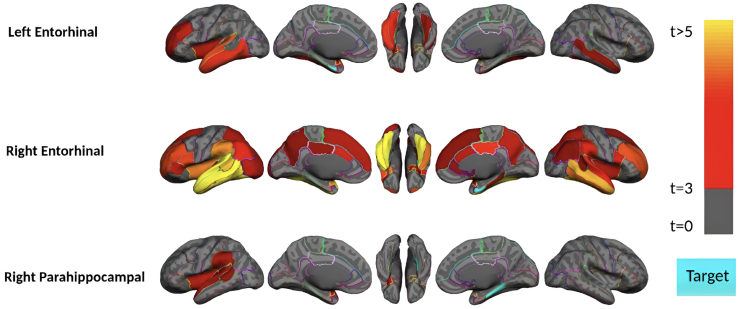
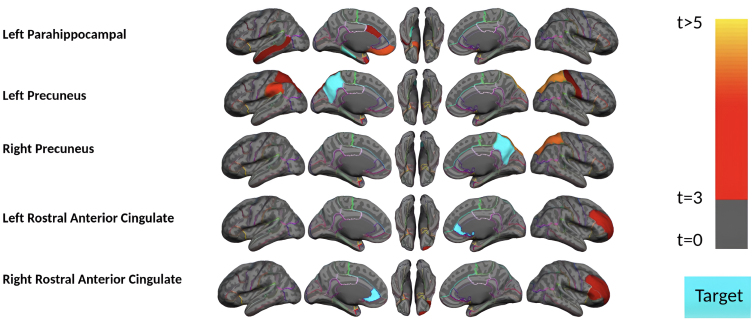
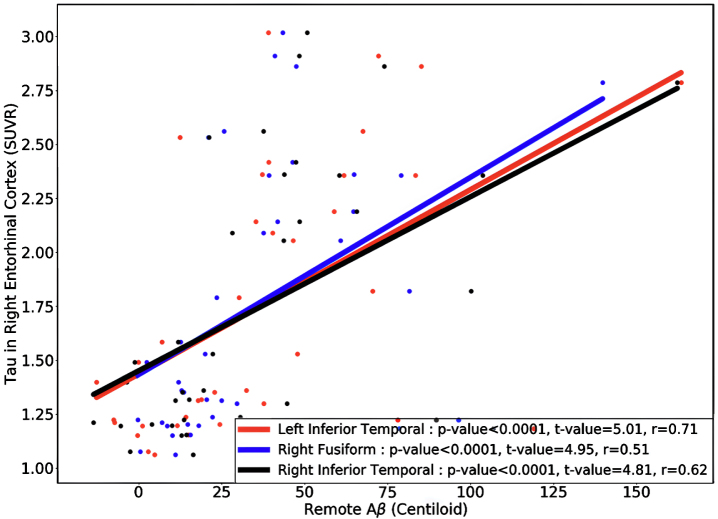
Results: No significant tau-Aβ association was detected in the no-tau phase. In the pre-acceleration phase, the earliest stage of tau deposition, associations emerged between regional tau in medial temporal lobe (MTL) (i.e., entorhinal cortex, parahippocampal gyrus) and cortical Aβ in lateral temporal lobe regions. The strongest tau-Aβ associations were found in the acceleration phase, in which tau in MTL regions was strongly associated with cortical Aβ (i.e., temporal and frontal lobes regions). Strikingly, in the post-acceleration phase, including 96% of symptomatic subjects, tau-Aβ associations were no longer significant.

Conclusions: The results indicate that associations between tau and Aβ are stage-dependent, which could have important implications for understanding the interplay between these two proteinopathies during the progressive stages of AD.

Keywords: Alzheimer’s disease; PET; amyloid-β; remote association; tau.


Conflict of interest statement

The authors have no conflict of interest to report.

Figures

Fig. 1
Fig. 1
The sequence of tau deposition in 572 elderly subjects based on young subjects’ regional cut-points. Subjects were sorted based on the number of tau-PET regions that exceeded the regional cut-points in the x-axis. Regions were also sorted by frequencies exceeding the regional cut-point across all subjects in the y-axis. The tau SUVR for the regions that exceed the regional cut-point is color-coded with a heat map; the blue color indicates the tau SUVR value equals 1, and the red color indicates the tau SUVR value higher than 2. Three thresholds were defined to separate the subjects into regions into four phases: no-tau, pre-acceleration, acceleration, and post-acceleration.
Fig. 2
Fig. 2
Region-wise statistical map (t-value) of remote association between tau deposition in three target regions and regional Aβ depositions in 67 cortical regions obtained in the pre-acceleration phase of tau deposition. The family-wise corrected t-value at each region is color-coded with red or yellow colors representing increasing positive t-values and overlaid on the semi-inflated cortical surface of the MNI152 template. The red color indicates the t-value is equal to 3, and the yellow color indicates the t-value is higher than 5. The target region is indicated as light blue.
Fig. 3
Fig. 3
Region-wise statistical map (t-value) of remote association between tau deposition in fourteen target regions and regional Aβ depositions in 67 cortical regions obtained in the acceleration phase of tau deposition. The family-wise corrected t-value at each region is color-coded with red or yellow colors representing increasing positive t-values and overlaid on the semi-inflated cortical surface of the MNI152 template. The red color indicates the t-value is equal to 3, and the yellow color indicates the t-value is higher than 5. The target region is indicated as light blue.
Fig. 4
Fig. 4
Region-wise statistical map (t-value) of remote association between tau deposition in five target regions and regional Aβ depositions in 67 cortical regions obtained the MCI and mild AD subject in the acceleration phase of tau deposition. The family-wise corrected t-value at each region is color-coded with red or yellow colors representing increasing positive t-values and overlaid on the semi-inflated cortical surface of the MNI152 template. The red color indicates the t-value is equal to 3, and the yellow color indicates the t-value is higher than 5. The target region is indicated as light blue.
Fig. 5
Fig. 5
Region-wise statistical map (t-value) of remote association between tau deposition in six target regions and regional Aβ depositions in 67 cortical regions obtained in the HC Aβ–and Aβ+ subjects in the acceleration phase of tau deposition. The family-wise corrected t-value at each region is color-coded with red or yellow colors representing increasing positive t-values and overlaid on the semi-inflated cortical surface of the MNI152 template. The red color indicates the t-value is equal to 3, and the yellow color indicates the t-value is higher than 5. The target region is indicated as light blue.
Fig. 6
Fig. 6
The regional multiple regression analysis results of right entorhinal cortex tau and three top-ranked associated remote regions Aβ: left inferior temporal, right fusiform, and right inferior temporal in 37 HC Aβ+ subjects in the acceleration phase. All these analyses survived family-wise error correction.

References

    1. Takahashi RH, Nagao T, Gouras GK (2017) Plaque formation and the intraneuronal accumulation of β-amyloid in Alzheimer’s disease. Pathol Int 64, 185–193. - PubMed
    1. Spillantini MG, Crowther RA, Goedert M (1996) Comparison of the neurofibrillary pathology in Alzheimer’s disease and familial presenile dementia with tangles. Acta Neuropathol 92, 42–48. - PubMed
    1. Duara R, Barker W (2022) Heterogeneity in Alzheimer’s disease diagnosis and progression rates: Implications for therapeutic trials. Neurotherapeutics 19, 8–25. - PMC - PubMed
    1. Hardy JA, Higgins GA (1992) Alzheimer’s disease: The amyloid cascade hypothesis. Science 256, 184–185. - PubMed
    1. Ricciarelli R, Fedele E (2017) The amyloid cascade hypothesis in Alzheimer’s disease: It’s time to change our mind. Curr Neuropharmacol 15, 926–935. - PMC - PubMed

MeSH terms