. 2024 Jun;11(22):e2400444.
doi: 10.1002/advs.202400444. Epub 2024 Mar 29.

Single-Nucleus Multiomic Analyses Identifies Gene Regulatory Dynamics of Phenotypic Modulation in Human Aneurysmal Aortic Root

Affiliations

Single-Nucleus Multiomic Analyses Identifies Gene Regulatory Dynamics of Phenotypic Modulation in Human Aneurysmal Aortic Root

Xuanyu Liu et al. Adv Sci (Weinh). 2024 Jun.

Abstract

Aortic root aneurysm is a potentially life-threatening condition that may lead to aortic rupture and is often associated with genetic syndromes, such as Marfan syndrome (MFS). Although studies with MFS animal models have provided valuable insights into the pathogenesis of aortic root aneurysms, this understanding of the transcriptomic and epigenomic landscape in human aortic root tissue remains incomplete. This knowledge gap has impeded the development of effective targeted therapies. Here, this study performs the first integrative analysis of single-nucleus multiomic (gene expression and chromatin accessibility) and spatial transcriptomic sequencing data of human aortic root tissue under healthy and MFS conditions. Cell-type-specific transcriptomic and cis-regulatory profiles in the human aortic root are identified. Regulatory and spatial dynamics during phenotypic modulation of vascular smooth muscle cells (VSMCs), the cardinal cell type, are delineated. Moreover, candidate key regulators driving the phenotypic modulation of VSMC, such as FOXN3, TEAD1, BACH2, and BACH1, are identified. In vitro experiments demonstrate that FOXN3 functions as a novel key regulator for maintaining the contractile phenotype of human aortic VSMCs through targeting ACTA2. These findings provide novel insights into the regulatory and spatial dynamics during phenotypic modulation in the aneurysmal aortic root of humans.

Keywords: FOXN3; Marfan syndrome; aortic root aneurysm; single‐nucleus multiomics; spatial transcriptomics.


Conflict of interest statement

The authors declare no conflict of interest.

Figures
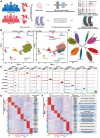
Figure 1
Figure 1
Single‐nucleus multiomic analysis reveals cell‐type‐specific expressed genes and accessible cCREs in aortic root tissues from MFS patients and healthy controls. A) Schematic representation of the procedure for generating the sequencing data. Aneurysmal aortic root tissues from MFS patients (n = 6) and normal aortic root tissues from heart transplantation recipients (n = 6) were collected. Samples from four subjects (two males and two females) of each group were individually subjected to single‐nucleus multiomic sequencing. Tissue sections from two subjects (one male and one female) of each group were subjected to spatial transcriptomic assays. MFS: Marfan syndrome; CTRL: control. B) Joint UMAP visualization of cell types and subclusters that represents the measurements of both gene expression and chromatin accessibility modalities. GEX: gene expression; ATAC: assay for transposase‐accessible chromatin. C) Gene expression and chromatin accessibility profiles for marker genes of each cell type/lineage. The promoter region is highlighted in gray. D) Hierarchical clustering of all the subclusters. The top 30 PCA components of the gene expression data and the 2–30 integrated LSI components of the chromatin accessibility data were considered. E) Heatmap showing the expression of cell‐type‐specific expressed genes. The significance threshold for gene expression was set to a log2(fold change) value > 0.5 and a p‐value adjusted for multiple testing < 0.05 (likelihood‐ratio test). F) Heatmap showing the accessibility of cell‐type‐specific assessable cCREs. The significance threshold for differential accessibility was set to a log2(fold change) value > 0.25 and a p‐value adjusted for multiple testing < 0.01 (logistic regression test). Top TF binding motifs and representative Gene Ontology terms (inferred by the tool GREAT) enriched for each cell type are shown. The significance threshold was set to a Bonferroni‐corrected p‐value < 0.05 (hypergeometric test). The cell‐type‐specific expressed genes or assessable cCREs were detected using the function “FindAllMarkers” of the Seurat package. FB: fibroblast; LEC: lymphatic endothelial cell; VEC: vascular endothelial cell; VSMC: vascular smooth muscle cell.
Figure 2
Figure 2
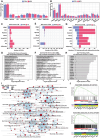
Cellular compositional alterations and cell‐type‐specific regulatory changes in MFS versus CTRL samples revealed by single‐nucleus multiomic analysis. A) Relative proportion of each cell type in the aortic root tissues from the MFS and CTRL groups. The data on the y‐axis were square‐root transformed for better visualization. B) Relative proportion of each subcluster in the aortic root tissues from MFS or CTRL. In A and B, *: statistically significant change. Differential compositional testing was performed using a Bayesian approach implemented in scCODA. The data are presented as the mean ± SEM (n = 4 for each group). C) Number of differentially expressed genes (DEGs) in each cell type between the MFS and CTRL groups. The significance threshold was set to an absolute log2 fold change >1 and a Bonferroni‐adjusted p‐value < 0.05. The statistical method implemented in DEsingle was used. D) Representative GO terms enriched in the upregulated genes in VSMCs from MFS versus CTRL. Bonferroni‐corrected p‐value < 0.05. The hypergeometric tests implemented in ClueGO were used. E) Number of differentially accessible (DA) cCREs in each cell type between the MFS and CTRL groups. The significance threshold was set to a Bonferroni‐adjusted p‐value < 0.05 and an absolute of log2 fold change > 0.1. The logistic regression test implemented in Seurat was used. F) Representative GO terms enriched in the cCREs with increased accessibility in VSMCs from MFS versus CTRL. Bonferroni‐corrected p‐value < 0.05. The hypergeometric test implemented in GREAT was used. G) Number of TF binding motifs with differential activities in each cell type between MFS and CTRL. Wilcoxon rank‐sum test, two‐tailed, FDR < 0.05. H) Top TF binding motifs with differential activities in the VSMCs from MFS patients versus the CTRL group. Up arrow: increased activity. Down arrow: decreased activity. I) Network view of the dysregulated REACTOME pathways in VSMCs from MFS patients versus the CTRL group inferred by gene set enrichment analysis (GSEA). An FDR < 0.05 was considered to indicate statistical significance. J) Enrichment plots (upper panel) for representative signaling pathways upregulated in the VSMCs of MFS and heatmaps showing the average expression of leading‐edge genes in each condition (lower panel). The vertical lines in the enrichment plot show where the members of the gene set appear in the ranked list of genes. Leading‐edge genes: the subset of genes in the gene set that contribute most to the enrichment. FB: fibroblast; LEC: lymphatic endothelial cell; NES: normalized enrichment score. VEC: vascular endothelial cell; VSMC: vascular smooth muscle cell.
Figure 3
Figure 3
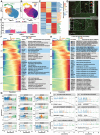
Phenotypic spectrum and regulatory dynamics during the phenotypic modulation of VSMCs in human aortic root tissue. A) UMAP plot showing the subclusters of VSMCs. B) UMAP plot showing the pseudotime inferred by Monocle3. C) Heatmap showing the expression of the top signature genes for each subcluster. D) smFISH confirmed the presence of RYR2 high and CFH high VSMCs, the two extremes of the phenotypic spectrum of VSMCs. E) Relative proportion of each subcluster in VSMCs from each condition. The data are presented as the mean ± SEM (n = 4 for each group). * Statistically significant change. Differential compositional testing was conducted using a Bayesian approach implemented in scCODA. F) Heatmap showing the gene expression dynamics during the phenotypic modulation of VSMCs. Pseudotime ordering was performed using Monocle3. The significance threshold was set to a q‐value < 0.05. Representative genes and enriched GO terms for each gene cluster are shown. G) Smoothed curves of representative genes whose expression changed as a function of pseudotime. H) Heatmap showing chromatin accessibility dynamics during the phenotypic modulation of VSMCs. The significance threshold was set to a q‐value < 0.001. The top enriched TF motifs and GO terms for each peak cluster are shown. I) Smoothed curves of representative cCREs whose accessibility changed as a function of pseudotime. In F and G, the genes or cCREs that changed as a function of pseudotime were detected with graph‐autocorrelation analysis by using the “graph_test” function in Monocle3.
Figure 4
Figure 4
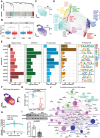
Candidate key regulators potentially driving the phenotypic modulation of VSMCs and the pathogenesis of aortic root aneurysms. A) Dendrogram showing the coexpression modules of the VSMCs identified by scWGCNA. B) VSMCs exhibited differential expression activities for the two largest modules, M7 and M9, in VSMCs of the MFS group versus the CTRL group. *: p‐value < 0.05, Wilcoxon rank‐sum test, two‐tailed (CTRL: 14 449 nuclei, MFS: 13 497 nuclei). C) UMAP plots showing the expression distribution of modules M7 (upper panel) and M9 (lower panel) across all VSMCs. D) Gene regulatory network of VSMCs color‐coded by co‐expression modules. The top 5 hub genes of each module are shown. The core TFs of M7 and M9 inferred based on the centrality of the network are shown in boxes. E) Potentially key regulators involved in the phenotypic modulation of VSMCs supported by multiple layers of evidence including regulon activity, expression, TF motif activity, and pseudotime ordering. F) UMAP plot showing the distribution of single‐nucleus expression of the TF FOXN3. The visualization was enhanced by using the R package Nebulosa to recover the signal from dropped‐out features. G) Significantly downregulated pseudobulk expression of FOXN3 in VSMCs from MFS patients versus CTRLs. **: p‐value < 0.01, Wilcoxon rank‐sum test, two‐tailed (n = 4 for each group). H) TF footprinting differences of FOXN3 between VSMCs from MFS patients and CTRLs. I) Western blot showing a significant decrease of the protein level of FOXN3 in the tunica media of the aortic root tissues from MFS patients compared to CTRLs. *: p‐value < 0.05, Student's t‐test, two‐tailed. The data are presented as the mean ± SEM (n = 4 for each group). J) Network plot showing the functional enrichment of the predicted FOXN3 regulon (TF and its targets). The significance threshold was set to a Bonferroni‐corrected p‐value < 0.05. The hypergeometric test implemented in ClueGO was used. Each octagon denotes an overrepresented REACTOME pathway. A larger size reflects a smaller adjusted p‐value.
Figure 5
Figure 5
Spatially resolved transcriptome showing the phenotypic spectrum of VSMCs across the tunica media of human aortic root tissue. A) H&E staining images of aortic root tissue sections from the MFS and CTRL groups. The arrows indicate the tunica adventitia. Two sections for each subject and two subjects for each group were subjected to spatial transcriptomic assays. B) Unsupervised clustering of the spatial spots identified nine spot clusters. C) UMAP plot showing the nine spot clusters. Each cluster was annotated according to its expression profile and spatial location. D) Heatmap showing the expression of molecular features for each spot cluster. E) Spatial locations of the VSMC subclusters VSMC1, VSMC2, and VSMC3 on the tissue sections inferred by integrating the single‐nucleus data and spatial transcriptomic data. The label transfer workflow of Seurat was applied in the prediction. F) Relative proportion of each spot cluster in each group. The average proportions of each group (n = 2) are shown. SC3, which represents low‐quality spots, was excluded from this analysis. +: expansion, ‐: contraction. G) Spatial distribution of the expression activities of the FOXN3 and TEAD1 regulons. H) UMAP plot showing the three major spot clusters over the tunica media. I) Pseudospace ordering of the three major spot clusters over the tunica media. J) Heatmap showing the expression profile of the genes that were expressed as a function of pseudospace. The significance threshold was set to a q‐value < 0.05. The genes that changed as a function of pseudotime were detected with graph‐autocorrelation analysis by using the “graph_test” function in Monocle3. K) Expression dynamics of markers and candidate regulators of VSMCs across the pseudospace.
Figure 6
Figure 6
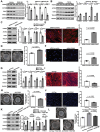
FOXN3 may function as a key regulator for maintaining the contractile phenotype of human aortic VSMCs. A) Western blot assay of FOXN3 and VSMC contractile marker proteins (ACTA2, CNN1, and TAGLN) in HASMCs following PDGF‐BB treatment (20 ng mL−1, 48 h post‐treatment). B) Western blot assay of FOXN3 and VSMC contractile marker proteins in HASMCs following TGF‐β treatment (10 ng mL−1, 48 h post‐treatment). C) Western blot assay of FOXN3 and VSMC contractile marker proteins in HASMCs transfected with scrambled siRNA (10 nmol L−1) or FOXN3‐siRNAs (10 nmol L−1, 96 h post‐transfection). D) Collagen gel contraction assay of HASMCs transfected with scrambled siRNA or FOXN3‐siRNA (72 h post‐transfection). E) Representative immunofluorescence staining images of F‐actin (red) in HASMCs transfected with scrambled siRNA or FOXN3‐siRNA (72 h post‐transfection). F) Representative immunofluorescence staining images of Ki‐67 (red) in HASMCs transfected with scrambled siRNA or FOXN3 siRNA (72 h post‐transfection). G) Western blot assay of FOXN3 and VSMC contractile marker proteins in HASMCs infected with Adenovirus‐FLAG‐vector (Ad‐Flag) or Adenovirus‐FLAG‐FOXN3 (Ad‐FOXN3; 96 h post‐infection). H) Collagen gel contraction assay of HASMCs infected with Ad‐Flag or Ad‐FOXN3 (96 h post‐infection). I) Representative immunofluorescence staining images of F‐actin (red) in HASMCs infected with Ad‐Flag or Ad‐FOXN3 (96 h post‐infection). J) Representative immunofluorescence staining images of Ki‐67 (red) in HASMCs infected with Ad‐Flag or Ad‐FOXN3 (96 h post‐infection). K) Western blot assay of FOXN3 and VSMC contractile marker proteins in HASMCs infected with Ad‐Flag or Ad‐FOXN3 for 72 h and then subjected to PDGF‐BB (20 ng mL−1) treatment for 24 h. L) Collagen gel contraction assay of HASMCs infected with Ad‐Flag or Ad‐FOXN3 and then treated with PDGF‐BB. In A‐L, the data are presented as the mean ± SEM (three independent experiments). *: p‐value < 0.05, **: p‐value < 0.01, ***: p‐value < 0.001, ns: not significant. The two‐tailed Student's t‐test was used to compare two groups of data, while one‐way ANOVA followed by multiple comparisons using Tukey's method was used to compare multiple groups of data. In D, F, H, and J, the percentage of polygonal‐shaped cells or Ki‐67‐positive cells in each image was calculated as the mean of the measurements in at least five representative views. Nuclei stained by DAPI are indicated in blue. Scale bar: 100 µm.
Figure 7
Figure 7
FOXN3 regulates smooth muscle contraction through targeting ACTA2 that encodes the key component of the contractile apparatus in smooth muscle cells. A) CUT&Tag‐qPCR experiment demonstrated the binding of FOXN3 to the ACTA2 promoter region in HASMCs. IgG was used as a negative control. Ad‐Flag: HASMCs infected with Adenovirus‐FLAG‐vector. Ad‐FOXN3: HASMCs infected with Adenovirus‐FLAG‐FOXN3. B) Schematic diagram of reporter, effector, and reference plasmid construction for the luciferase reporter assay. C) FOXN3 increased the activity of ACTA2 promoter driving a luciferase reporter in HEK293A cells in a concentration‐dependent manner. In A and C, data are presented as mean ± SEM (n = 3 wells per group). *: p‐value < 0.05, ***: p‐value < 0.001. One‐way ANOVA with Tukey's multiple comparison correction.

Similar articles

Cited by

References

    1. Milleron O., Arnoult F., Delorme G., Detaint D., Pellenc Q., Raffoul R., Tchitchinadze M., Langeois M., Guien C., Beroud C., Ropers J., Hanna N., Arnaud P., Gouya L., Boileau C., Jondeau G., J. Am. Coll. Cardiol. 2020, 75, 843. - PubMed
    1. Schill M. R., Kachroo P., Curr. Opin. Cardiol. 2021, 36, 683. - PubMed
    1. Zeigler S. M., Sloan B., Jones J. A., Adv. Exp. Med. Biol. 2021, 1348, 185. - PMC - PubMed
    1. Bitterman A. D., Sponseller P. D., J. Am. Acad. Orthop. Surg. 2017, 25, 603. - PubMed
    1. Milewicz D. M., Braverman A. C., De Backer J., Morris S. A., Boileau C., Maumenee I. H., Jondeau G., Evangelista A., Pyeritz R. E., De Backer J., Nat. Rev. Dis. Prim. 2021, 7, 64. - PMC - PubMed

LinkOut - more resources