. 2024 Jul 2;36(7):2629-2651.
doi: 10.1093/plcell/koae103.

The S-acylation cycle of transcription factor MtNAC80 influences cold stress responses in Medicago truncatula

Affiliations

The S-acylation cycle of transcription factor MtNAC80 influences cold stress responses in Medicago truncatula

Qinyi Ye et al. Plant Cell. .

Abstract

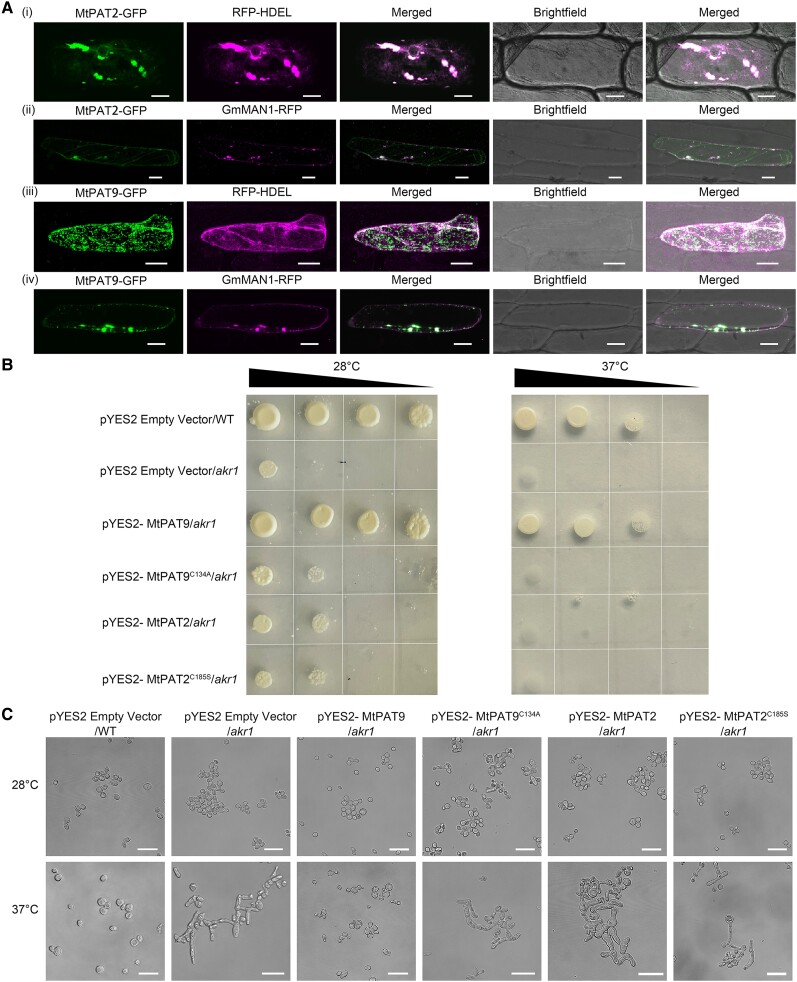
S-acylation is a reversible post-translational modification catalyzed by protein S-acyltransferases (PATs), and acyl protein thioesterases (APTs) mediate de-S-acylation. Although many proteins are S-acylated, how the S-acylation cycle modulates specific biological functions in plants is poorly understood. In this study, we report that the S-acylation cycle of transcription factor MtNAC80 is involved in the Medicago truncatula cold stress response. Under normal conditions, MtNAC80 localized to membranes through MtPAT9-induced S-acylation. In contrast, under cold stress conditions, MtNAC80 translocated to the nucleus through de-S-acylation mediated by thioesterases such as MtAPT1. MtNAC80 functions in the nucleus by directly binding the promoter of the glutathione S-transferase gene MtGSTU1 and promoting its expression, which enables plants to survive under cold stress by removing excess malondialdehyde and H2O2. Our findings reveal an important function of the S-acylation cycle in plants and provide insight into stress response and tolerance mechanisms.


Conflict of interest statement

Conflict of interest statement. None declared.

Figures

Figure 1.
Figure 1.
MtNAC80 is localized to the plasma membrane. A) Subcellular localization of MtNAC80-GFP driven by CaMV35S in onion epidermal cells. Colocalization of MtNAC80-GFP with PIP2A-RFP (plasma membrane marker) (i) and co-staining with FM4-64 (cellar membrane-specific lipophilic dye) (ii) or 4′,6-diamidino-2-phenylindole (DAPI, nuclear dye) (iii). The signal patterns were observed by confocal laser scanning microscopy (Olympus FluoView FV1000) with fluorescence excitation wavelength at 488 nm (GFP), 546 nm (RFP or FM4-64), or 358 nm (DAPI). Bars = 50 μm. B) Subcellular localization of MtNAC80-GFP in transgenic M. truncatula hairy roots driven by MtNAC80 endogenous promoter (i) or constitutive CaMV35S promoter (ii). The GFP signal was detected by confocal laser scanning microscopy (Olympus FluoView FV1000). Bars = 50 μm. C) Cellular fractionation and immunoblot analysis using Pro35S:MtNAC80-GFP transgenic plants. H+-ATPase, plasma membrane (PM) marker; Histone, nuclear marker; cFBPase, cytosolic fraction marker.
Figure 2.
Figure 2.
S-acylation of Cys26 in MtNAC80 protein contributes to its membrane localization. A) S-acylation analysis of MtNAC80 by the acyl-biotinyl exchange (ABE) assay. ProMtNAC80:MtNAC80-GFP was transiently expressed in N. benthamiana leaves. S-acylated MtNAC80 was detected with anti-GFP antibody. The “S-acylation” lanes show the amount of MtNAC80-GFP bound to the neutravidin-agarose beads with (+) or without (−) NH2OH treatment. The “Loading” lanes show equal amounts of proteins loaded. Protein bands were processed by ImageJ. The values represent the ratio of the intensity of each band to the intensity of the first loading band. B) Lipidation prediction of MtNAC80 protein by GPS-lipid predictor analysis at the “medium” threshold. The cysteine predicted to be S-acylated was shown in red. C) S-acylation analysis of the mutant MtNAC80C26S by ABE assay. Proteins were extracted from leaves of M. truncatula stable transgenic lines expressing Pro35S:MtNAC80-GFP and Pro35S:MtNAC80C26S-GFP. The “S-acylation” lanes show the amount of MtNAC80-GFP and MtNAC80C26S-GFP bound to the neutravidin-agarose beads with (+) or without (−) NH2OH treatment. The “Loading” lanes show the amounts of proteins loaded. Protein bands were processed by ImageJ. The values represent the ratio of the intensity of each band to the intensity of the first loading band. D) Colocalization of MtNAC80C26S-GFP with RFP-HDEL (ER luminal marker) in onion epidermal cells. The signal patterns were observed by fluorescence microscopy (Olympus FluoView FV1000). Bars = 50 μm.
Figure 3.
Figure 3.
The ER/Golgi localized MtPAT9, but not MtPAT2, can complement the thermosensitive phenotype of the akr1 yeast mutant. A) Colocalization of MtPAT2-GFP and MtPAT9-GFP with ER/Golgi markers in onion epidermal cells. RFP-HDEL, ER luminal marker; GmMAN1-RFP, the ER/Golgi marker. The signal patterns were observed by confocal laser scanning microscopy (Leica SP8) with fluorescence excitation wavelength at 488 nm (GFP), 552 nm (RFP). Bars = 50 μm. B) Thermosensitive phenotype complementation assay of MtPAT2 and MtPAT9 in the akr1 yeast mutant. The akr1 yeast strain was transformed with MtPAT2, MtPAT9, MtPAT2C185S, MtPAT9C134A, and pYES2 empty vector, respectively. The wild-type (WT, W303-1A) yeast strain was transformed with pYES2 empty vector, serving as the positive control. The triangle represents the concentration gradient of transformants at the start of cultivation on the galactose minimal agar medium plate. C) Morphological observation of the yeast transformants. Shapes of the yeast cells were observed using the confocal microscopy (Leica SP8). Bars = 20 μm.
Figure 4.
Figure 4.
MtPAT9 S-acylates MtNAC80 and affects the membrane localization of MtNAC80. A) Firefly luciferase (LUC) complementation imaging (LCI) assay of the interaction between MtPAT9 and MtNAC80 in N. benthamiana leaves. MtNAC80 and MtNAC80C26S were fused to the N-terminus of nLUC to generate MtNAC80-nLUC and MtNAC80C26S-nLUC. MtPAT9 and MtPAT9C134A were fused to N-terminus of cLUC to generate MtPAT9-cLUC and MtPAT9C134A-cLUC. Luciferase luminescence was detected using a CCD imaging system. The color scale represents the intensity of luminescence. B) S-acylation analysis of MtNAC80 in the mtpat9 mutants by ABE assay. ProMtNAC80:MtNAC80-GFP was transiently expressed in the mtpat9 mutants by hairy root transformation, and the transformed roots were collected and isolated for detection. S-acylated MtNAC80 was detected with anti-GFP antibody. The “S-acylation” lanes show the amount of MtNAC80-GFP bound to the neutravidin-agarose beads with (+) or without (−) NH2OH treatment. The “Loading” lanes show equal amounts of proteins loaded. C) Subcellular localization of ProMtNAC80:MtNAC80-GFP in M. truncatula protoplasts in the genetic background of the wild type (WT) or the mtpat9 mutant. The GFP signal was detected using confocal laser scanning microscopy (Leica SP8) with fluorescence excitation wavelength at 488 nm. Bars = 10 μm.
Figure 5.
Figure 5.
MtNAC80 was induced by cold stress treatment and positively regulates freezing tolerance of M. truncatula. A) GUS staining assay of the stable transgenic M. truncatula lines expressing ProMtNAC80:GUS. (i) Whole plant, bar = 1 cm. (ii) Leaf, bar = 100 μm. (iii) Stem, bar = 100 μm. (iv) Root, bar = 100 μm. (v) Root tip, bar = 100 μm. B) Relative expression of MtNAC80 in aerial parts (i) and roots (ii) under cold (4 °C) treatment at the indicated time points. The values were normalized to MtACTIN expression. The data represent mean ± SD of 3 biological replicates. Statistics analyses were determined by 1-way ANOVA followed by Dunnett's multiple comparisons test; *P < 0.05, **P < 0.01, ***P < 0.001, ****P < 0.0001. C) Freezing tolerance analysis of the mtnac80 mutants and wild-type (WT) plants without cold acclimation (CA) period. (i) Phenotypes of WT and mtnac80 mutants before and after freezing treatment. Bar = 5 cm. (ii) Survival rates of WT and mtnac80 mutants after freezing treatment. The data represent mean ± SD of 3 independent experiments (n ≥ 15). The freezing temperature in 3 independent experiments reached −6, −6, and −7 °C, respectively. (iii) Electrolyte leakage of WT and mtnac80 mutants after freezing treatment. The data represent mean ± SD of 5 biological replicates. Asterisks indicate statistically significant differences compared to WT (1-way ANOVA followed by Fisher's LSD test, *P < 0.05). D) Freezing tolerance analysis of the MtNAC80-overexpressing (OE) and empty-vector (EV) transgenic plants without CA period. (i) Phenotypes of the EV and MtNAC80-OE transgenic plants before and after freezing treatment. Bar = 5 cm. (ii) Survival rates of the EV and MtNAC80-OE transgenic plants after freezing treatment. The data represent mean ± SD of 3 independent experiments (n ≥ 15). The freezing temperature in 3 independent experiments reached −6, −6, and −7 °C, respectively. (iii) Electrolyte leakage of the EV and MtNAC80-OE transgenic plants after freezing treatment. The data represent mean ± SD of 5 biological replicates. Asterisks indicate statistically significant differences compared to EV (1-way ANOVA followed by Fisher's LSD test, *P < 0.05, **P < 0.01).
Figure 6.
Figure 6.
MtNAC80 undergoes de-S-acylation and enters the nucleus under cold stress treatment. A) Subcellular localization of ProMtNAC80:MtNAC80-GFP in root tissues of stable transgenic M. truncatula lines under different treatments: (i) normal growth conditions, (ii) cold stress treatment (0 to 4 °C) for 4 h, (iii) 0.05 M NH2OH treatment for 2 h. DAPI, 4′,6-diamidino-2-phenylindole. The signal patterns were observed by confocal laser scanning microscopy (Leica SP8) with fluorescence excitation wavelength at 488 nm (GFP) or 409 nm (DAPI). Bars = 20 μm. B) Cellular fractionation and immunoblot analysis using ProMtNAC80:MtNAC80-GFP transgenic plants under normal growth conditions, cold stress treatment, or NH2OH treatment. H+-ATPase, plasma membrane (PM) marker; Histone, nuclear marker; cFBPase, cytosolic fraction marker. C) S-acylation state of MtNAC80-GFP under cold treatment by ABE assay. Leaves of stable transgenic lines expressing ProMtNAC80:MtNAC80-GFP were exposed to cold treatment for 0, 1, 2, and 4 h, and then collected for ABE assay. S-acylated MtNAC80 was detected with anti-GFP antibody. The “S-acylation” lanes show the amount of MtNAC80-GFP bound to the neutravidin-agarose beads with (+) or without (−) NH2OH treatment. The “Loading” lanes show the amounts of proteins loaded. Protein bands were processed by ImageJ. The values represent the ratio of the intensity of each band to the intensity of the first loading band.
Figure 7.
Figure 7.
MtAPT1 promotes de-S-acylation of MtNAC80 under cold stress treatment. A) Firefly luciferase (LUC) complementation (LCI) imaging assay of the interaction between MtAPT1 and MtNAC80 in N. benthamiana leaves. MtNAC80 was fused to the N-terminus of nLUC to generate MtNAC80-nLUC. MtAPT1 was fused to C-terminus of cLUC to generate cLUC-MtAPT1. Luciferase luminescence was detected using a CCD imaging system. The color scale represents the intensity of luminescence. B) Co-expression of MtNAC80-GFP with MtAPT1-RFP (i) or MtAPT1m-RFP (DXXGXV-AXXAXA) mutant protein (ii) in onion epidermal cells. The signal patterns were observed by confocal laser scanning microscopy (Olympus FluoView FV1000) with fluorescence excitation wavelength at 488 nm (GFP: green) and 546 nm (RFP: magenta). Bars = 50 μm. C) S-acylation analysis of MtNAC80-GFP co-transformed with Pro35S:GFP (∼27 kDa) or Pro35S:APT1-GFP (∼37 kDa) by ABE assay. Proteins were co-expressed in the N. benthamiana leaves. The S-acylated MtNAC80 was detected with anti-GFP antibody. The “S-acylation” lanes show the amount of MtNAC80-GFP bound to the neutravidin-agarose beads with (+) or without (−) NH2OH treatment. The “Loading” lanes show the amounts of proteins loaded. D) Nonreducing SDS-PAGE immunoblot of MtAPT1-GFP with cold stress treatments. Leaves from stable transgenic seedlings (Pro35S:MtAPT1-GFP #11) were collected and subjected to icy water for 0, 15, 30 min, 1, 2, and 4 h. The monomeric or tetrameric MtAPT1 was detected with anti-GFP antibody. β-Actin was detected as the control.
Figure 8.
Figure 8.
MtNAC80 upregulates the expression of MtGSTU1 under cold stress by directly binding to its promoter. A) Heat map of candidate genes from RNA-seq assay involved in abiotic stress responses. B) Relative expression level of candidate genes quantified by RT-qPCR in the wild-type (WT) and mtnac80 mutants under cold stress. MtACTIN was used as the reference gene. C) Relative expression level of MtGSTU1 in aerial parts and roots under cold (4°C) treatment at the indicated time points. D) Y1H assay on the binding of MtNAC80 protein to MtGSTU1 promoter (MtGSTU1p). MtGSTU1pmut contains the mutation of the “CAAAGTCTATTTTG” motif to “CCCCCCCCCCCCCC”. AD EV, activation domain without fusion of any transcription factors (negative control). E) EMSA of MtNAC80 protein binding to MtGSTU1 promoter. A purified His-MtNAC80 protein (200 ng) was incubated with biotin-labeled probes (Biotin-P, 20 fM) or biotin-labeled mutant probes (Biotin-mP, 20 fM). For the competition assay, unlabeled probes with different concentrations (from 10 to 1,000 times, Cold-P) or unlabeled mutant probes (1,000 times, Cold-mP) were added. His-MtWRKY76 was used as a negative control. The numbers indicate the position of the probes to the translational start site (ATG). The “CAAAGTCTATTTTG” motif and the mutant “CCCCCCCCCCCCCC” were shown in red. F) In vivo ChIP assay on the binding of MtNAC80 protein to MtGSTU1 promoter under cold stress. MtNAC80-OE and empty-vector (negative control) transgenic plants were treated with cold (4°C) stress for 6 h. MtACTIN was used as the reference gene. The data represent mean ± SD of 2 biological replicates (2-way ANOVA followed by Bonferroni's multiple comparisons test, *P < 0.05).
Figure 9.
Figure 9.
S-acylation cycle of MtNAC80 contributes to remove excess MDA and H2O2 under cold stress. A) Glutathione S-transferase (GST) activity, B) malondialdehyde (MDA) concentration, and C) H2O2 concentration of M. truncatula under control or cold stress treatment for 6 h. FW, fresh weight. The data represent mean ± SD of 3 biological replicates. Statistical analyses were determined by 2-way ANOVA followed by Dunnett's multiple comparisons test; asterisks represent significances compared with the wild-type (WT) in each treatment; *P < 0.05, **P < 0.01, ***P < 0.001, ****P < 0.0001). D) Freezing tolerance analysis of the mtpat9 mutants and wild-type (WT) plants without cold acclimation (CA) period. (i) Phenotypes of WT and mtpat9 mutants before and after freezing treatment. Bar = 5 cm. (ii) Survival rates of WT and mtpat9 mutants after freezing treatment. The data represent mean ± SD of 3 independent experiments (n ≥ 15). The freezing temperature reached −5 °C in 3 repeated experiments. (iii) Electrolyte leakage of WT and mtpat9 mutants after freezing treatment. The data represent mean ± SD of 5 biological replicates. Statistical analyses were determined by 1-way ANOVA followed by Dunnett's multiple comparisons test; *P < 0.05. E) A proposed model for the S-acylation cycle of MtNAC80 in response to cold stress in M. truncatula. MtNAC80 is localized to the plasma membrane through S-acylation modification by MtPAT9. Under cold stress, MtNAC80 undergoes translocation to the nucleus through de-S-acylation mediated by thioesterases such as the tetramer MtAPT1. MtNAC80 functions in the nucleus by binding to the promoter of MtGSTU1 and promoting its expression, which enables plants to survive under cold stress by removing excess MDA and H2O2. The pink wave represents palmitic acid.

Similar articles

Cited by

References

    1. Acevedo-Garcia J, Kusch S, Panstruga R. Magical mystery tour: MLO proteins in plant immunity and beyond. New Phytol. 2014:204(2):273–281. 10.1111/nph.12889 - DOI - PubMed
    1. Batistic O. Genomics and localization of the Arabidopsis DHHC-cysteine-rich domain S-acyltransferase protein family. Plant Physiol. 2012:160(3):1597–1612. 10.1104/pp.112.203968 - DOI - PMC - PubMed
    1. Batistic O, Sorek N, Schultke S, Yalovsky S, Kudla J. Dual fatty acyl modification determines the localization and plasma membrane targeting of CBL/CIPK Ca2+ signaling complexes in Arabidopsis. Plant cell. 2008:20(5):1346–1362. 10.1105/tpc.108.058123 - DOI - PMC - PubMed
    1. Chen D, Hao F, Mu H, Ahsan N, Thelen JJ, Stacey G. S-acylation of P2K1 mediates extracellular ATP-induced immune signaling in Arabidopsis. Nat Commun. 2021:12(1):2750. 10.1038/s41467-021-22854-1 - DOI - PMC - PubMed
    1. Cheong YH, Kim K-N, Pandey GK, Gupta R, Grant JJ, Luan S. CBL1, a calcium sensor that differentially regulates salt, drought, and cold responses in Arabidopsis. Plant Cell. 2003:15(8):1833–1845. 10.1105/tpc.012393 - DOI - PMC - PubMed

MeSH terms

LinkOut - more resources