

Multiomics Analyses Provide New Insight into Genetic Variation of Reproductive Adaptability in Tibetan Sheep
- PMID: 38552245
- PMCID: PMC10980521
- DOI: 10.1093/molbev/msae058
Multiomics Analyses Provide New Insight into Genetic Variation of Reproductive Adaptability in Tibetan Sheep
Abstract
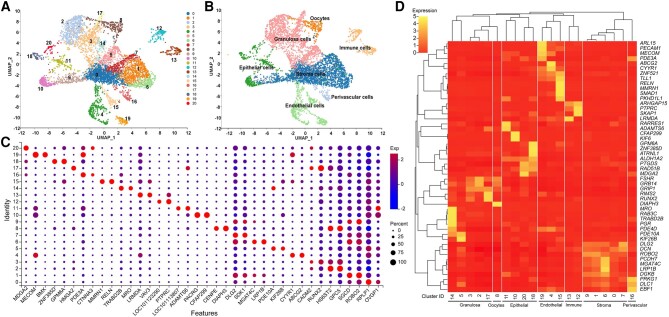
Domestication and artificial selection during production-oriented breeding have greatly shaped the level of genomic variability in sheep. However, the genetic variation associated with increased reproduction remains elusive. Here, two groups of samples from consecutively monotocous and polytocous sheep were collected for genome-wide association, transcriptomic, proteomic, and metabolomic analyses to explore the genetic variation in fecundity in Tibetan sheep. Genome-wide association study revealed strong associations between BMPR1B (p.Q249R) and litter size, as well as between PAPPA and lambing interval; these findings were validated in 1,130 individuals. Furthermore, we constructed the first single-cell atlas of Tibetan sheep ovary tissues and identified a specific mural granulosa cell subtype with PAPPA-specific expression and differential expression of BMPR1B between the two groups. Bulk RNA-seq indicated that BMPR1B and PAPPA expressions were similar between the two groups of sheep. 3D protein structure prediction and coimmunoprecipitation analysis indicated that mutation and mutually exclusive exons of BMPR1B are the main mechanisms for prolific Tibetan sheep. We propose that PAPPA is a key gene for stimulating ovarian follicular growth and development, and steroidogenesis. Our work reveals the genetic variation in reproductive performance in Tibetan sheep, providing insights and valuable genetic resources for the discovery of genes and regulatory mechanisms that improve reproductive success.
Keywords: GWAS; Tibetan sheep; adaptation; multiomics; reproduction.
© The Author(s) 2024. Published by Oxford University Press on behalf of Society for Molecular Biology and Evolution.
Conflict of interest statement
Conflict of Interest The authors declare no conflicts of interest.
Figures


Similar articles
-
Whole genome sequencing revealed genetic diversity, population structure, and selective signature of Panou Tibetan sheep.BMC Genomics. 2023 Jan 28;24(1):50. doi: 10.1186/s12864-023-09146-2. BMC Genomics. 2023. PMID: 36707771 Free PMC article.
-
The expression and mutation of BMPR1B and its association with litter size in small-tail Han sheep (Ovis aries).Arch Anim Breed. 2021 May 28;64(1):211-221. doi: 10.5194/aab-64-211-2021. eCollection 2021. Arch Anim Breed. 2021. PMID: 34109270 Free PMC article.
-
A repertoire of single nucleotide polymorphisms (SNPs) of major fecundity BMPR1B gene among 75 sheep breeds worldwide.Theriogenology. 2024 Apr 15;219:59-64. doi: 10.1016/j.theriogenology.2024.02.019. Epub 2024 Feb 20. Theriogenology. 2024. PMID: 38401385
-
The role of GnRH in Tibetan male sheep and goat reproduction.Reprod Domest Anim. 2023 Sep;58(9):1179-1187. doi: 10.1111/rda.14432. Epub 2023 Jul 26. Reprod Domest Anim. 2023. PMID: 37492901 Review.
-
Prolificacy genes in sheep: the French genetic programmes.Reprod Suppl. 2003;61:353-9. Reprod Suppl. 2003. PMID: 14635947 Review.
Cited by
-
Genetic and Epigenetic Adaptation Mechanisms of Sheep Under Multi-Environmental Stress Environment.Int J Mol Sci. 2025 Apr 1;26(7):3261. doi: 10.3390/ijms26073261. Int J Mol Sci. 2025. PMID: 40244095 Free PMC article. Review.
-
The influence of resveratrol and β-Hydroxy-β-methyl butyric acid supplementation alone or in combination on the development and health of the duodenum in Tibetan sheep.Front Microbiol. 2025 Jul 8;16:1612102. doi: 10.3389/fmicb.2025.1612102. eCollection 2025. Front Microbiol. 2025. PMID: 40698187 Free PMC article.
-
Whole genome sequencing and structural variations provide insights into the body size traits of Hu sheep.Sci Data. 2025 Aug 6;12(1):1373. doi: 10.1038/s41597-025-05734-x. Sci Data. 2025. PMID: 40770274 Free PMC article.
-
Molecular Genetic Basis of Reproductive Fitness in Tibetan Sheep on the Qinghai-Tibet Plateau.Genes (Basel). 2025 Jul 29;16(8):909. doi: 10.3390/genes16080909. Genes (Basel). 2025. PMID: 40869957 Free PMC article.
-
Innovative Insights into Single-Cell Technologies and Multi-Omics Integration in Livestock and Poultry.Int J Mol Sci. 2024 Dec 2;25(23):12940. doi: 10.3390/ijms252312940. Int J Mol Sci. 2024. PMID: 39684651 Free PMC article. Review.
References
-
- Alon T, Matas D, Koren L, Gootwine E. Higher cortisol and testosterone levels in sheep with larger litter sizes. Livest Sci. 2021:243:104381. 10.1016/j.livsci.2020.104381 - DOI
-
- Austin EJ, Mihm M, Evans ACO, Knight PG, Ireland JLH, Ireland JJ, Roche JF. Alterations in intrafollicular regulatory factors and apoptosis during selection of follicles in the first follicular wave of the bovine estrous cycle. Biol Reprod. 2001:64(3):839–848. 10.1095/biolreprod64.3.839 - DOI - PubMed
-
- Balasubramanian K, LaVoie HA, Garmey JC, Stocco DM, Veldhuis JD. Regulation of porcine granulosa cell steroidogenic acute regulatory protein (StAR) by insulin-like growth factor I: synergism with follicle-stimulating hormone or protein kinase A agonist. Endocrinology 1997:138(1):433–439. 10.1210/endo.138.1.4894 - DOI - PubMed
MeSH terms
Grants and funding
LinkOut - more resources
Full Text Sources
Miscellaneous
