

Clinical prediction of microvascular invasion in hepatocellular carcinoma using an MRI-based graph convolutional network model integrated with nomogram
- PMID: 38552308
- PMCID: PMC11075980
- DOI: 10.1093/bjr/tqae056
Clinical prediction of microvascular invasion in hepatocellular carcinoma using an MRI-based graph convolutional network model integrated with nomogram
Abstract
Objectives: Based on enhanced MRI, a prediction model of microvascular invasion (MVI) for hepatocellular carcinoma (HCC) was developed using graph convolutional network (GCN) combined nomogram.
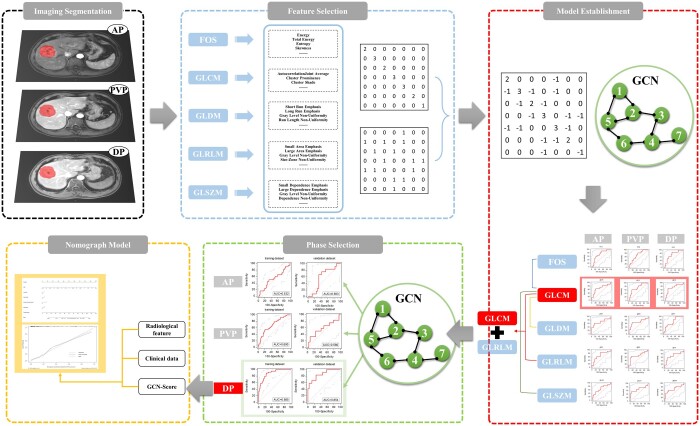
Methods: We retrospectively collected 182 HCC patients confirmed histopathologically, all of them performed enhanced MRI before surgery. The patients were randomly divided into training and validation groups. Radiomics features were extracted from the arterial phase (AP), portal venous phase (PVP), and delayed phase (DP), respectively. After removing redundant features, the graph structure by constructing the distance matrix with the feature matrix was built. Screening the superior phases and acquired GCN Score (GS). Finally, combining clinical, radiological and GS established the predicting nomogram.
Results: 27.5% (50/182) patients were with MVI positive. In radiological analysis, intratumoural artery (P = 0.007) was an independent predictor of MVI. GCN model with grey-level cooccurrence matrix-grey-level run length matrix features exhibited area under the curves of the training group was 0.532, 0.690, and 0.885 and the validation group was 0.583, 0.580, and 0.854 for AP, PVP, and DP, respectively. DP was selected to develop final model and got GS. Combining GS with diameter, corona enhancement, mosaic architecture, and intratumoural artery constructed a nomogram which showed a C-index of 0.884 (95% CI: 0.829-0.927).
Conclusions: The GCN model based on DP has a high predictive ability. A nomogram combining GS, clinical and radiological characteristics can be a simple and effective guiding tool for selecting HCC treatment options.
Advances in knowledge: GCN based on MRI could predict MVI on HCC.
Keywords: deep learning; graph convolutional network; hepatocellular carcinoma; microvascular invasion; radiomics.
© The Author(s) 2024. Published by Oxford University Press on behalf of the British Institute of Radiology. All rights reserved. For permissions, please email: journals.permissions@oup.com.
Conflict of interest statement
The authors declare that they have no competing interests.
Figures


Similar articles
-
MRI-based clinical-radiomics nomogram model for predicting microvascular invasion in hepatocellular carcinoma.Med Phys. 2024 Jul;51(7):4673-4686. doi: 10.1002/mp.17087. Epub 2024 Apr 20. Med Phys. 2024. PMID: 38642400
-
Preoperative radiomics nomogram for microvascular invasion prediction in hepatocellular carcinoma using contrast-enhanced CT.Eur Radiol. 2019 Jul;29(7):3595-3605. doi: 10.1007/s00330-018-5985-y. Epub 2019 Feb 15. Eur Radiol. 2019. PMID: 30770969
-
Radiomics Model of Dynamic Contrast-Enhanced MRI for Evaluating Vessels Encapsulating Tumor Clusters and Microvascular Invasion in Hepatocellular Carcinoma.Acad Radiol. 2025 Jan;32(1):146-156. doi: 10.1016/j.acra.2024.07.007. Epub 2024 Jul 18. Acad Radiol. 2025. PMID: 39025700
-
Development and validation of a cross-modality tensor fusion model using multi-modality MRI radiomics features and clinical radiological characteristics for the prediction of microvascular invasion in hepatocellular carcinoma.Eur J Surg Oncol. 2025 Jan;51(1):109364. doi: 10.1016/j.ejso.2024.109364. Epub 2024 Nov 4. Eur J Surg Oncol. 2025. PMID: 39536525
-
Prediction of microvascular invasion in hepatocellular carcinoma patients with MRI radiomics based on susceptibility weighted imaging and T2-weighted imaging.Radiol Med. 2024 Aug;129(8):1130-1142. doi: 10.1007/s11547-024-01845-4. Epub 2024 Jul 13. Radiol Med. 2024. PMID: 38997568
Cited by
-
Artificial intelligence techniques in liver cancer.Front Oncol. 2024 Sep 3;14:1415859. doi: 10.3389/fonc.2024.1415859. eCollection 2024. Front Oncol. 2024. PMID: 39290245 Free PMC article. Review.
References
-
- Jin YJ, Lee JW, Lee OH, et al.Transarterial chemoembolization versus surgery/radiofrequency ablation for recurrent hepatocellular carcinoma with or without microvascular invasion. J Gastroenterol Hepatol. 2014;29(5):1056-1064. - PubMed
-
- Kluger MD, Salceda JA, Laurent A, et al.Liver resection for hepatocellular carcinoma in 313 Western patients: tumor biology and underlying liver rather than tumor size drive prognosis. J Hepatol. 2015;62(5):1131-1140. - PubMed
-
- Lim KC, Chow PK, Allen JC, et al.Microvascular invasion is a better predictor of tumor recurrence and overall survival following surgical resection for hepatocellular carcinoma compared to the Milan criteria. Ann Surg. 2011;254(1):108-113. - PubMed
MeSH terms
Grants and funding
LinkOut - more resources
Full Text Sources
Medical
