. 2024 Mar 28;187(7):1769-1784.e18.
doi: 10.1016/j.cell.2024.02.033.

Unraveling cellular complexity with transient adapters in highly multiplexed super-resolution imaging

Affiliations

Unraveling cellular complexity with transient adapters in highly multiplexed super-resolution imaging

Florian Schueder et al. Cell. .

Abstract

Mapping the intricate spatial relationships between the many different molecules inside a cell is essential to understanding cellular functions in all their complexity. Super-resolution fluorescence microscopy offers the required spatial resolution but struggles to reveal more than four different targets simultaneously. Exchanging labels in subsequent imaging rounds for multiplexed imaging extends this number but is limited by its low throughput. Here, we present a method for rapid multiplexed super-resolution microscopy that can, in principle, be applied to a nearly unlimited number of molecular targets by leveraging fluorogenic labeling in conjunction with transient adapter-mediated switching for high-throughput DNA-PAINT (FLASH-PAINT). We demonstrate the versatility of FLASH-PAINT with four applications: mapping nine proteins in a single mammalian cell, elucidating the functional organization of primary cilia by nine-target imaging, revealing the changes in proximity of thirteen different targets in unperturbed and dissociated Golgi stacks, and investigating and quantifying inter-organelle contacts at 3D super-resolution.

Keywords: DNA-PAINT; FLASH-PAINT; multiplexing; nanoscopy; spatial omics; super-resolution.


Conflict of interest statement

Declaration of interests F.S. and J.B. filed patent applications with the U.S. patent office covering the conceptional ideas of this study. J.B. has licensed IP to Bruker Corp. and Hamamatsu Photonics. J.B. is a consultant for Bruker Corp. J.B. is a founder of panluminate, Inc.

Figures

Figure 1 –
Figure 1 –. Proof of concept of FLASH-PAINT.
(a) Schematic representation of ‘classic’ DNA-PAINT using direct binding of Imagers to docking sites and FLASH-PAINT using TAs. (b) Proof of concept with DNA origami nanostructures. Frame pattern and 20-nm grid DNA origamis are sampled (Locs = localization events) via ‘classic’ DNA-PAINT and TAs (FLASH-PAINT), respectively. In the first round of imaging (R1), only the Imagers are present, and therefore only the frame pattern DNA origamis are sampled. In R2, TAs are added, revealing the 20-nm grid DNA origamis. Before R3, TAs and Imagers are washed out. Imaging with just the reintroduced Imagers in R3 reproduces the results of R1. (c) DNA origami experiment to compare association rates for direct and TA-mediated binding. (d) Measured (data points) and calculated (curves) association rates for direct and TA-mediated binding for different TA concentrations. (e) 4-plex imaging of 5-nm grid DNA origamis featuring binding sites arranged as letters (‘Y’, ‘A’, ‘L’, ‘E’). 121 to 246 super-resolution images of individual letters were averaged to generate the displayed letters. A representative field of view is shown in Figure S1j. Scale bars: (b, c) 100 nm; (e) 20 nm.
Figure 2 –
Figure 2 –. Molecular target switching via a Transient Adapter-Eraser combination.
(a) Schematic depiction. In Round 2, Eraser E1 neutralizes Transient Adapter 1 while added Transient Adapter 2 directs the Imager probe to a new target. (b) Quantification of switching efficiency using DNA origami. In Round 1, only the Imager, not the Transient Adapter, is introduced. In Round 2, both Transient Adapter (20 nM) and Imager are applied. Finally, the solution is replaced with an Eraser (100 nM) and an Imager. After a 3-min incubation period, the third round of imaging is carried out. (c) Time course (diffraction-limited confocal imaging) of switching the labeled molecular target from Tom20 on mitochondria to α-tubulin (microtubules) in a U-2 OS cell. Before acquisition, to visualize mitochondria, the sample is in a medium containing Transient Adapter 1 and an Imager. At the start of the acquisition Eraser 1 and Transient Adapter 2 are added to the medium. Scale bars: 5 μm.
Figure 3 –
Figure 3 –. Cellular proof of concept of FLASH-PAINT.
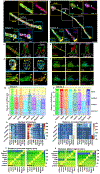
Nine different protein targets located at the Golgi complex, mitochondria, and the nucleus were imaged at super-resolution. The yellow, red, and green subpanels zoom in on mitochondria (yellow box), parts of the Golgi complex and nuclear envelope (red box), and a nucleolus (green box), respectively. The yellow box subpanel zoom-in depicts a 50-nm thick slice of the 3D dataset. For clarity, only a subset of proteins is shown in the subpanels; labels marked in gray are not shown. Scale bars: 5 μm (overview), 500 nm (zoom-ins).
Figure 4 –
Figure 4 –. 9-target FLASH-PAINT imaging of normal and bulbous-tip cilia in RPE-pHSmo cells.
(a, b) FLASH-PAINT maximum-projection images of nine different protein targets at a normal (a; Cilium 1) and bulbous-tip (b; Cilium 2) cilium. Quartiles along the length of the cilia are represented by square boxes. Subsets of the nine targets in the proximal and distal regions are shown in the blue and yellow boxes, respectively. The yellow and blue arrowheads point at the basal body distal appendage CEP164 and the transition zone (TZ) Rpgrip1l markers, respectively. Between the bulbous tip (asterisk in (b)) and a varicosity (white arrow in middle2 box), thinning of the ciliary membrane (white arrows in yellow boxes) can be observed. (c, d) A 50-nm thick slice and line-profile graphs for the distal regions highlighting the distribution of acetylated tubulin (Actub) inside the pHluorin-Smoothened (pHSmo) cilia membrane. (e) yz and xz projections of a 250-nm thick slice at the proximal region illustrating the ring-shaped distribution of CEP164 clusters (dashed yellow ellipses) surrounding Rpgrip1l and Ift88 and at the base of pHSmo and Arl13b. (f) xz projection of a 500-nm thick slice at the distal bulbous tip highlighting the enrichment of a subset of targets inside the pHSmo clusters (dashed green circle). (g) Bar plots summarizing the axial distribution of the nine different targets. For each target, the median (line) and 25% and 75% quartiles (bottom and top of the bar) are indicated. (h) Numbers of clusters. (i) Median distances of clusters to the central Actub filament. In the proximal regions, Actub and Glutub axoneme targets show the shortest distance to the filament (black dashed-line rectangles). (j, k) Median distances between clusters of two different targets in the proximal and distal regions. Sept2 clusters are closer to all other targets in the normal cilium compared to the bulbous-tip cilium (black dashed-line rectangles). In the distal region, a similar observation can be made for Ift88 (magenta dashed-line rectangles). Scale bars: 1 μm (overviews); 300 nm (zoom-ins a-d), 500 nm (e), and 400 nm (f).
Figure 5 –
Figure 5 –. 13-target FLASH-PAINT imaging of Golgi complexes in control, Nocodazole, Brefeldin A and Ilimaquinone-treated HUVEC cells.
(a–c) Golgi complex and secretory pathway of an interphase cell. Different subsets of protein targets are shown as indicated by the colored labels (gray-labeled targets not shown). (d–f) Zoomed-in regions of the white boxes shown in (a–c) highlighting a side view of a Golgi stack revealing the sequential organization of the stack into cis-, medial- , and trans-cisternae and TGN (d), the spatial relationship between ERES, ERGIC, and COPI and II vesicles (e), and an en-face view of a Golgi stack showing Giantin located at the Golgi rim (f). (g–o) Representation equivalent to (a–f) of Golgi ministacks in a Nocodazole (g-i), Ilimaquinone (j-l), and Brefeldin A-treated (m-o) cell. Scale bars: 5 μm (a–c; g–o), 500 nm (d–f; zoom-ins g–o).
Figure 6 –
Figure 6 –. Quantitative spatial analysis of drug-treated Golgi complexes in HUVEC cells.
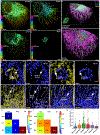
(a) Region of interest (ROI) selection for a Nocodazole-treated cell (diameter of ROIs: ~1.5 μm). ROI selections for Ilimaquinone and Brefeldin A are presented in Figure S6i. (b) Abundance analysis across ministacks for 12 proteins (excluding Lamin B1) for control cells and Nocodazole, Ilimaquinone, and Brefeldin A-treated cells. Significance of difference in abundance: ns, *, **, ***, correspond to p ≥ 0.05, p < 0.05, p < 0.01, p < 0.001, respectively. (c) Median distances between localization events of different targets. Only localization events <200 nm to each other were considered. (d) Cluster map showing the Z-score (normalized within each cluster map) for the abundance of all target species. Each row represents one ROI. (e) UMAP analysis of the global spatial data for all 13 targets. For every localization, a feature vector is constructed from the number of localizations of all 13 target channels within a radius of 100 nm. These features are then projected into a 2-dimensional UMAP. (f) Structures in the UMAP can be analyzed by spatially mapping their content. Localizations in the black box in (e) are highlighted by color. Grey data points represent data from outside the boxed region in (e). (g) The highlighted data is then clustered in the spatial representation and analyzed for the abundance of targets within each cluster (see Figures S6j–m for details and additional examples). Scale bars: 5 μm (a), 1 μm (inset in a), 5 μm (f), 500 nm (inset in f).
Figure 7 –
Figure 7 –. Volumetric multiplexed cellular organelle imaging at super-resolution using FLASH-PAINT.
(a-d) Depth projection of the ER (a; Sec61β), mitochondria (b; Tom20), lysosomes (c; Lamp1) and Golgi complex (d; ManII-GFP) in a ~2.5-μm thick 4-plexed FLASH-PAINT data set of a HeLa cell. (e, f) 3D rendering of localization data (e) and surface rendering (f). (g-j) Representative examples of contact sites between the four organelles. The left image of each image pair displays both organelles for which contact sites are calculated; the right image only one of the organelles. The contact sites were computed for the ‘blue’ organelles with respect to the ‘yellow’ organelles and are displayed overlayed on top of the ‘blue’ organelles (distances >100 nm: blue; <100 nm: white and red). (k, l) Number of contact sites (k; defined as organelle distances <100 nm) and their median area (l). (m) Box plots of the areas of the individual contact sites. For each type of contact, the median (line) and 25% and 75% quartiles (bottom and top of the box) are indicated. Scale bars: 5 μm (a-f) 1 μm (g-j).

References

    1. Huang B, Bates M, and Zhuang X (2009). Super-resolution fluorescence microscopy. Annu Rev Biochem 78, 993–1016. 10.1146/annurev.biochem.77.061906.092014. - DOI - PMC - PubMed
    1. Baddeley D, and Bewersdorf J (2018). Biological Insight from Super-Resolution Microscopy: What We Can Learn from Localization-Based Images. Annu Rev Biochem 87, 965–989. 10.1146/annurev-biochem-060815-014801. - DOI - PubMed
    1. Sahl SJ, Hell SW, and Jakobs S (2017). Fluorescence nanoscopy in cell biology. Nat Rev Mol Cell Biol 18, 685–701. 10.1038/nrm.2017.71. - DOI - PubMed
    1. Balzarotti F, Eilers Y, Gwosch KC, Gynna AH, Westphal V, Stefani FD, Elf J, and Hell SW (2017). Nanometer resolution imaging and tracking of fluorescent molecules with minimal photon fluxes. Science 355, 606–612. 10.1126/science.aak9913. - DOI - PubMed
    1. Reinhardt SCM, Masullo LA, Baudrexel I, Steen PR, Kowalewski R, Eklund AS, Strauss S, Unterauer EM, Schlichthaerle T, Strauss MT, et al. (2023). Angstrom-resolution fluorescence microscopy. Nature 617, 711–716. 10.1038/s41586-023-05925-9. - DOI - PMC - PubMed

LinkOut - more resources