. 2024 Mar 29;12(1):20.
doi: 10.1038/s41413-024-00317-9.

Piezo1 channel exaggerates ferroptosis of nucleus pulposus cells by mediating mechanical stress-induced iron influx

Affiliations

Piezo1 channel exaggerates ferroptosis of nucleus pulposus cells by mediating mechanical stress-induced iron influx

Ziqian Xiang et al. Bone Res. .

Abstract

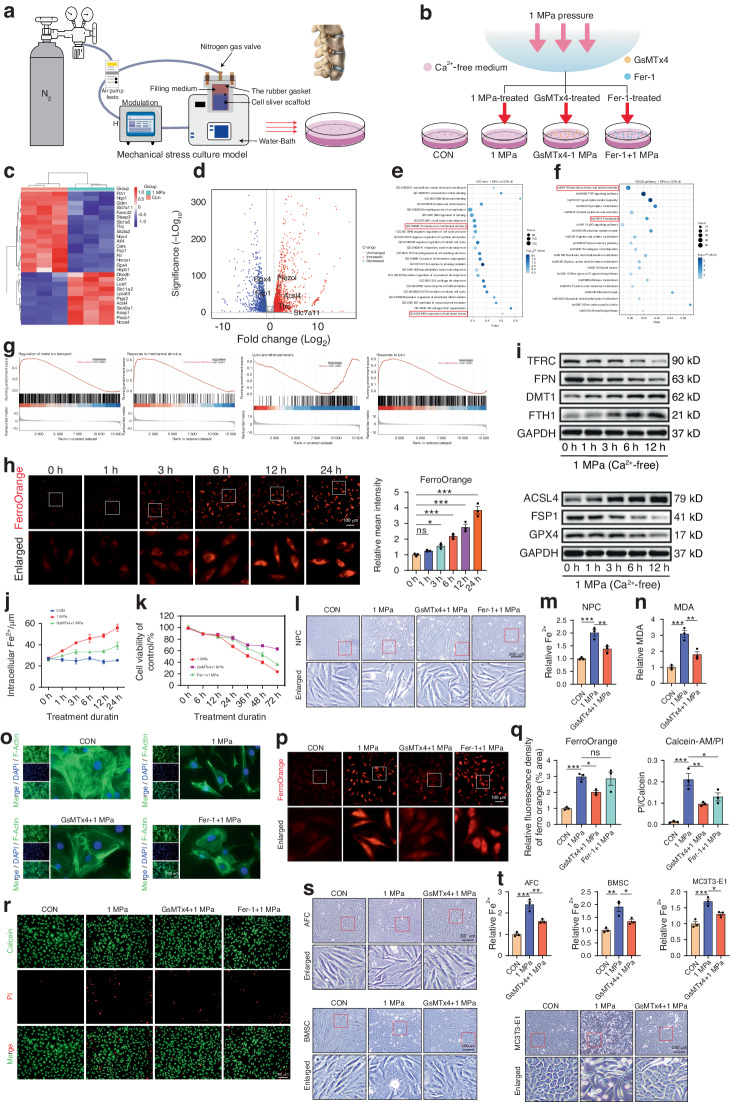
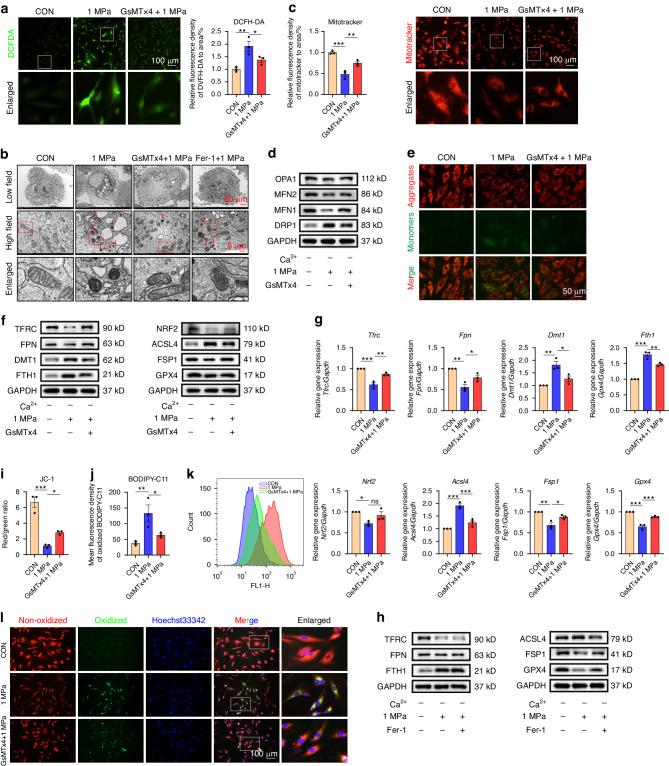
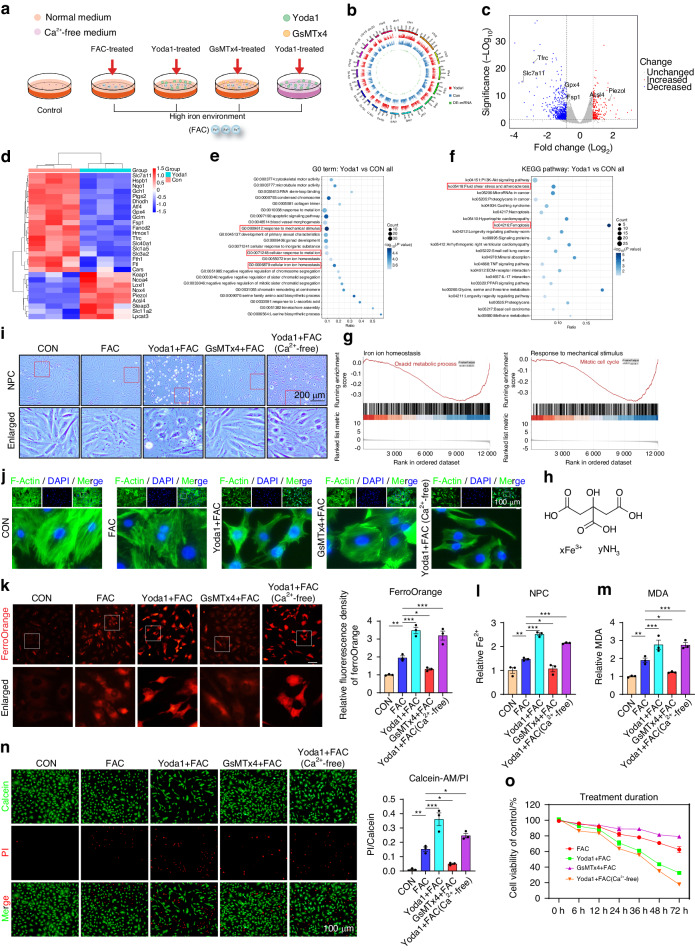
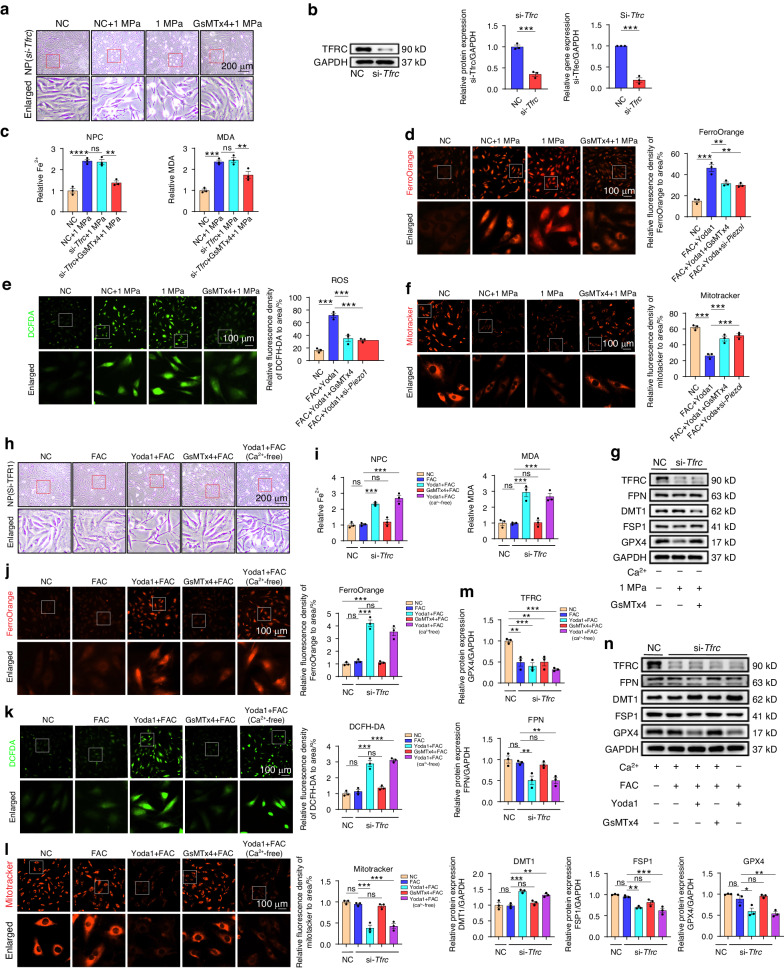
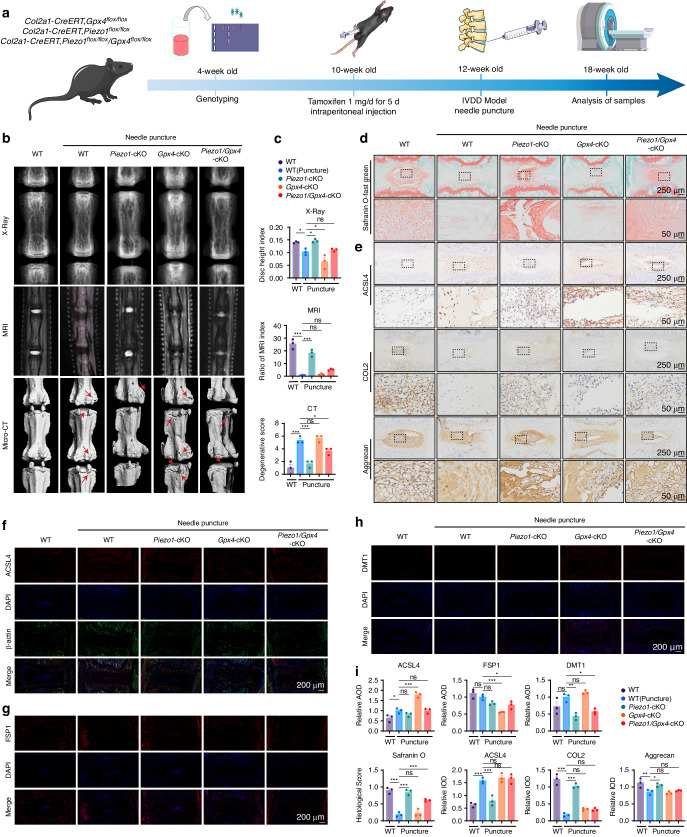
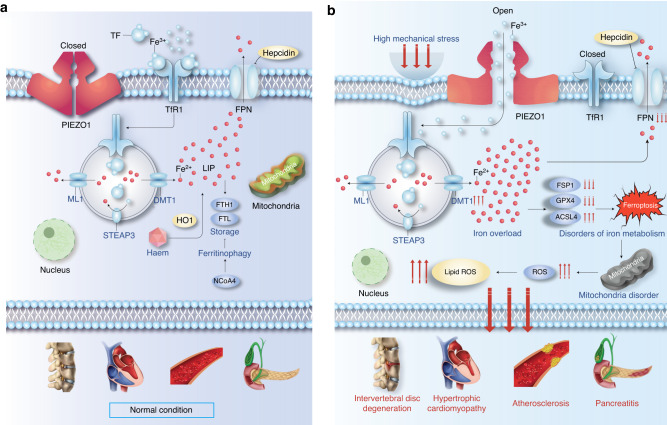
To date, several molecules have been found to facilitate iron influx, while the types of iron influx channels remain to be elucidated. Here, Piezo1 channel was identified as a key iron transporter in response to mechanical stress. Piezo1-mediated iron overload disturbed iron metabolism and exaggerated ferroptosis in nucleus pulposus cells (NPCs). Importantly, Piezo1-induced iron influx was independent of the transferrin receptor (TFRC), a well-recognized iron gatekeeper. Furthermore, pharmacological inactivation of Piezo1 profoundly reduced iron accumulation, alleviated mitochondrial ROS, and suppressed ferroptotic alterations in stimulation of mechanical stress. Moreover, conditional knockout of Piezo1 (Col2a1-CreERT Piezo1flox/flox) attenuated the mechanical injury-induced intervertebral disc degeneration (IVDD). Notably, the protective effect of Piezo1 deficiency in IVDD was dampened in Piezo1/Gpx4 conditional double knockout (cDKO) mice (Col2a1-CreERT Piezo1flox/flox/Gpx4flox/flox). These findings suggest that Piezo1 is a potential determinant of iron influx, indicating that the Piezo1-iron-ferroptosis axis might shed light on the treatment of mechanical stress-induced diseases.


Conflict of interest statement

The authors declare no competing interests.

Figures

Fig. 1
Fig. 1
Piezo1 channel leads to iron overload under mechanical stress. a Schematic illustration of mechanical stimulation devices. b Schematic illustration of the cells treated with different drugs under 1 MPa mechanical stress (n = 3). c Heatmap illustrating the different genes expression in NPCs. d Volcano plot of differentially expressed genes in 1 MPa mechanical stress. e, f GO a KEGG bubble plots of differentiated pathways in 1 MPa mechanical stress. g GSEA analysis showing the changes in regulation of metal ion transport and lipid pathway. h Detection of intracellular Fe2+ in NPCs at different time-points after stress treatment using FerroOrange and quantitative analysis of relative mean fluorescence intensity (MFI) (n = 3). i Western blot analysis of iron metabolic markers (TFRC, FPN, DMT1 and FTH1) and ferroptotic markers (ACSL4, FSP1, and GPX4) in different time after 1 MPa mechanical stimulation (n = 3). j Intracellular Fe2+ content are measured by Iron Assay Kit at different time-points (n = 3). k NPCs were treated with GsMTx4 or Fer-1 under 1 MPa mechanical stimulation for 6, 12, 24, 36, 48, and 72 h (n = 3). l The morphology of rat NPCs treated with GsMTx4 or Fer-1 under 1 MPa mechanical stimulation. m Observation of cytoskeleton in NPCs using Actin Tracker Kit. n, o Quantitative analysis of relative intracellular Fe2+ and MDA content of NPCs treated with 1 MPa mechanical stress with or without GsMTx4 for 24 h (n = 3). p Detection of intracellular Fe2+ in NPCs treated under different treatments for 24 h using FerroOrange and quantitative analysis of relative MFI (n = 3). q, r Cell death/live analysis showing cell death ratio of NPCs (n = 3). s, t Representative morphological changes in AFCs, BMSCs, and MC3T3-E1 after treatmen twith or without GsMTx4 under 1 MPa mechanical stress (n = 3). All data are expressed as the mean ± SEM, n = 3 replicates from one representative of 3 independent experiments. ns (no significance), *P < 0.05, **P < 0.01, ***P < 0.001
Fig. 2
Fig. 2
Mechanical stress affects ferroptosis through Piezo1 activation. a Detection of intracellular ROS in NPCs treated with GsMTx4 or Fer-1 under 1 MPa mechanical stress for 24 h in a Ca2+-free medium. using DCFH-DA and quantitative analysis of relative MFI (n = 3). b Representative transmission electron microscopy (TEM) images of NPCs treated with different stimulations for 24 h. Arrows indicate shrunken mitochondria. Scale bars, 20 μm (Low field), 5 μm (High field). c The mitochondrial function was detected using Mitotracker Kit. d WB analysis of mitochondrial function markers OPA1, Mfn2, Mfn1 and DRP1 of NPCs treated with or without GsMTx4 under 1 MPa mechanical stimulation for 24 h and quantification. GAPDH was used as an internal control (n = 3). e JC-1 assay showing mitochondrial membrane potential of NPCs. JC-1 monomer was stained green, and JC-1 aggregates were stained red. f WB analysis of iron metabolic markers and ferroptotic genes of NPCs. g PCR analysis of iron metabolic genes Tfrc, Fpn, Fth1 and ferroptotic genes Acsl4, Fsp1, Gpx4 of NPCs treated with or without GsMTx4 under 1 MPa mechanical stimulation for 24 h and quantification (n = 3). h WB analysis of iron metabolic markers and ferroptotic markers of NPCs treated with or without Fer-1 under 1 MPa stress for 24 h (n = 3). i, j Quantitative analysis of relative MFI (n = 3). k Representative histogram plot for fluorescence of oxidized BODIPY-C11. l Lipid ROS in NPCs treated with or without GsMTx4 under 1 MPa mechanical stress for 24 h by using BODIPY-C11. All data are expressed as the mean ± SEM, n = 3 replicates from one representative of 3 independent experiments. ns (no significance), *P < 0.05, **P < 0.01, ***P < 0.001
Fig. 3
Fig. 3
Pharmacological activation of the Piezo1 channel significantly increases iron overload. a Schematic illustrations of cells treated with Piezo1 agonist Yoda1 or inhibitor GsMTx4 under high iron environment. RNA sequencing analysis in rat NPCs treated with 10 μmol/L Yoda1 for 24 h in a Ca2+-free medium (n = 3). b Circle map analysis of NPCs. c Volcano plot of differentially expressed genes of NPCs treated with yoda1. d Microarray heatmap illustrating the different genes expression in NPCs. e, f GO and KEGG bubble plots analysis in NPCs. g GSEA analysis showing the changes in regulation of response to mechanical stimulus and iron ion homeostasis pathway. h Chemical structure of FAC. i Representative morphological changes of NPCs treated with Yoda1 or GsMTx4 in 100 μmol/L FAC for 24 h. j Actin Tracker Kit showing the changes of cytoskeleton in NP cells. k Detection of intracellular Fe2+ using FerroOrange and quantitative analysis of relative MFI (n = 3). l, m Quantitative analysis of relative intracellular Fe2+ and MDA content of NP cells treated with or without Yoda1 or GsMTx4 for 24 h in high iron environment (n = 3). n The cell death ratio was tested and quantification by cell death/live analysis (n = 3). o NPCs were treated with different drugs for 6, 12, 24, 36, 48, and 72 h, cell viability was assayed by CCK8 Kit (n = 3). All data are expressed as the mean ± SEM, n = 3 replicates from one representative of 3 independent experiments. ns (no significance), *P < 0.05, **P < 0.01, ***P < 0.001
Fig. 4
Fig. 4
Piezo1 channel-mediated iron overload leads to mitochondrial dysfunction, oxidative stress, and lipid peroxidation. a Representative TEM images of of NPCs exposed to the high iron environment, treated with Yoda1 or GsMTx4 for 24 h. Arrows indicate shrunken mitochondria. b Intracellular ROS detection by DCFH-DA and quantitative analysis of relative MFI. c Mitochondrial function of NPCs evaluated by Mitotracker. d, e WB analysis of mitochondrial functional markers, iron metabolic markers and ferroptotic markers of NPCs. (n = 3). f Quantitative analysis of relative MFI of Mitotracker. g PCR analysis of iron metabolic genes and ferroptotic genes of NPCs treated with different chemical stimulations for 24 h and quantification. (n = 3). h Mitochondrial membrane potential of NPCs was assessed through JC-1 assay. i, j The relative MFI was analysed by ImageJ software (n = 3). k Representative histogram plot for fluorescence of oxidized BODIPY-C11. l Intracellular lipid ROS of NPCs evaluated by C11 BODIPY 581/591. m Iron Assay Kit show the Intracellular Fe2+ content of different types of cells treated with different chemical stimulations for 24 h (n = 3). All data are expressed as the mean ± SEM, n = 3 replicates from one representative of 3 independent experiments. ns (no significance), *P < 0.05, **P < 0.01, ***P < 0.001
Fig. 5
Fig. 5
Piezo1-induced iron influx is independent of TFRC. Rat NPCs treated with or without GsMTx4 under 1 MPa mechanical stimulation for 24 h after Tfrc-siRNA transfection. a The morphology of rat NPCs after transfection. b PCR and WB analysis of NPCs and quantitation (n = 3). c Quantitative analysis of relative intracellular Fe2+ and MDA. df Representative images of NPCs were taken using FerroOrange, DCFH-DA and Mitotracker after transfection (n = 3). g Western blot analysis of TFRC, FPN, DMT1, FSP1 and GPX4 in NPCs treated with mechanical stimulation for 24 h after transfection with si-NC and si-Tfrc (n = 3). Rat NPCs treated with or without the stimulation of Yoda1 or GsMTx4 under a high iron environment and Tfrc-siRNA transfection. h Representative cell morphological changes are shown at 24 h of NPCs. i Relative intracellular Fe2+ and MDA were quantified after transfection (n = 3). jl Representative images of NPCs were taken using FerroOrange, DCFH-DA and Mitotracker. The relative MFI was analysed by ImageJ software (n = 3). m, n Western blot analysis of NPCs treated with mechanical stimulation for 24 h after transfecting and quantitation (n = 3). All data are expressed as the mean ± SEM, n = 3 replicates from one representative of 3 independent experiments. ns (no significance), *P < 0.05, **P < 0.01, ***P < 0.001
Fig. 6
Fig. 6
Deficiency of the Piezo1 channel attenuates IVDD development through GPX4. a Flowchart of animal experiments on Piezo1-cKO、Gpx4-cKO、Piezo1/Gpx4-cKO mice. b The X-Ray, MRI and Micro-CT images for coccygeal disks of mice after needle puncture. c Quantitative analysis of X-ray、MRI and Micro-CT (n = 3). d The Safranine O-Fast Green staining of WT, Piezo1-cKO, Gpx4-cKO and Piezo1/Gpx4-cKO mice. Scale bar, 250 μm. e The immunohistochemical assay of ACSL4, COL2 and Aggrecan of mice. Scale bar, 250 μm. fh Immunofluorescence staining analysis of ACSL4、DMT1、FSP1 in different mice. Scale bar, 200 μm. i Quantitative analysis of the immunofluorescence staining, Safranine O-Fast Green staining and immunohistochemical assay (n = 3). All data are expressed as the mean ± SEM, n = 3 replicates from one representative of 3 independent experiments. ns (no significance), *P < 0.05, **P < 0.01, ***P < 0.001
Fig. 7
Fig. 7
Schematic diagram of iron metabolic pattern. a Iron metabolic pattern of cells under normal condition. b Iron metabolic pattern of cells under mechanical stress

Similar articles

Cited by

References

    1. Koleini N, Shapiro JS, Geier J, Ardehali H. Ironing out mechanisms of iron homeostasis and disorders of iron deficiency. J. Clin. Invest. 2021;131:e148671. doi: 10.1172/JCI148671. - DOI - PMC - PubMed
    1. Delijewski M, Bartoń A, Maksym B, Pawlas N. The link between iron turnover and pharmacotherapy in transplant patients. Nutrients. 2023;15:1453. doi: 10.3390/nu15061453. - DOI - PMC - PubMed
    1. Sevimli G, et al. Nitric oxide biosensor uncovers diminished ferrous iron-dependency of cultured cells adapted to physiological oxygen levels. Redox Biol. 2022;53:102319. doi: 10.1016/j.redox.2022.102319. - DOI - PMC - PubMed
    1. Donovan A, et al. The iron exporter ferroportin/Slc40a1 is essential for iron homeostasis. Cell Metab. 2005;1:191–200. doi: 10.1016/j.cmet.2005.01.003. - DOI - PubMed
    1. Hassannia B, Vandenabeele P, Vanden Berghe T. Targeting ferroptosis to iron out cancer. Cancer Cell. 2019;35:830–849. doi: 10.1016/j.ccell.2019.04.002. - DOI - PubMed