. 2024 Mar 29;15(1):2760.
doi: 10.1038/s41467-024-47046-5.

Cholesterol-binding motifs in STING that control endoplasmic reticulum retention mediate anti-tumoral activity of cholesterol-lowering compounds

Affiliations

Cholesterol-binding motifs in STING that control endoplasmic reticulum retention mediate anti-tumoral activity of cholesterol-lowering compounds

Bao-Cun Zhang et al. Nat Commun. .

Abstract

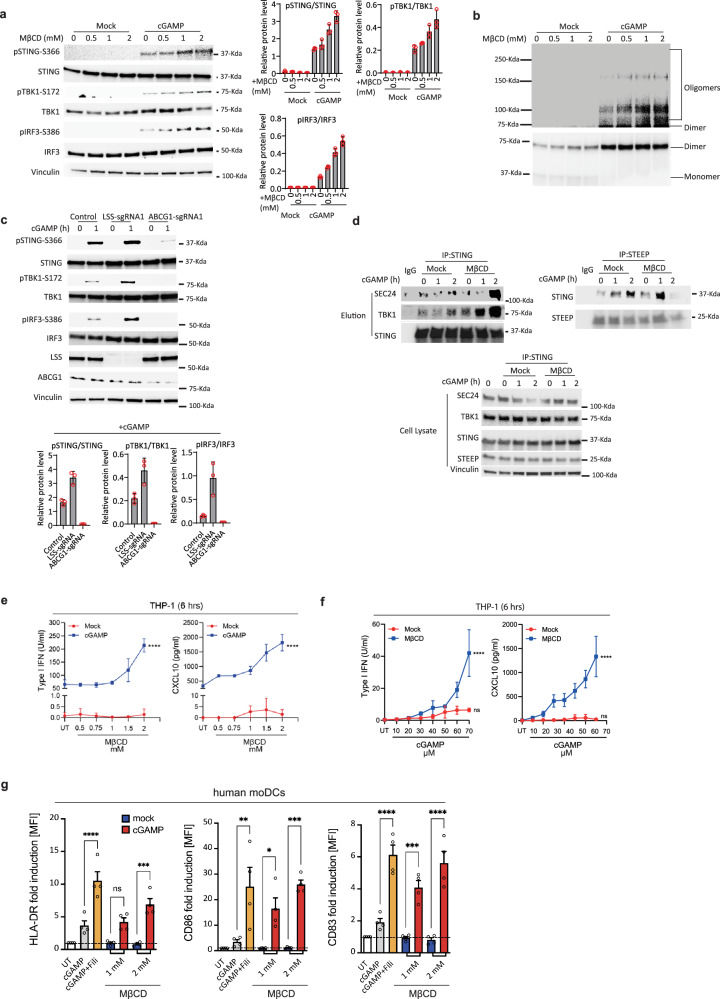
The cGAS-STING pathway plays a crucial role in anti-tumoral responses by activating inflammation and reprogramming the tumour microenvironment. Upon activation, STING traffics from the endoplasmic reticulum (ER) to Golgi, allowing signalling complex assembly and induction of interferon and inflammatory cytokines. Here we report that cGAMP stimulation leads to a transient decline in ER cholesterol levels, mediated by Sterol O-Acyltransferase 1-dependent cholesterol esterification. This facilitates ER membrane curvature and STING trafficking to Golgi. Notably, we identify two cholesterol-binding motifs in STING and confirm their contribution to ER-retention of STING. Consequently, depletion of intracellular cholesterol levels enhances STING pathway activation upon cGAMP stimulation. In a preclinical tumour model, intratumorally administered cholesterol depletion therapy potentiated STING-dependent anti-tumoral responses, which, in combination with anti-PD-1 antibodies, promoted tumour remission. Collectively, we demonstrate that ER cholesterol sets a threshold for STING signalling through cholesterol-binding motifs in STING and we propose that this could be exploited for cancer immunotherapy.


Conflict of interest statement

M.R.J. is shareholder within STipe Therapeutics that develop cancer immunotherapies targeting the STING pathway. The remaining authors declare no competing interests.

Figures

Fig. 1
Fig. 1. Depletion of cholesterol potentiate STING pathway responses.
a Immunoblot analysis of THP1 cells treated with increasing MβCD doses (0–2 mM) before cGAMP (50 µg/ml) stimulation for 1 h. Quantified data presented as mean ± SD from three independent experiments. b Immunoblot analysis of STING dimer and oligomer formation in THP1 cells treated with increasing doses of MβCD before stimulation with cGAMP (50 µg/ml, 1 h). (n = 3 biologically independent experiments with similar results). c THP1 cells electroporated with Cas9 protein and gene-specific sgRNAs as indicated. Five days post-electroporation, cells stimulated with vehicle or cGAMP (50 µg/ml) for 1 h. Immunoblot analysis performed for indicated protein levels. Quantified data shown as mean ± SD from three independent experiments. d Immunoblot analysis of STING, SeC24 or TBK1 co-immunoprecipitated with either endogenous expressed STING or STEEP in THP1 cells. Prior to the immunoprecipitation cells were pre-treated with mock or MβCD (2 mM) and then stimulated with cGAMP (50 µg/ml). IgG from the Sheep/Rabbit serum was used as negative controls. (n = 2 biologically independent experiments with similar results). e, f THP1-derived macrophages were treated with cGAMP (5 µM) with varying concentrations of MβCD (e) or treated with MβCD (1 mM) and varying amounts of cGAMP (5 µM) (f) for a total of 6 h. Cell supernatants were analyzed for IFNα/β by HEK-blue bioassay and CXCL10 expression using ELISA. g Flow cytometry analysis of expression levels of maturation markers HLA-DR, CD86, and CD83 in human DC treated with cGAMP (5 µM) with or without filipin-III (1 µg/ml) or methyl-β-cyclodextrin (MβCD) (1 or 2 mM). The experiments for (ad) were independently repeated three times with similar results. The representative data from one experiment is shown in the figure. The experiment for (e, f, g) represent one experiment (repeated twice) done in experimental triplicates shown as mean ± SD. Statistical significance in experiment (e, f, g) was assessed using one-way ANOVA with Tukey’s multiple comparison correction. (ns not significant; *p < 0.05; **p < 0.01, ***p < 0.001).
Fig. 2
Fig. 2. cGAMP triggers SOAT1-Mediated ER Cholesterol Reduction.
a Colocalization analysis of ER and cholesterol in THP1 cells. Cells were probed with ER-Tracker™ Red and BODIPY-Cholesterol, then either unstimulated or stimulated with cGAMP (50 µg/ml) for 0, 2, or 4 h. Colocalization analyzed using ImageStream. Three cell examples without stimulation demonstrate cholesterol-ER colocalization. b Confocal microscopy of THP1 cells pre-stained with Bodipy 480 nm-Cholesterol and ER tracker, then untreated or treated with vehicle or cGAMP (50 µg/ml) for 1, 2, and 4 h. Images acquired using Zeiss LSM 800 confocal microscope, processed with Zen Blue software, and analyzed with ImageJ. c 15 images per group in (b) quantified using Pearson correlation coefficient tool in ImageJ. Box plot depicts data distribution. d THP1 cells electroporated with Cas9 protein and sgRNAs, then stimulated with 50 ug/ml cGAMP for 1 h. Phosphorylation levels of TBK, IRF3, and STING analyzed by immunoblotting. The sgRNA targeting the AAVS1 Safe-Harbor Site was used as control. The experiment was independently repeated three times with similar results. e Blot quantification data of (d) presented as mean ± SD from three independent experiments. f Colocalization analysis of ER and cholesterol in WT or SOAT1 KO THP1 cells using ImageStream. The cells were probed with ER-Tracker™ Red and BODIPY-Cholesterol, then stimulated with vehicle or cGAMP for 2 h. g Confocal microscopy of THP1 WT/ STING KO/ SOAT1 KO cells pre-stained with Bodipy 480nm-Cholesterol and ER tracker, then treated with vehicle or cGAMP for 2 h. Pearson correlation coefficient (r) quantification performed on 20 vehicle and 15 cGAMP-treated images per group. The experiments for (a, f) represent one experiment out of three independent experiments, with 10,000 cells per sample for colocalization percentage calculation. Quantitative results are presented as mean ± SD. Statistical analysis conducted with one-way ANOVA. Statistical analysis of (c, g) performed using one-way ANOVA with Tukey’s multiple comparison test. Representative data from one experiment shown (n = 2 biologically independent experiments with similar results). (ns not significant; *p < 0.05; **p < 0.01).
Fig. 3
Fig. 3. Depletion of cellular cholesterol facilitates STING trafficking from ER to Golgi.
a HEK293T cells with stable STING expression were treated with or without MβCD (2 mM) and then stimulated with vehicle or cGAMP (50 µg/ml) for 1 h. Fixed with 4% PFA, cells were stained with anti-PDI, anti-STING, and anti-GM130 to analyze STING trafficking from ER to Golgi via image stream. Three cell examples demonstrate the definition of cholesterol-ER colocalization. Quantitative results are presented as mean ± SD. Experiment included three sample replicates under the same conditions, with 10,000 cells per sample collected to calculate colocalization percentage. Statistical analysis performed as two-tailed unpaired t-test. b In vitro membrane budding assay containing cytosolic fractions from untreated THP1 cells and membrane fraction from microsomes extracted from THP1 cells treated with increasing doses of MβCD (0, 1, 2 mM) for 4 h. Budded materials were analyzed by immunoblotting to assess cholesterol depletion’s effect on membrane budding. “Membrane only” (M/O) served as a negative control. Experiment was independently repeated thrice with similar results. Blot quantification data presented as mean ± SD from three independent experiments. Statistical analysis conducted using one-way ANOVA with Tukey’s multiple comparisons test. c THP1 cells treated with or without MβCD (2 mM) and then stimulated with vehicle or cGAMP (50 µg/ml) for 1 h. Cells probed with anti-PDI (ER marker), anti-GM130 (Golgi marker), and anti-STING, analyzed using Zeiss LSM 800 confocal microscope. Images processed with Zen Blue software 3.8 (Zeiss) and analyzed with ImageJ. Ten images per group quantified through Pearson correlation coefficient (r) for STING-ER colocalization and Manders’ overlap coefficient for STING-Golgi colocalization in ImageJ. Box plot depicts data distribution. d THP1 cells treated with vehicle, MβCD (2 mM, 2 h), Cholesterol (5 mM, overnight), fixed with 4% PFA, stained with anti-Sec24 and anti-PDI. Samples subjected to Zeiss LSM 800 confocal microscope analysis. Ten images per group quantified for Sec24 foci using ImageJ. Statistical analysis of (c, d) conducted using Statistical analysis of (c, g) performed using one-way ANOVA with Tukey’s multiple comparison test; showing one representative dataset out of two biologically independent experiments, yielding similar results (ns not significant; *p < 0.05; **p < 0.01).
Fig. 4
Fig. 4. Cholesterol limits the ER membrane curvature and retains STING at ER through direct interaction.
a GFP-tagged ALPS (GFP133) construct transfected into HEK293T cells with stable STING expression. Cells pre-treated with vehicle or MβCD (2 mM) for 2 h, then stimulated with vehicle or cGAMP (50 µg/ml) for 1 h. Fixed cells probed with anti-PDI and analyzed by ImageStream. Three cell examples illustrate cholesterol-ER colocalization. Quantification shown as mean ± SD. The statistical analysis was done using one-way ANOVA with Tukey’s multiple comparisons test. b THP1 cells pre-treated with MβCD (2 mM) for 2 h, then stimulated with vehicle or cGAMP (50 µg/ml) for 40 min. Fixed cells stained with anti-Clim63, anti-Nogo, and anti-STING for ER morphology analysis. Nogo:Climp63 ratio quantified using ImageJ. Statistical analysis: one-way ANOVA with Tukey’s multiple comparison, including a two-sided test. Data represent one experiment out of two independent experiments with similar results. c Schematic of pull-down assay using cholesterol-coated beads. d The level of STING protein bound to cholesterol was determined by immunoblotting (shown as a representative image out of n = 3 experiments). e Mass spectrometry analysis of cholesterol binding on STING. Immunoprecipitation with FLAG-bead using HEK293T lysates expressing Flag-tagged STING-WT or mutants. Cholesterol levels quantified (n = 2 independent experiments) – see chromatogram in Fig. S7. f ISRE reporter gene assay in HEK293T cells with STING stable expression. Luciferase activity measured using Dual Glo kit. Quantitative results are presented as mean ± SD. Data represent one experiment out of three independent experiments. g, h ImageStream analysis of STING-ER (g) and STING-Golgi (h) colocalization. The experiments for (a, g, h) are represented from one experiment (out of a total of 3 independent experiments) with 10,000 cells per sample collected to calculate the colocalization percentage. Quantitative results are presented as mean ± SD. The statistical analysis was done with one-way ANOVA. The statistical analysis of (f, g, h) was done using one-way ANOVA with Tukey’s multiple comparison correction, and data was illustrated as mean ± SD (ns, not significant; *p < 0.05; **p < 0.01, ***p < 0.001).
Fig. 5
Fig. 5. Cholesterol depletion through Methyl-β cyclodextrin in vivo stalls tumor growth in a STING-dependent manner.
a C56BL/6 mice (n = 5) were inoculated with 1 × 106 MC38 colon adenocarcinoma cells on right flank and treated with various doses of MβCD by intratumoral injection on day 7, 10, and 13. Tumor growth is shown as mean ± SEM. b C56BL/6 mice (n = 8) with MC38 tumors were treated with high (30 mg/kg) and low (0.3 mg/kg) dose of MβCD by intratumoral injection on day 7, 10, and 13. Tumor growth is shown as mean ± SEM. The individual spaghetti plots can be seen in Supplementary Fig 9. Statistically significant differences were calculated using a two-way ANOVA with Geisser-Greenhouse correction followed by Holm–Sidak’s multiple comparisons test (**p < 0.01). c Kaplan–Meier plot depicting probability of survival in each of the treatment groups. Statistically significant difference was calculated using Mantel-Cox Log-rank test. (**p < 0.01). d Tumor volume measurements in C57BL/6 STING-deficient mice (n = 6) (the golden ticket strain) following same treatment regime as wildtype mice. Tumor growth is shown as mean ± SEM. e C56BL/6 mice (n = 8) with MC38 tumors were treated with MβCD (0.3 mg/kg) or 2′3′-cGAMP (1 µg/dosage), or the combination by intratumoral injection on day 10, 13, and 16. Tumor growth is shown as mean ± SEM. Statistically significant differences were calculated using two-way ANOVA with Holm–Sidak’s multiple comparisons test (**p < 0.01). f Immunoblot analysis of STING and TBK1 phosphorylation levels in tumors (n = 3 different mouse/group) from mice treated with MβCD (0.3 mg/kg) or 2′3′-cGAMP (1 µg/dosage), or the combination by intratumoral injection. g C56BL/6 mice (n = 5) with MC38 tumors were treated with three different treatment schemes on day 8, 11, and 14. Treatment consisted of (i) 0.3 mg/kg dose of MβCD delivered by intratumoral injection, (ii) 10 mg/kg anti-PD-1 antibody (RMP1-14) delivered as intraperitoneal injection, or (iii) a combination of MβCD and RMP1-14. Tumor growth is shown as mean ± SEM. Statistically significant differences were calculated using two-way ANOVA with Holm–Sidak’s multiple comparisons test (**p < 0.01; ****p < 0.0001). h Kaplan–Meier plot depicting probability of survival. Statistically significant difference was calculated using Mantel-Cox Log-rank test. (**p < 0.01).
Fig. 6
Fig. 6. The expression level of genes involved in positive cholesterol metabolism is inversely correlated with the response of ISGs in cancer.
a Classification of TCGA patient tumors based on expression level of the indicated genes related with positive cholesterol regulation. b Box plots of The Cancer Genome Atlas (TCGA) RNA expression profiles in prostate adenocarcinoma (PRAD), Bladder Urothelial Carcinoma (BLCA), and Head-Neck Squamous Cell Carcinoma (HNSC). The highest and lowest 25% of cholesterol metabolism were analyzed by comparing cholesterol metabolism-high and cholesterol metabolism-low groups, respectively. Statistical analysis was performed using a two-tailed Mann-Whitney test. The upper and lower ends of the boxes represent the upper and lower quartiles, and the horizontal line inside the box is the median of the dataset. The whiskers indicate the upper and lower extremes of the dataset (NSp > 0.05, **p <  0.01). c Classification of TCGA patient tumors into radiation-sensitive and -resistant classes based on the previous report. d, e Box plots of TCGA RNA expression profiles are shown in panel (d) for cholesterol synthesis genes SCAP and SREBF1, and in panel (e) for ISG genes, comparing the radiation-sensitive and radiation-resistant classes. (ns not significant; *p < 0.05; **p < 0.01; ***p < 0.001).

References

    1. Hopfner KP, Hornung V. Molecular mechanisms and cellular functions of cGAS-STING signalling. Nat. Rev. Mol. Cell Biol. 2020;21:501–521. doi: 10.1038/s41580-020-0244-x. - DOI - PubMed
    1. Paludan SR. Activation and regulation of DNA-driven immune responses. Microbiol. Mol. Biol. Rev. 2015;79:225–241. doi: 10.1128/MMBR.00061-14. - DOI - PMC - PubMed
    1. Jeltema D, Abbott K, Yan N. STING trafficking as a new dimension of immune signaling. J. Exp. Med. 2023;220:e20220990. doi: 10.1084/jem.20220990. - DOI - PMC - PubMed
    1. Zhang BC, et al. STEEP mediates STING ER exit and activation of signaling. Nat. Immunol. 2020;21:868–879. doi: 10.1038/s41590-020-0730-5. - DOI - PMC - PubMed
    1. Zhao BY, et al. A conserved PLPLRT/SD motif of STING mediates the recruitment and activation of TBK1. Nature. 2019;569:718. doi: 10.1038/s41586-019-1228-x. - DOI - PMC - PubMed

MeSH terms