. 2024 Mar 29;15(1):2750.
doi: 10.1038/s41467-024-46832-5.

Structure of alpha-synuclein fibrils derived from human Lewy body dementia tissue

Affiliations

Structure of alpha-synuclein fibrils derived from human Lewy body dementia tissue

Dhruva D Dhavale et al. Nat Commun. .

Abstract

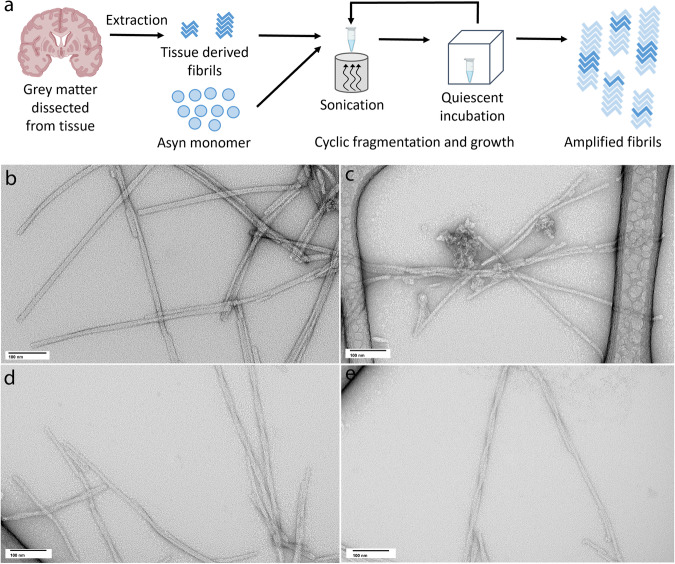
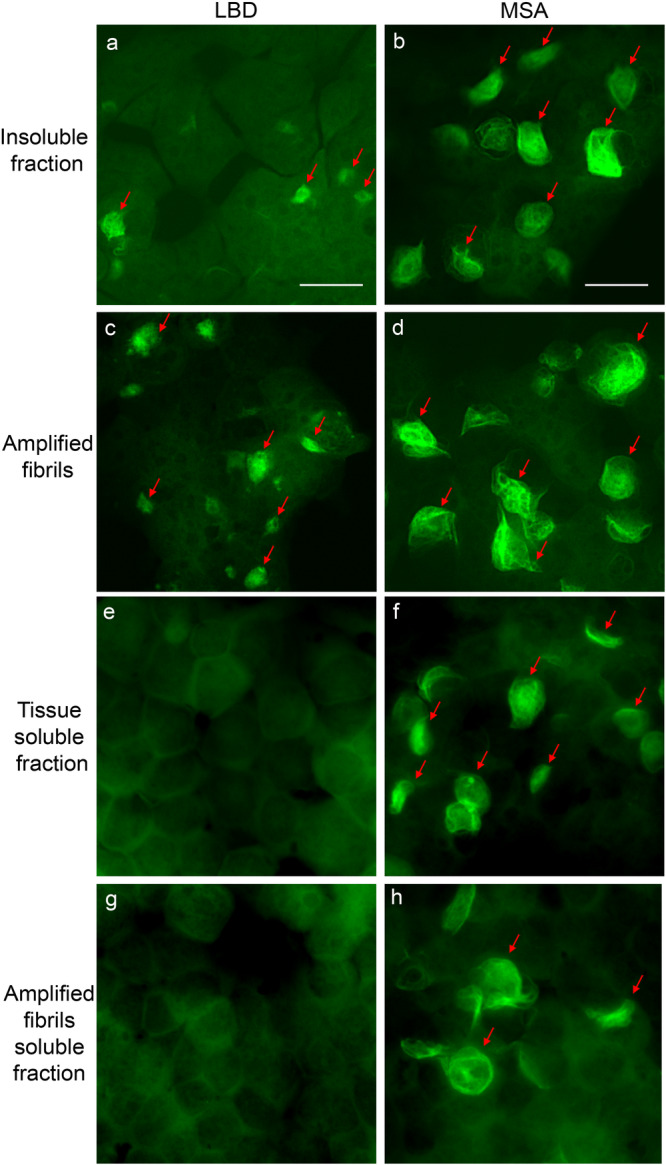
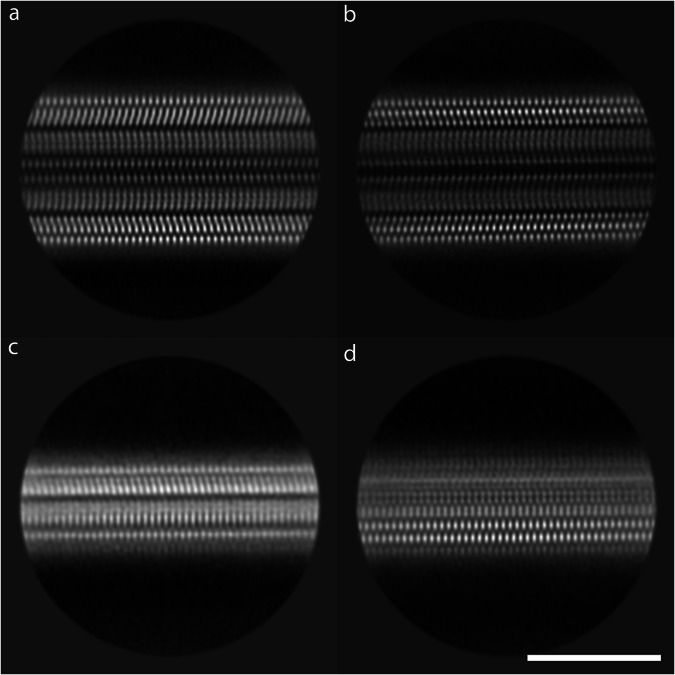
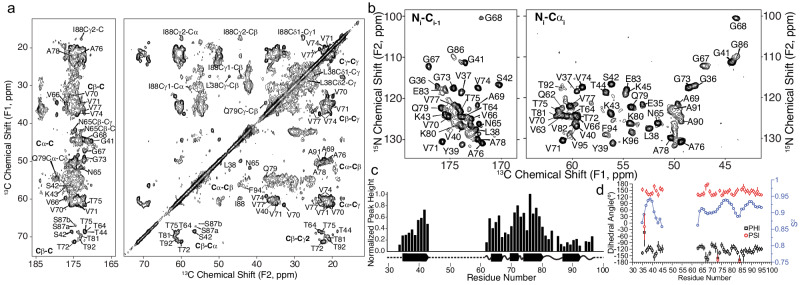
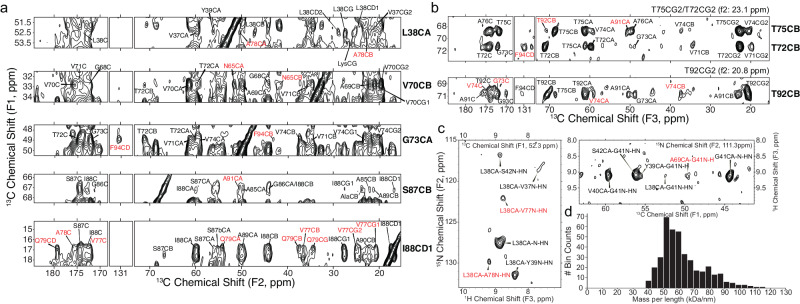
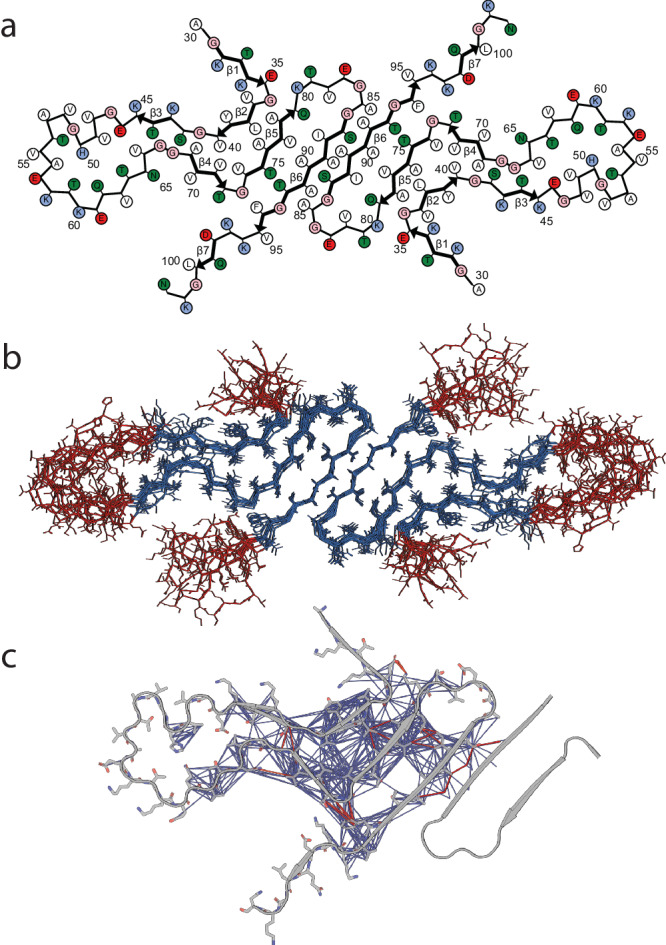
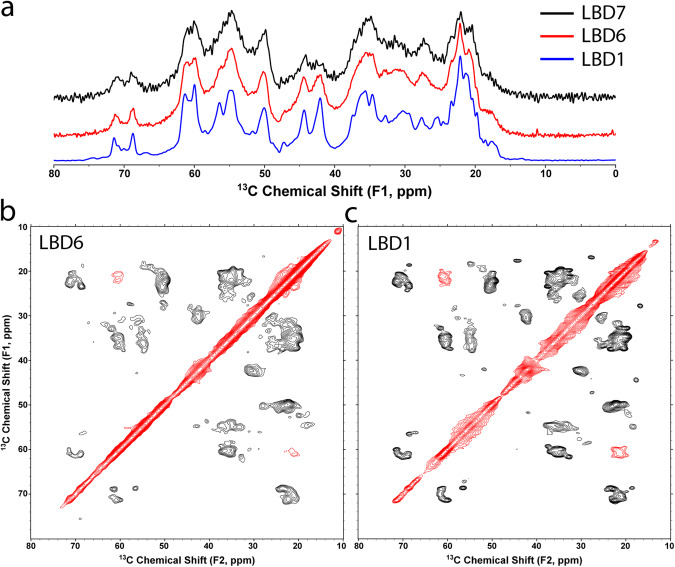
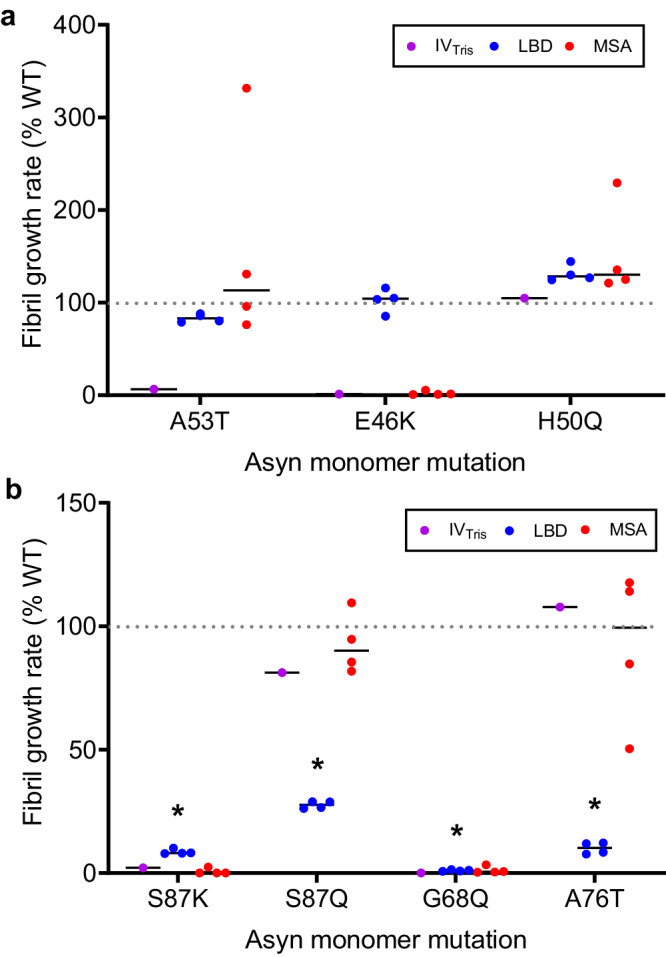
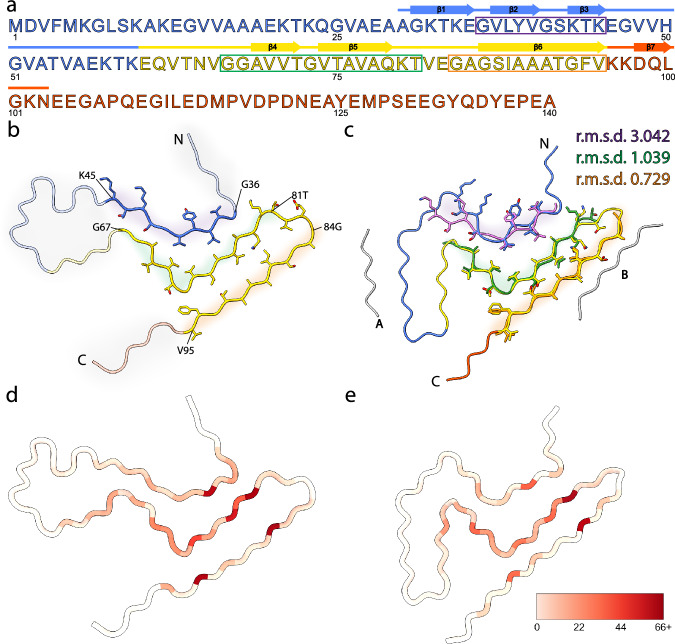
The defining feature of Parkinson disease (PD) and Lewy body dementia (LBD) is the accumulation of alpha-synuclein (Asyn) fibrils in Lewy bodies and Lewy neurites. Here we develop and validate a method to amplify Asyn fibrils extracted from LBD postmortem tissue samples and use solid state nuclear magnetic resonance (SSNMR) studies to determine atomic resolution structure. Amplified LBD Asyn fibrils comprise a mixture of single protofilament and two protofilament fibrils with very low twist. The protofilament fold is highly similar to the fold determined by a recent cryo-electron microscopy study for a minority population of twisted single protofilament fibrils extracted from LBD tissue. These results expand the structural characterization of LBD Asyn fibrils and approaches for studying disease mechanisms, imaging agents and therapeutics targeting Asyn.


Conflict of interest statement

Authors specified below have a patent application pending titled “Tissue-Seeded Fibrils and Methods of Making and Using Same”. Patent applicant: Washington University in St. Louis, Name of inventors: Paul T. Kotzbauer, Dhruva D. Dhavale, Rebecca Miller and Jennifer Y. O’Shea, Application number: 17/858817, Status of application: Pending. The patent application covers the process of generating amplified fibrils, its methods and composition. Other authors declares no competing interests.

Figures

Fig. 1
Fig. 1. Schematic illustrating extraction and amplification of LBD Asyn fibrils derived from postmortem tissue samples.
a Fibrils were isolated in an insoluble fraction by sequential extraction and centrifugation of tissue samples. The insoluble fraction seeds were combined with recombinant Asyn monomer and subjected to multiple rounds of sonication followed by quiescent incubation at 37 °C to generate amplified fibrils. be Representative negative stain TEM images of LBD amplified fibrils (b), control amplified fibrils (c), MSA amplified fibrils (d) and IVTris fibrils (e). Similar results were obtained from negative stain TEM images collected for at least three independently prepared fibril samples.
Fig. 2
Fig. 2. Seeding properties of tissue-derived and amplified fibrils in HEK 293 biosensor cells expressing A53T Asyn-CFP/YFP.
Fluorescence images show cells seeded with: a LBD Insoluble fraction. b MSA insoluble fraction. c LBD amplified fibrils. d MSA amplified fibrils. e LBD tissue soluble fraction. f MSA tissue soluble fraction. g LBD amplified fibrils soluble fraction. h MSA amplified fibril soluble fraction. Red arrows indicate intracellular inclusions. Similar results were observed in more than three independent experiments examining amplified fibrils for three cases of LBD and three cases of MSA. Scale bar = 10 µm.
Fig. 3
Fig. 3. Cryo-EM 2D class averages for LBD amplified fibrils.
a, b Examples of 2D class averages for two protofilament fibril classes obtained from single particle cryo-EM data. c, d Examples of 2D class averages for single protofilament fibril classes obtained from single particle cryo-EM data. Scale bar = 10 nM.
Fig. 4
Fig. 4. SSNMR assignments, long range contacts, and MPL measurements showing 2 protofilaments are the dominant population of fibrils.
a 13C-13C correlation of 13C-15N labeled LBD fibril showing carbonyl (left panel) and aliphatic (right panel) with unambiguous assignments labeled on the spectrum. Data was acquired at 750 MHz 1H frequency with 16.667 kHz magic-angle spinning and sample temperature 10 ± 5 oC with 75 ms DARR mixing. b 2D projections of a (left) CO-N-H 3D and (right) CA-N-H experiment with backbone assignments of a 13C, 2H, 15N labeled sample. Data in (b) were acquired at 750 MHz 1H frequency with 33.333 kHz magic-angle spinning, using a 6 ms 15N-13C cross polarization. 3Ds were collected using non-uniform sampling followed by reconstruction using SMILE prior to Fourier transformation. c Peak heights are plotted for unambiguous assignments from a uniformly sampled CANH 3D spectrum collected on the uniformly 13C,15N-labeled sample. Bars are normalized to the peak height for residue A76. Predicted secondary structure from TALOS-N is plotted below the peak height plot for the LBD tissue-seeded sample. d TALOS-N derived dihedral Phi and Psi angles reveal a beta-sheet structure. Predicted RCI chemical shift ordered parameter is plotted in blue showing highly ordered (R2 > 0.9) regions between G36 and G41, T64 and T81, and A85 to V95.
Fig. 5
Fig. 5. Long-range correlations determined by SSNMR.
a Long-range unambiguous correlations identified using 12 ms of PAR mixing between L38 V70, G73, S87, I88 found uniquely resolved within a 13C-13C 2D correlation experiment. b 2D strip plots from a 3D 13C-13C-13C correlation spectrum showing correlations from three threonine (T72, T75, T92) residues that are disambiguated in F1 and F2 relative to the 2D spectrum. c Long-range contacts identified within a hCAhhNH experiment showing close contact between L38 with A76 and V77 and G41 with A69. d Mass per unit length histogram of the LBD fibril measured with dark-field, unstained TB-TEM micrograph.
Fig. 6
Fig. 6. Structure of LBD amplified fibrils.
a Cartoon representation of the LBD fibrils determined via SSNMR studies. b 10 lowest energy structures of LBD fibril determined. Blue represent well-ordered regions with large amount of intermolecular contacts; red represent relatively disordered regions with few intermolecular contacts detectable using CP based polarization techniques. c Inter-residue contacts identified from SSNMR CP based experiments. Magenta lines are intramolecular contacts manually identified within spectra, blue lines are correlations identified utilizing the PASD algorithm for probabilistic assignments.
Fig. 7
Fig. 7. Spectral comparison of amplified fibrils from three LBD cases.
a 1D 13C cross polarization spectra show the rigid fibril cores of LBD1 (blue), LBD6 (red) and LBD7 (black) amplified fibrils. The aliphatic region of the spectra is shown, highlighting the similarities in the peak positions and relative intensities between the samples. b, c 2D 13C-13C correlation spectra with 1 ms POSTC7 mixing of (b) LBD6 and (c) LBD1 fibrils. Black contours (positive) correspond to correlations between bound 13C nuclei pairs, and red contours (negative) correspond to correlations of 13C nuclei two atoms apart. The chemical shifts are highly similar overall, in particular for diagnostic sidechains of Ala, Thr and Val residues.
Fig. 8
Fig. 8. Fibril growth rates for in vitro assembled fibrils and amplified fibrils in the presence of mutant Asyn monomer.
a WT-normalized growth rates in the presence of Asyn monomer with familial PD mutations A53T, E46K and H50Q. b WT-normalized growth rates in the presence of Asyn monomer with S87K, S87Q, G68Q and A76T mutations. Each data point represents the mean growth rate (n = 3 replicates) obtained for amplified fibrils prepared from each individual autopsy case for LBD (blue) and MSA (red), in addition to IVTris fibrils (magenta). Fibril growth rate measurements were performed for amplified fibrils from four LBD cases and four MSA cases. Asterisks indicate the mutant monomers with statistically significantly lower growth rates relative to WT monomer for LBD cases. Growth rates for MSA amplified fibrils had higher variability, including for WT monomer, and differences between mutant and WT monomer were not significant. The results indicate that four mutations (S87K (p = 0.009), S87Q (p = 0.008), G68Q (p = 0.007) and A76T (p = 0.009)) significantly reduce growth rates of LBD fibrils. Two of these mutations (S87K and G68Q) also appear to reduce IVTris and MSA fibril growth rates, but the other two (S87Q and A76T) do not. Data were analyzed with the unpaired, two-tailed t-test (Welch) and corrected for multiple comparisons with the Holm-Bonferroni method (significance level of 0.05). Data presented as mean ± SD, independent experiments = 2. Similar results were obtained from two independent experiments. Source data are provided as a Source Data file.
Fig. 9
Fig. 9. SSNMR structure of amplified Asyn resembles cryo-EM structure of extracted filaments.
a Primary sequence of human Asyn, with beta-strands annotated with arrows. The amphipathic N-terminal region, hydrophobic non-amyloid beta-component of plaque (NAC) region, and acidic C-terminal region are colored blue, yellow, and red, respectively. The purple, green, and orange rectangles denote the residue ranges used for subsequent comparison studies. b Atomic model of SSNMR LBD Asyn core structure with labeled N- and C- termini (PDB 8FPT). Areas of low confidence are depicted with transparent cartoons with grey highlights. Residue ranges modeled with high confidence are depicted as cartoons with sidechains as sticks and are highlighted in purple, green, and orange. c Atomic model of cryo-EM LBD Asyn core structure (PDB 8A9L), colored as in (b). The unidentified proteinaceous islands are in grey. High-confident residue ranges of the SSNMR structure are overlayed in purple, green, and orange, and root-mean-square deviations (r.m.s.d) of the main-chain atoms were calculated. d Number of satisfied NMR-derived interatomic distances mapped onto the lowest-energy structure using Xplor-NIH calculations on a per-residue basis using initial assignments from PASD. The color scale extends from white, indicating few or no NMR-derived distances were observed for the residue, to red, indicating many NMR-derived distances were observed for the residue. e Number of satisfied NMR-derived distances mapped onto the cryo-EM Asyn core structure (PDB 8A9L).

Update of

References

    1. Forno LS. Neuropathology of Parkinson’s disease. J. Neuropathol. Exp. Neurol. 1996;55:259–272. doi: 10.1097/00005072-199603000-00001. - DOI - PubMed
    1. Appel-Cresswell S, et al. Alpha-synuclein p.H50Q, a novel pathogenic mutation for Parkinson’s disease. Mov. Disord. 2013;28:811–813. doi: 10.1002/mds.25421. - DOI - PubMed
    1. Golbe LI, Di Iorio G, Bonavita V, Miller DC, Duvoisin RC. A large kindred with autosomal dominant Parkinson’s disease. Ann. Neurol. 1990;27:276–282. doi: 10.1002/ana.410270309. - DOI - PubMed
    1. Kruger R, et al. Ala30Pro mutation in the gene encoding alpha-synuclein in Parkinson’s disease. Nat. Genet. 1998;18:106–108. doi: 10.1038/ng0298-106. - DOI - PubMed
    1. Lesage S, et al. G51D alpha-synuclein mutation causes a novel parkinsonian-pyramidal syndrome. Ann. Neurol. 2013;73:459–471. doi: 10.1002/ana.23894. - DOI - PubMed