. 2024 Mar 29;15(1):2764.
doi: 10.1038/s41467-024-46994-2.

Identification of spatially-resolved markers of malignant transformation in Intraductal Papillary Mucinous Neoplasms

Affiliations

Identification of spatially-resolved markers of malignant transformation in Intraductal Papillary Mucinous Neoplasms

Antonio Agostini et al. Nat Commun. .

Abstract

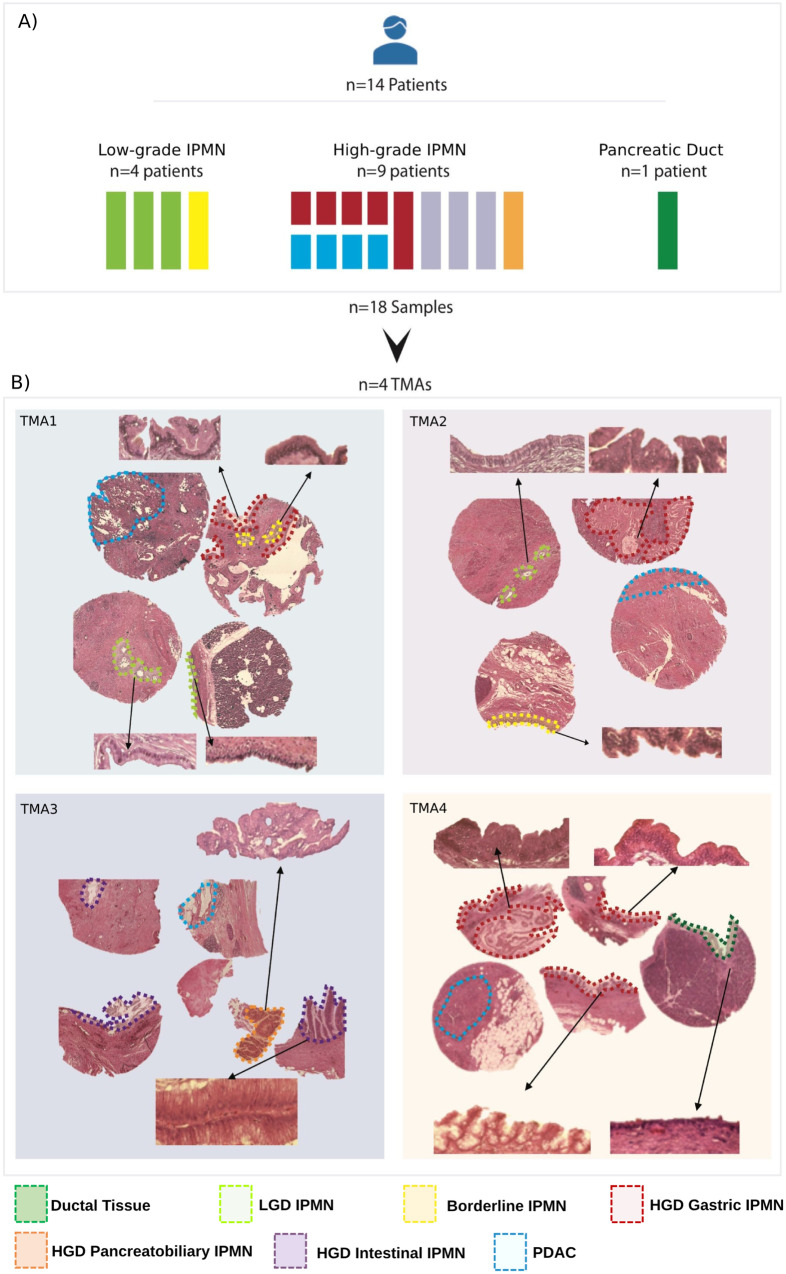
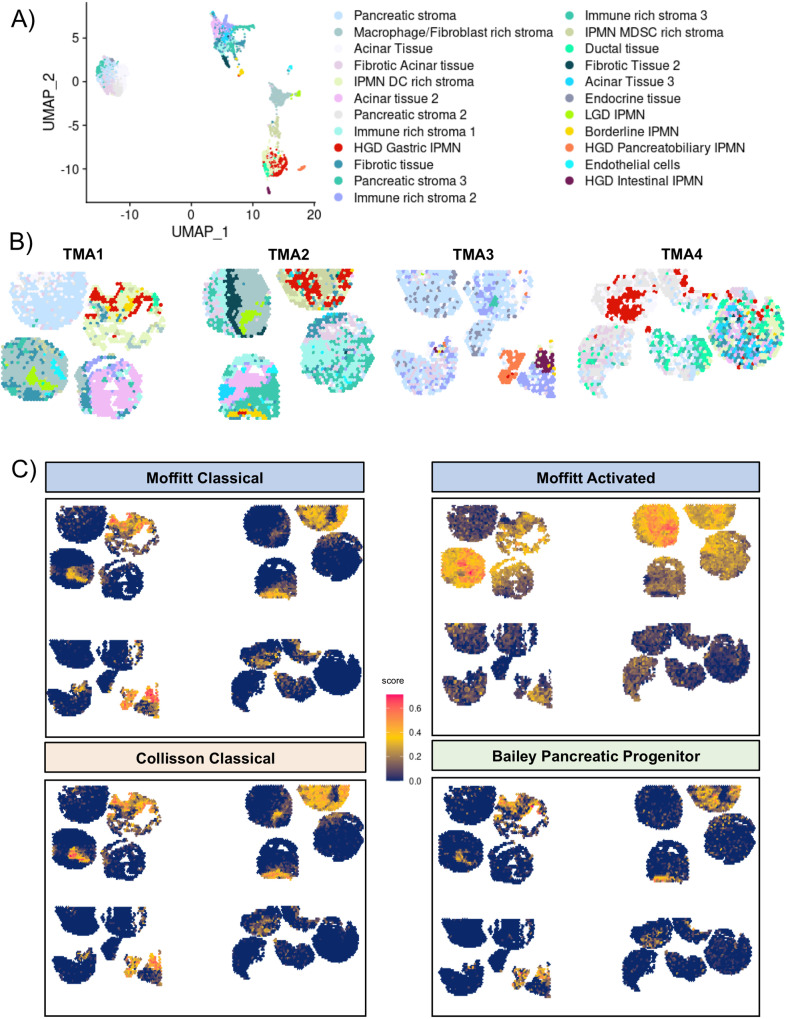
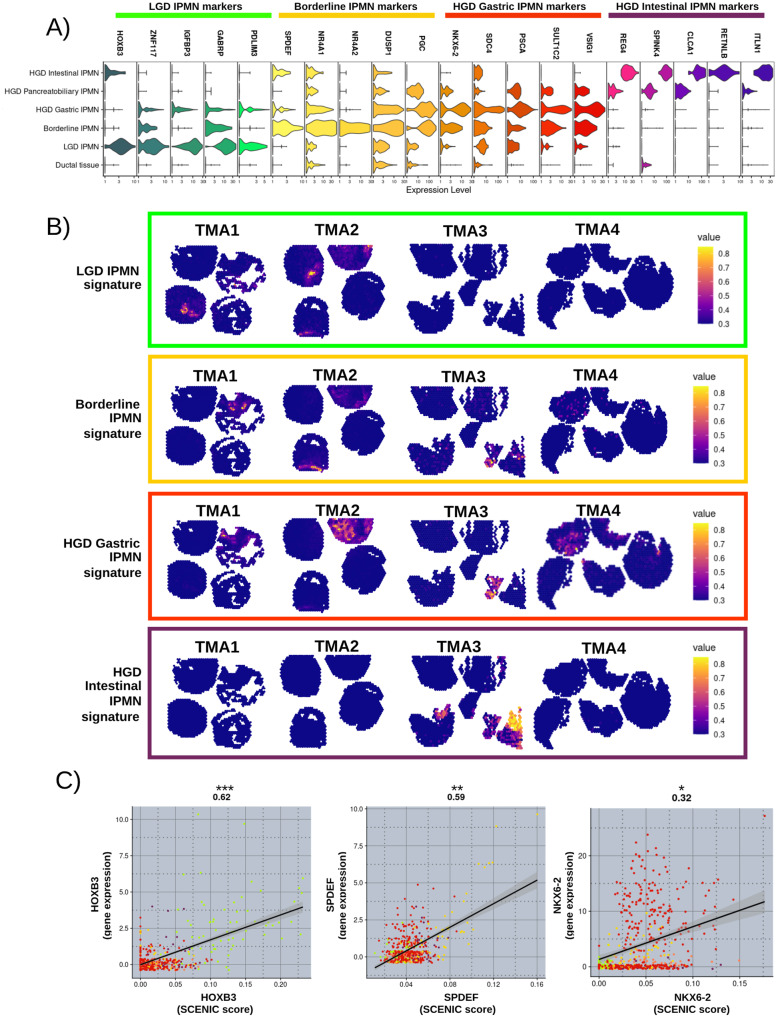
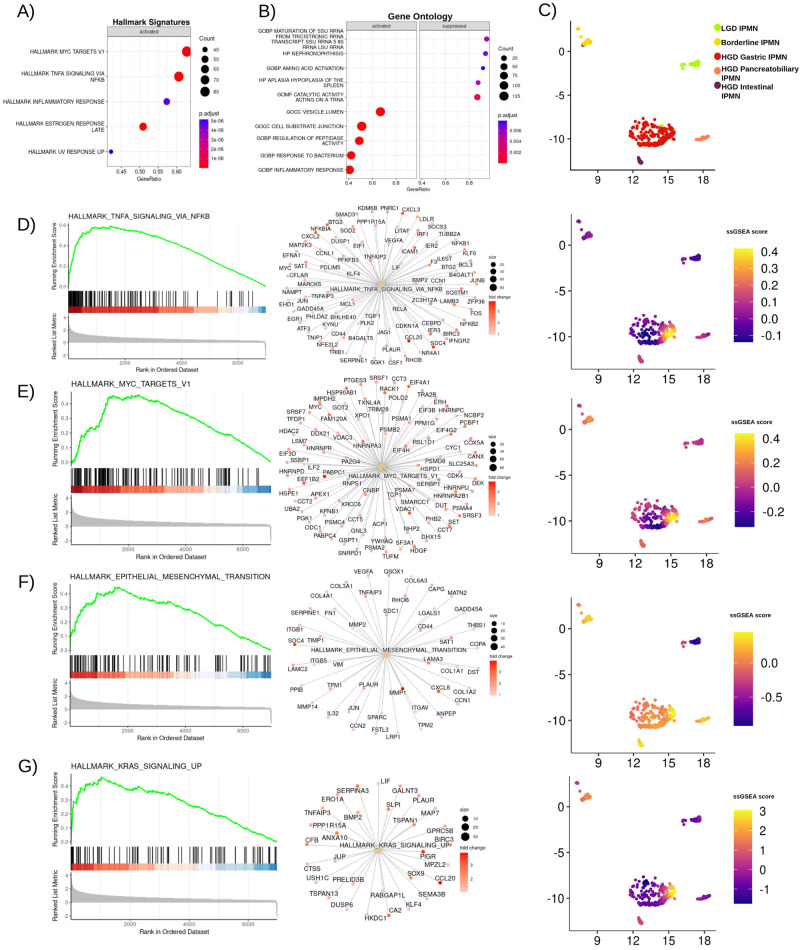
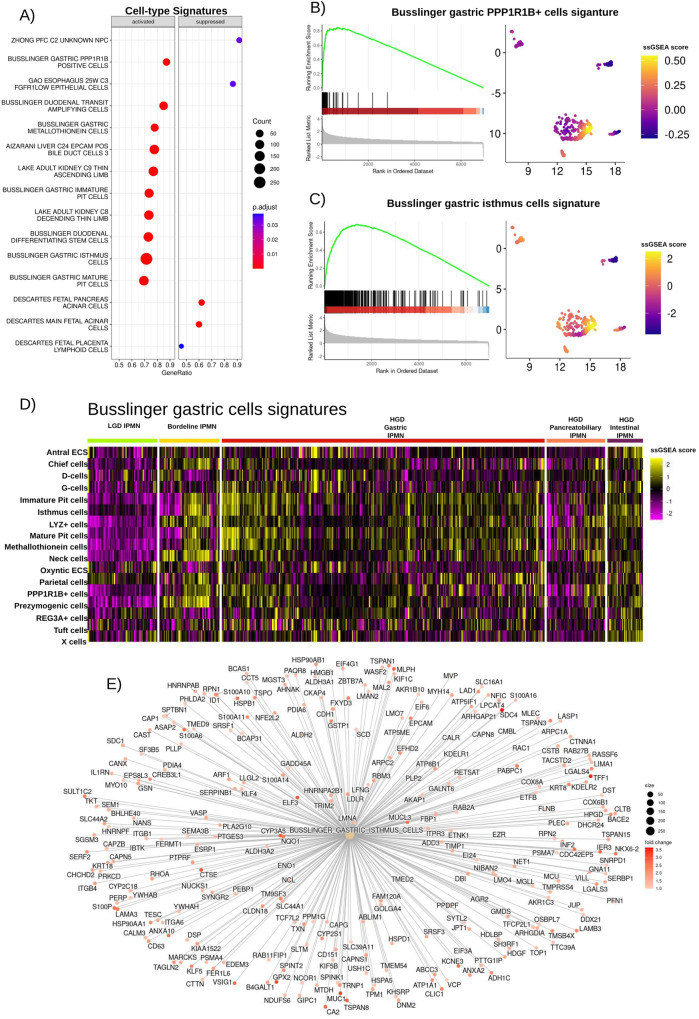
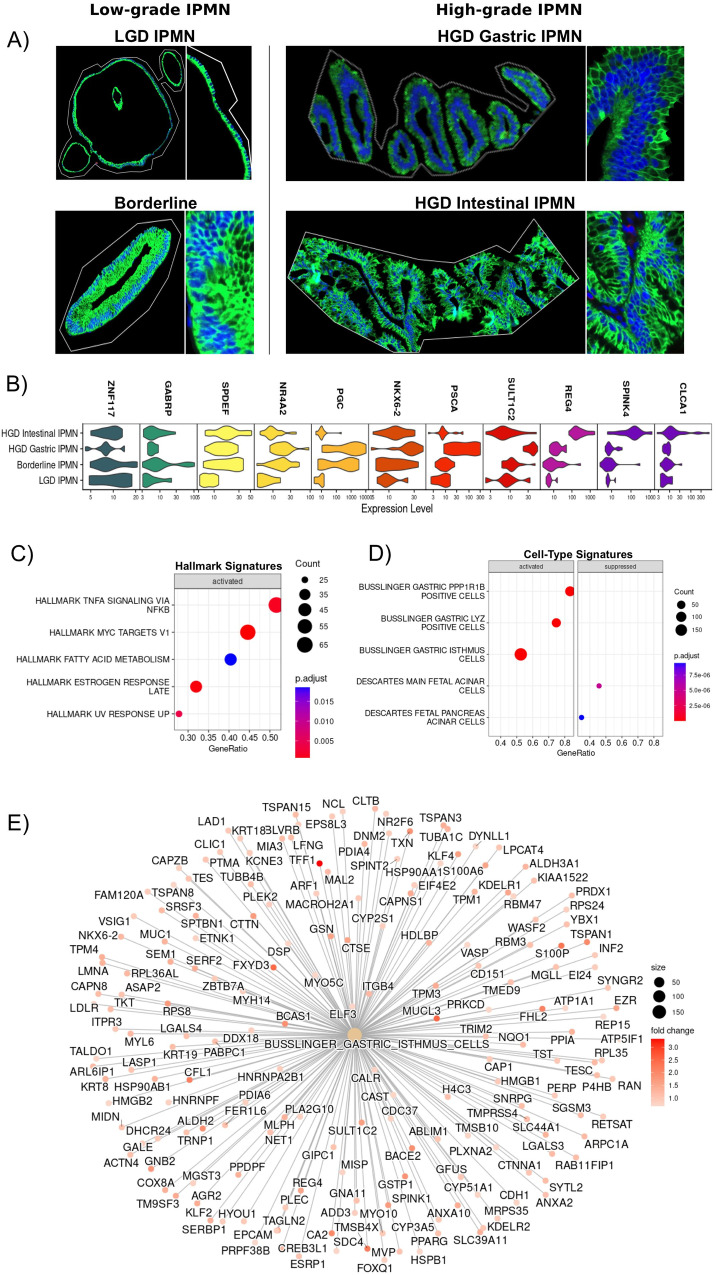
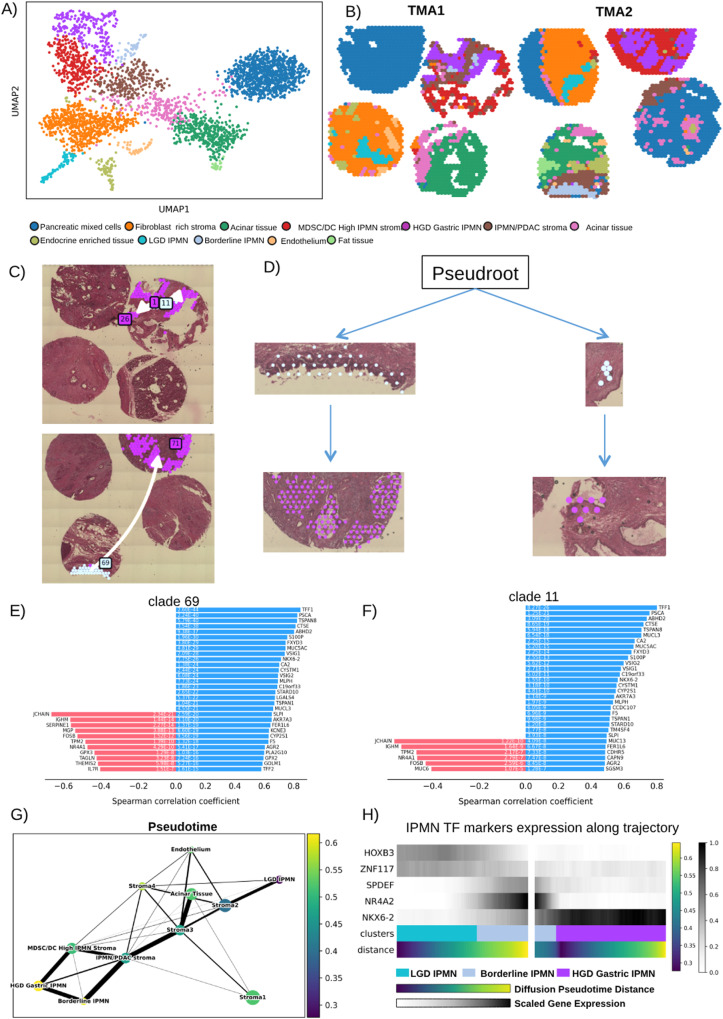
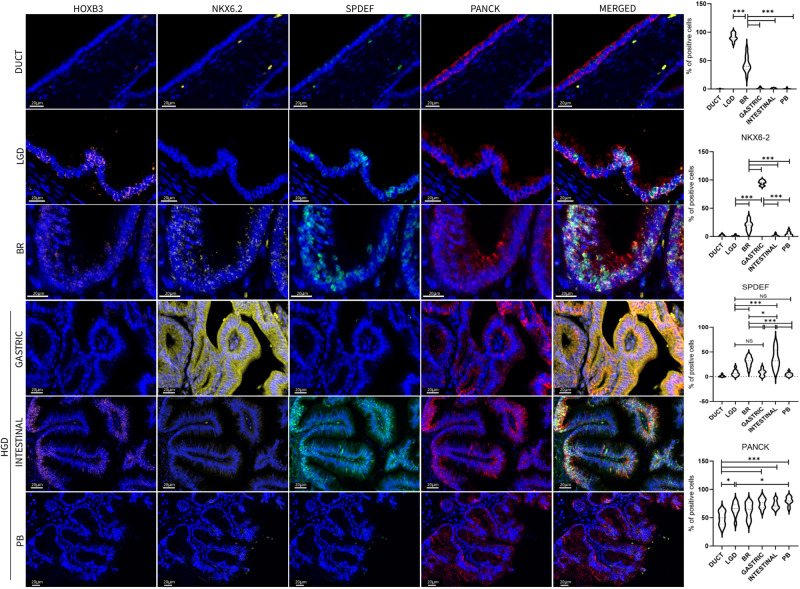
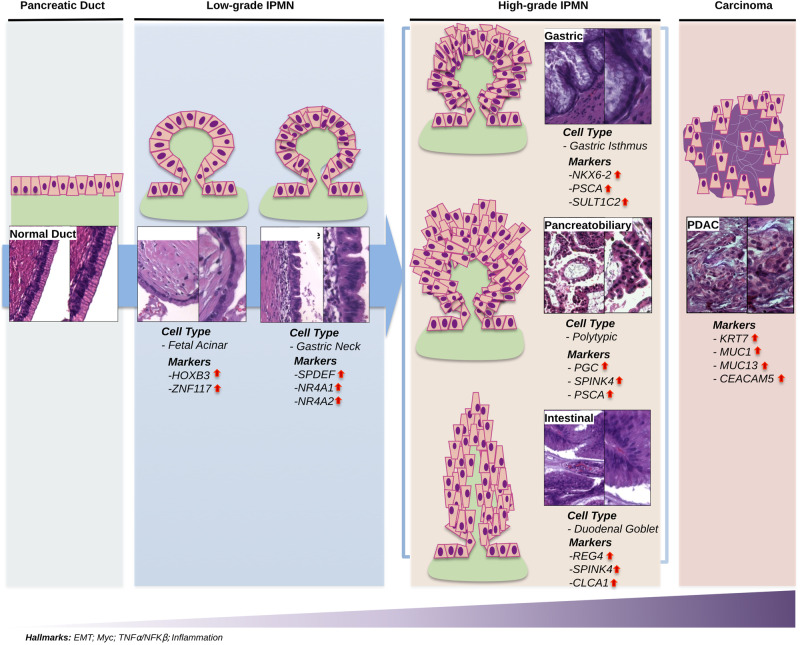
The existing Intraductal Papillary Mucinous Neoplasm (IPMN) risk stratification relies on clinical and histological factors, resulting in inaccuracies and leading to suboptimal treatment. This is due to the lack of appropriate molecular markers that can guide patients toward the best therapeutic options. Here, we assess and confirm subtype-specific markers for IPMN across two independent cohorts of patients using two Spatial Transcriptomics (ST) technologies. Specifically, we identify HOXB3 and ZNF117 as markers for Low-Grade Dysplasia, SPDEF and gastric neck cell markers in borderline cases, and NKX6-2 and gastric isthmus cell markers in High-Grade-Dysplasia Gastric IPMN, highlighting the role of TNFα and MYC activation in IPMN progression and the role of NKX6-2 in the specific Gastric IPMN progression. In conclusion, our work provides a step forward in understanding the gene expression landscapes of IPMN and the critical transcriptional networks related to PDAC progression.


Conflict of interest statement

The authors declare no competing interests.

Figures

Fig. 1
Fig. 1. Composition of discovery cohort.
A Schematic representation of the discovery cohort, which included 14 patients: 4 non-malignant IPMN, 9 HGD IPMN (including 4 patients with IPMN-associated PDAC) and 1 PDAC-associated normal duct. Non-malignant IPMN included three LGD and one Borderline (Br) IPMN. PDAC-associated HGD IPMN included Gastric (n = 5), Intestinal (n = 3), and Pancreatobiliary (n = 1) histological subtypes. In four of the five patients with gastric HGD IPMN and associated PDAC, both IPMN and PDAC lesions were used for the analysis. In total, a total of 18 samples from 14 patients were analyzed. B Hematoxylin and Eosin staining for the four TMAs included in the discovery cohort. 20X magnification of IPMN and Ductal Tissue are shown in the Figure inlays to show the morphology. Corresponding areas are highlighted according to the legend: Ductal Tissue (dark green), LGD IPMN (light green), Borderline IPMN (yellow), HGD Gastric IPMN (red), HGD Pancreatobiliary IPMN (orange), HGD Intestinal IPMN (violet), PDAC (blue). The picture was created with Biorender.com. TMA tissue micro array, LGD low-grade-dysplasia, HGD high-grade-dysplasia, PDAC pancreatic ductal adenocarcinoma.
Fig. 2
Fig. 2. Visium spatial features and clustering.
A UMAP plot showing the 23 clusters identified with Seurat, the clusters were annotated merging histology with ST markers. B Spatial visualization of the Seurat cluster alongside the 4 TMAs. Source data are provided as a Source Data file. C Spatial Visualization of gene module score for the main molecular signatures of PDAC: in clockwise order Moffitt Classical, Moffitt Stroma Activated, Bailey Pancreatic Progenitor, Collisson Classical. TMA tissue micro array, LGD low-grade-dysplasia, HGD high-grade-dysplasia, PDAC pancreatic ductal adenocarcinoma.
Fig. 3
Fig. 3. IPMN cluster marker signatures.
A Normalized expression of the top markers of each IPMN cluster identified by DE analysis. B Visualization of the IPMN clusters gene markers as signatures - LGD IPMN signature: HOXB3, ZNF117, IGFBP3, GABRP, PDLIM3; Borderline IPMN signature: SPDEF, NRA4A1, NR4A2, DUSP1, PGC; HGD Gastric IPMN signature: NKX6-2, PSCA, SULT1C2, VSIG1; HGD Intestinal IPMN: REG4, SPINK4, CLCA1, RETNLB, ITLN1. Color scales indicate the score for the gene set activity of each signature. C Correlation between transcription factor activity (SCENIC Score) and gene expression of HOXB3, SPDEF, and NKX6-2. Two-sided Pearson correlation value was showed on the top of each correlation plot with associated p-value (***<0.001; **<0.01; *<0.05). Smoothness: HOXB3 (95% CI = 0 0.56–0.67, df = 515, SE = 0.03); SPDEF (95% CI = 0.52–0.63, df = 515, SE = 0.03); NKX6-2 (95% CI = 0.23–0.39, df = 515, SE = 0.04). Each dot color refers to the annotation to the different IPMN clusters assigned (light green= LGD IPMN; yellow= Borderline IPMN; red= HGD Gastric IPMN; orange= HGD Pancreatobiliary IPMN; violet= HGD Intestinal IPMN). Source data are provided as a Source Data file. TMA tissue micro array, LGD low-grade-dysplasia, HGD high-grade-dysplasia, PDAC pancreatic ductal adenocarcinoma, CI confidence interval, df degrees of freedom, SE standard error.
Fig. 4
Fig. 4. GSEA results of comparison between HGD Gastric IPMN and LGD IPMN.
A Top five Hallmark Cancer pathways activated in HGD Gastric IPMN. The circle size represents the number of genes upregulated; Two-tailed GSEA corrected for multiple comparisons with FDR < 0.05; B Top five activated and suppressed gene ontology signatures activated or suppressed in HGD Gastric IPMN. The circle size represents the number of genes overexpressed or downregulated. C UMAP plot showing IPMN clusters in 2D - dimensions. D GSEA plot for HALLMARK_TNFA_SIGNALING_VIA_NFKB, network plot showing genes upregulated in HGD Gastric IPMN belonging to this signature. Featureplot showing ssGSEA score imputed for the same signature in all spots belonging to IPMN clusters. Fold changes are normalized to improve visualization. E GSEA plot, network plot, ssGSEA score plot for HALLMARK_MYC_TARGETS_V1. F GSEA plot, network plot, ssGSEA score plot for HALLMARK_EPITHELIAL_MESENCHYMAL_TRANSITION. G GSEA plot, network plot, ssGSEA score plot for HALLMARK_KRAS_SIGNALING_UP. Source data are provided as a Source Data file. TMA tissue micro array, LGD low-grade-dysplasia, HGD high-grade-dysplasia, FDR false discovery rate.
Fig. 5
Fig. 5. GSEA results showing cell type specific signatures associated with HGD gastric IPMN.
A Dotplot showing the top cell type specific signatures upregulated and suppressed in HGD Gastric IPMN when compared to LGD IPMN. Two-tailed GSEA corrected for multiple comparisons with FDR < 0.05. B GSEA plot for the BUSSLINGER_GASTRIC_PP1R1B_POSITIVE_CELLS signature. C GSEA plot for the BUSSLINGER_GASTRIC_ISTHMUS_CELLS signature. D A heatmap displaying ssGSEA scores for each of the gastric cell signatures identified by Busslinger and colleagues, calculated for all the spots associated with IPMN clusters. Source data are provided as a Source Data file. E Networkplot showing the overexpression of gene included in the Busslinger Gastric Isthmus cell signature in HGD Gastric IPMN in respect to LGD IPMN. TMA tissue micro array, LGD low-grade-dysplasia, HGD high-grade-dysplasia, FDR false discovery rate.
Fig. 6
Fig. 6. GeoMx ST analysis.
A The image shows an ROI selected for each type of IPMN. Inlays show 20X magnification. Nuclei were stained with Syto 13 (blue), while IPMN cells were stained with PanCK (green). The picture is representative of 57 ROI: 23 low-grade IPMN (6 LGD, 17 Borderline) and 34 high-grade IPMN (13 HGD Gastric IPMN, 21 HGD Intestinal IPMN); B Top markers identified with Seurat are consistent with the expression markers identified with Visium. C, D Dotplot showing Hallmark Cancer pathways and cell type signature upregulated in HGD Gastric IPMN when compared to LGD IPMN. Two-tailed GSEA corrected for multiple comparisons with FDR < 0.05; E Network plot confirming the expression of gastric isthmus cell signature in HGD Gastric IPMN in respect to LGD IPMN. Source data are provided as a Source Data file. TMA tissue micro array, LGD low-grade-dysplasia, HGD high-grade-dysplasia, FDR false discovery rate.
Fig. 7
Fig. 7. stLearn clustering and spatial trajectory of gastric IPMN.
A UMAP plot showing clustering identified by stLearn on TMA1 and TMA2. B Spatial visualization of stLearn clusters. C, D show the trajectories identified leading from Borderline IPMN local sub-clusters clade 69 and clade 11 (Angel blue) to HGD Gastric IPMN (Purple). Spearman Coefficient Correlation of transition markers identified to be associated with trajectory toward HGD Gastric IPMN of clade 69 (E) and clade 11 (F). G Diffusion showing the association between Pseudotime showing the evolution from LGD to HGD Gastric IPMN. H Heatmap showing the correlation with the expression of the transcription factors that we have identified to be markers of LGD IPMN (HOXB3, ZNF117), Borderline IPMN (SPDEF, NR4A2), HGD Gastric IPMN (NKX6-2). MDSC myeloid derived suppressor cell, DC dendritic cell, TMA tissue micro array, LGD low-grade-dysplasia, HGD high-grade-dysplasia.
Fig. 8
Fig. 8. Multiplex Immunofluorescence validation of the main markers identified by ST analysis.
Images shown are representative of 1 out of more than 10 fields acquired for each case and reviewed by pathologist. Scale bars of 20 μm are indicated in micrograph. Bar-plots show percentage of IPMN epithelial positive cells. Tukey’s multi comparisons test was used to compare the differences among IPMN types (Bonferroni adjusted p-value ***<0.001, **<0.01, NS = not significant, df = 54). Source data are provided as a Source Data file. TMA tissue micro array, LGD low-grade-dysplasia, BR borderline, HGD high-grade-dysplasia, PB Pancreatobiliary.
Fig. 9
Fig. 9. Visual summary of the main results.
The Figure shows the main upregulated gene markers and cell-type signatures in pancreatic normal duct, Low-grade IPMN (LGD IPMN, and borderline), High-grade IPMN (Gastric, Pancreatobiliary, Intestinal), and pancreatic ductal adenocarcinoma (PDAC), together with a representative immunohistochemistry capture of each condition. Epithelial-to-mesenchymal transition (EMT), Myc, TNFα/NFKβ and inflammation signaling pathways are consistently upregulated in this malignant degeneration path.

References

    1. Keane MG, Afghani E. A review of the diagnosis and management of premalignant pancreatic cystic lesions. J. Clin. Med. 2021;10:1284. doi: 10.3390/jcm10061284. - DOI - PMC - PubMed
    1. Patra KC, Bardeesy N, Mizukami Y. Diversity of precursor lesions for pancreatic cancer: the genetics and biology of intraductal papillary mucinous neoplasm. Clin. Transl. Gastroenterol. 2017;8:e86. doi: 10.1038/ctg.2017.3. - DOI - PMC - PubMed
    1. Hirono S, et al. Recurrence patterns after surgical resection of intraductal papillary mucinous neoplasm (IPMN) of the pancreas; a multicenter, retrospective study of 1074 IPMN patients by the Japan Pancreas Society. J. Gastroenterol. 2020;55:86–99. doi: 10.1007/s00535-019-01617-2. - DOI - PubMed
    1. Adsay NV, Conlon KC, Zee SY, Brennan MF, Klimstra DS. Intraductal papillary-mucinous neoplasms of the pancreas. Cancer. 2002;94:62–77. doi: 10.1002/cncr.10203. - DOI - PubMed
    1. Omori Y, et al. How does intestinal-type intraductal papillary mucinous neoplasm emerge? CDX2 plays a critical role in the process of intestinal differentiation and progression. Virchows Arch. 2020;477:21–31. doi: 10.1007/s00428-020-02806-8. - DOI - PubMed

MeSH terms