. 2024 Mar 29;9(1):67.
doi: 10.1038/s41541-024-00833-z.

Heterologous cAd3-Ebola and MVA-EbolaZ vaccines are safe and immunogenic in US and Uganda phase 1/1b trials

Collaborators, Affiliations

Heterologous cAd3-Ebola and MVA-EbolaZ vaccines are safe and immunogenic in US and Uganda phase 1/1b trials

Myra Happe et al. NPJ Vaccines. .

Abstract

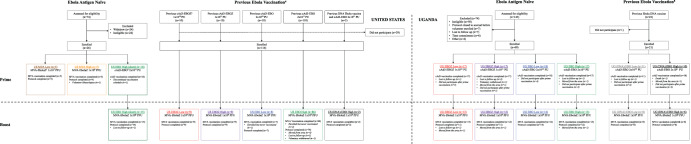
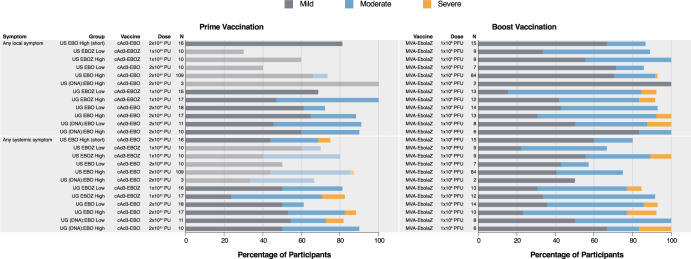
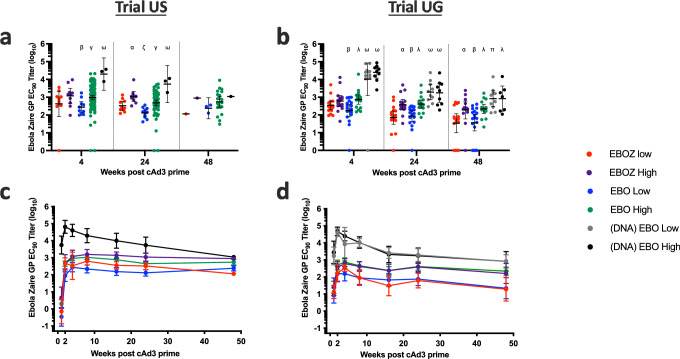
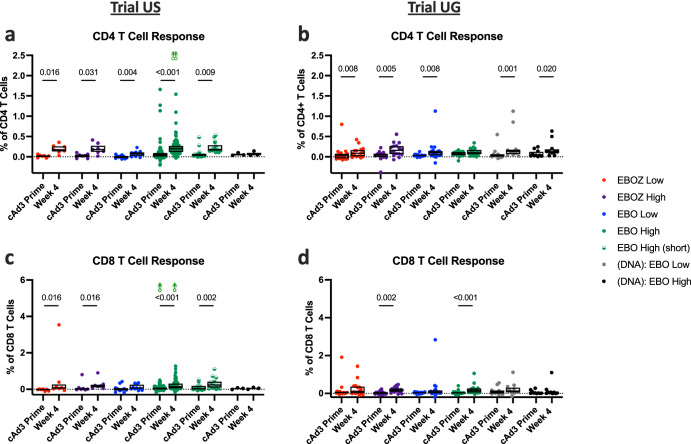
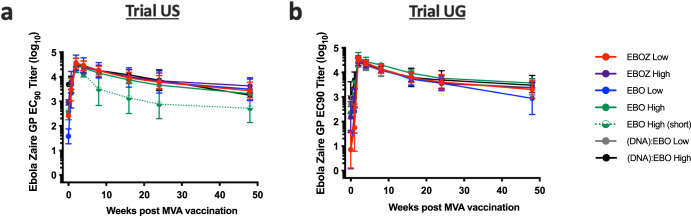
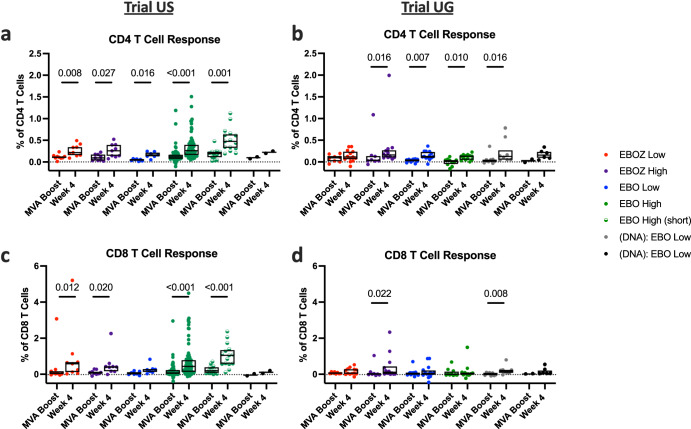
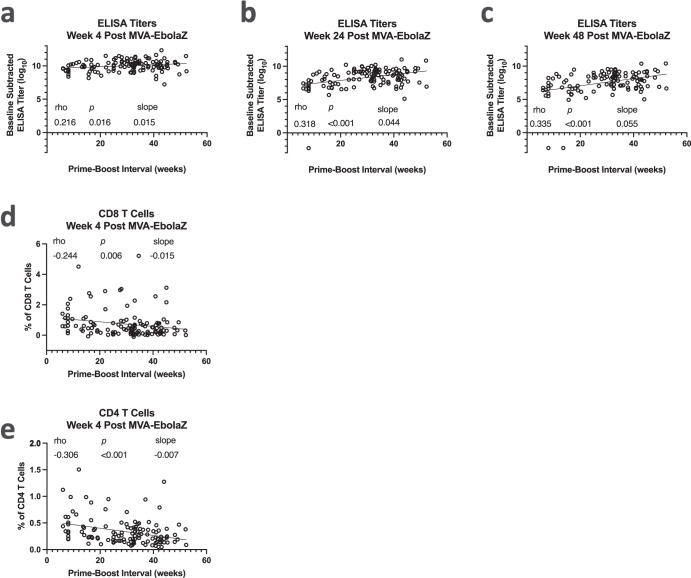
Ebola virus disease (EVD) is a filoviral infection caused by virus species of the Ebolavirus genus including Zaire ebolavirus (EBOV) and Sudan ebolavirus (SUDV). We investigated the safety and immunogenicity of a heterologous prime-boost regimen involving a chimpanzee adenovirus 3 vectored Ebola vaccine [either monovalent (cAd3-EBOZ) or bivalent (cAd3-EBO)] prime followed by a recombinant modified vaccinia virus Ankara EBOV vaccine (MVA-EbolaZ) boost in two phase 1/1b randomized open-label clinical trials in healthy adults in the United States (US) and Uganda (UG). Trial US (NCT02408913) enrolled 140 participants, including 26 EVD vaccine-naïve and 114 cAd3-Ebola-experienced participants (April-November 2015). Trial UG (NCT02354404) enrolled 90 participants, including 60 EVD vaccine-naïve and 30 DNA Ebola vaccine-experienced participants (February-April 2015). All tested vaccines and regimens were safe and well tolerated with no serious adverse events reported related to study products. Solicited local and systemic reactogenicity was mostly mild to moderate in severity. The heterologous prime-boost regimen was immunogenic, including induction of durable antibody responses which peaked as early as two weeks and persisted up to one year after each vaccination. Different prime-boost intervals impacted the magnitude of humoral and cellular immune responses. The results from these studies demonstrate promising implications for use of these vaccines in both prophylactic and outbreak settings.


Conflict of interest statement

N.J.S. is listed on patents involving cAd3-vectored vaccines. N.R. is a paid consultant for ICON and EMMES as a safety consultant for clinical trials, and serves on the advisory boards for GSK, Sanofi, Seqirus and Moderna. Emory receives funds for N.R. to conduct research from Sanofi, Lilly, Merck, Quidel and Pfizer. M.J.M. reported potential competing interests: laboratory research and clinical trials contract funding for vaccines or MAB with Lilly, Pfizer, and Sanofi; personal fees for Scientific Advisory Board service from Merck, Meissa Vaccines, Inc. and Pfizer. All other authors declare no competing interests.

Figures

Fig. 1
Fig. 1. Consort diagram.
1MVA-EbolaZ (MVA): recombinant modified vaccinia virus Ankara Zaire ebolavirus (EBOV) vaccine2; cAd3-EBO: bivalent Zaire ebolavirus (EBOV) and Sudan ebolavirus (SUDV) chimpanzee adenovirus 3 (cAd3) vectored vaccine3, cAd3-EBOZ: monovalent Zaire ebolavirus (EBOV) chimpanzee adenovirus 3 (cAd3) vectored vaccine4; Previous Ebolavirus Vaccination: study participants previously participated in NCT022318665; Previous Ebolavirus Vaccination: study participants previously participated in NCT00997607.
Fig. 2
Fig. 2. Solicited reactogenicity.
Percent of participants (x axis) reporting solicited local or systemic symptoms by vaccine group (y axis) in the seven days following each vaccination. For symptoms persisting more than one day, a single count per person at the maximum severity of the symptom was used for the figure. Saturated bars are from the herein reported trials, faded bars are results from a previous trial (NCT02231866) and have been partially reported,. Detailed reactogenicity data is presented in Supplementary Fig. 1 (Trial US) and 2 (Trial UG).
Fig. 3
Fig. 3. Antibody responses to the cAd3-Ebola vaccines followed similar dose-dependence and kinetics in the Trial US and Trial UG participants.
Baseline-subtracted antibody titers following cAd3-EBOZ or cAd3-EBO vaccination in the US and UG trial participants as assessed by Ebola Zaire GP ELISA. Data expressed as EC90 titers. In (a, b) titers from weeks 4, 24 and 48 post-cAd3 Ebola vaccination are shown as dot plots overlaid with a line at the geometric mean titer (GMT). Titers were compared between groups from the same country and at the same time using Wilcoxon rank-sum test. Statistical significance is noted as follows: α: significant difference from EBOZ Low, β: Significant difference from EBOZ High, γ: Significant difference from EBO Low, λ: Significant difference from all Low, ζ: Significant difference from all EBOZ, π: significant difference from all Low and EBO High, ω: Significant difference from all non-DNA-primed. The n participants for each comparison and the p values are listed in Supplementary Tables 6 and 7. Results from (a, c) are from a previous clinical trial (NCT02231866), and the results have been partially reported,. Low n participants in (a) at week 48 are due to recruitment of participants into the subsequent Trial US to receive MVA vaccine (NCT02408913). In (c, d), durability of the vaccine-induced antibody titers are expressed as GMTs. Throughout figure, error bars indicate 95% CIs.
Fig. 4
Fig. 4. cAd3-Ebola vaccination increased the proportion of CD4+ and CD8 + T cells responding to Zaire epitopes by week 4.
Percentage of memory background-subtracted CD4 (a, b) and CD8 (c, d) T cells responding to ex vivo stimulation with production of any tested cytokine at baseline and four weeks post cAd3-Ebola vaccination in Trial US (a, c) and Trial UG (b, d) participants. Box plots denote median with upper and lower quartiles of each group. Dotted line indicates background cytokine production in the absence of stimulation. Each ⥉ in (a, c) indicates a single data point greater than the extent of the y axis : one participant displayed high baseline frequencies between 20 and 25% of GP-reactive memory CD4 and CD8 T cells, that diminished to less than 1% after vaccination; four weeks after vaccination, GP reactivity reached 2.7% of memory CD4 T cells in one individual and 6.9% of memory CD8 T cells in a separate individual. For each group, titers were compared between baseline and week 4 using the Wilcoxon rank-sum test, and statistical significance is reported above each group for which p < 0.05. Results from (a, c) are from a previous clinical trial (NCT02231866), and the results have been partially reported,.
Fig. 5
Fig. 5. MVA-EbolaZ boosted EBOZ GP-specific antibody titers in participants with previous cAd3-Ebola vaccine exposure to similar magnitudes in Trial US and Trial UG.
Baseline (pre-cAd3)-subtracted antibody titers (y axis) in the weeks (x axis) following MVA-EbolaZ vaccination in the US (a) and UG (b) participants as assessed by Ebola Zaire GP ELISA. Data expressed as EC90 titers with 95% confidence intervals (CIs) indicated by error bars. The EBO High (short) group is the Trial US group with a prime-boost interval of 6–11 weeks.
Fig. 6
Fig. 6. MVA-EbolaZ boost increased proportion of CD4+ and CD8 + T cells responding to Zaire epitopes by week 4.
Percentage of memory background-subtracted CD4 (a, b) and CD8 (c, d) T cells responding to ex vivo stimulation with production of any tested cytokine at baseline and four weeks post-MVA vaccination in US (a, c) and UG (b, d) participants. Box plots denote median with upper and lower quartiles of each group. Dotted line indicates background cytokine production in the absence of stimulation. For each group, titers were compared between baseline and week 4 using the Wilcoxon rank-sum test, and statistical significance is reported above each group for which p < 0.05.
Fig. 7
Fig. 7. Memory T cell and antibody responses are differentially dependent on the prime-boost interval in Trial US.
Log10 transformed EC90 titers (ac) or percent of memory T cells responding to stimulation with any tested cytokine production (d, e) of samples from US participants (y axis) are plotted against the interval in weeks between the participant’s cAd3-Ebola prime and MVA-EbolaZ boost vaccinations (x axis). Spearman correlations p, and rho are included for each comparison. A simple linear regression line and its slope is included for reference. For antibody titers, correlations were performed comparing the prime-boost interval against week four (a), 24, (b) and 48 (c) EBOZ GP-specific antibody titers after the boost, whereas for T cells the comparison used CD4 (d) and CD8 (e) T cell percentages from week 4 only.

References

    1. World Health Organization. WHO to identify pathogens that could cause future outbreaks and pandemics. Last Update November 21, 2022. https://www.who.int/news/item/21-11-2022-who-to-identify-pathogens-that-... (accessed 02/13/2023).
    1. World Health Organization. Ebola Virus Disease. February 23, 2021. https://www.who.int/en/news-room/fact-sheets/detail/ebola-virus-disease (accessed 08/24/2021).
    1. Yamaoka, S. & Ebihara, H. Pathogenicity and virulence of ebolaviruses with species- and variant-specificity. Virulence12, 885–901 (2021). - PMC - PubMed
    1. Centers for Disease Control and Prevention. Ebola Disease Distribution Map: Cases of Ebola Disease in Africa Since 1976. March 24, 2023. https://www.cdc.gov/vhf/ebola/history/distribution-map.html (accessed 02/21/2023).
    1. Pigott, D. M. et al. Mapping the zoonotic niche of Ebola virus disease in Africa. Elife3, e04395 (2014). - PMC - PubMed