. 2024 Mar 29;14(1):7521.
doi: 10.1038/s41598-024-58229-x.

Use of nonlinear pulsed magnetic fields for spatial encoding in magnetic resonance imaging

Affiliations

Use of nonlinear pulsed magnetic fields for spatial encoding in magnetic resonance imaging

Kaja Tušar et al. Sci Rep. .

Abstract

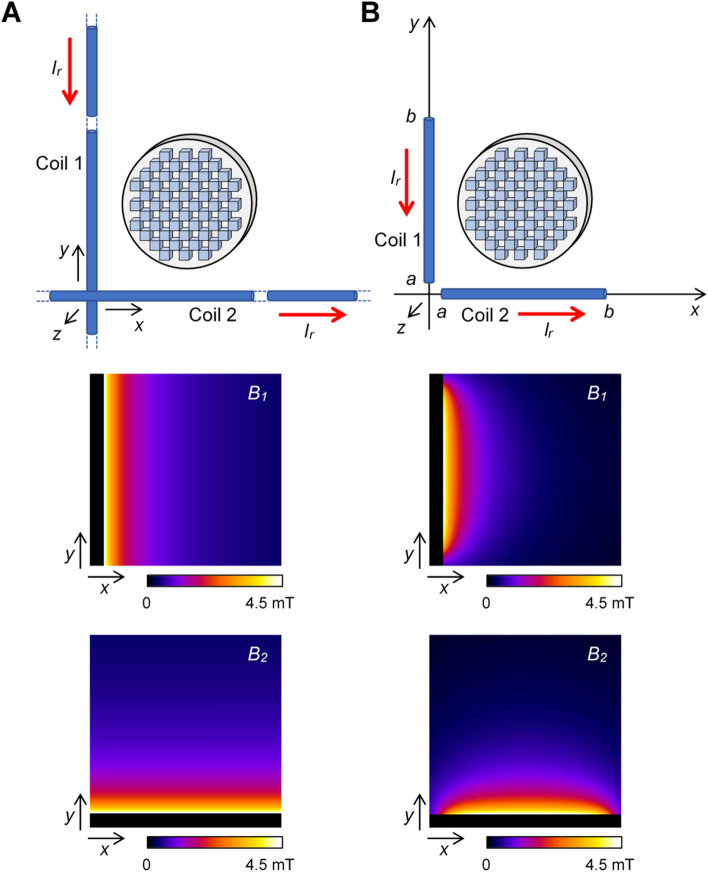
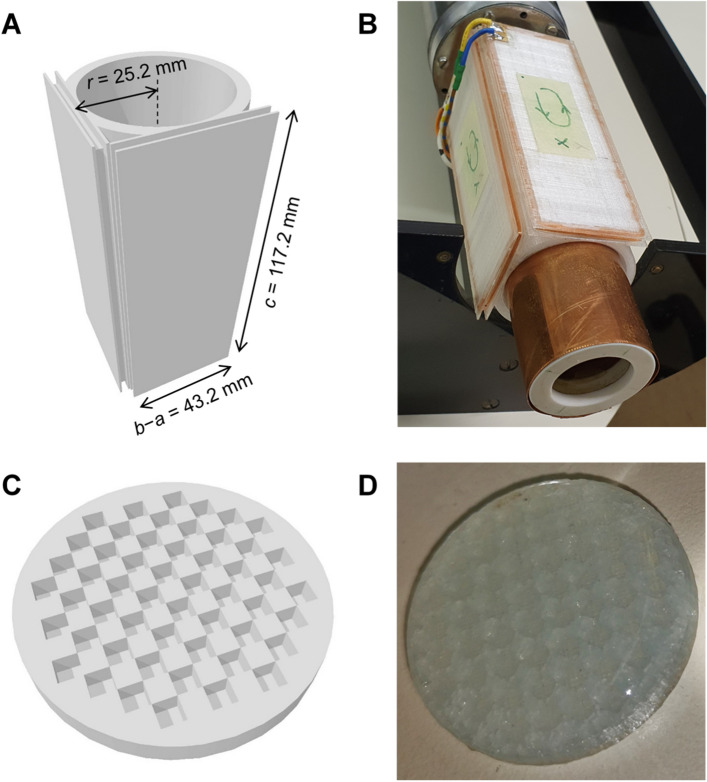
This study examines the use of nonlinear magnetic field coils for spatial encoding in magnetic resonance imaging. Existing theories on imaging with such coils share a complex reconstruction process that originates from a suboptimal signal interpretation in the spatial-frequency domain (k-space). In this study, a new solution to this problem is proposed, namely a two-step reconstruction process, in which in the first step, the image signal is converted into a frequency spectrum, and in the second step, the spectrum, which represents the distorted image, is geometrically and intensity corrected to obtain an undistorted image. This theory has been verified by numerical simulations and experimentally using a straight wire as a coil model for an extremely nonlinear magnetic field. The results of this study facilitate the use of simple encoding coil designs that can feature low inductance, allowing for much faster switching times and higher magnetic field gradients.


Conflict of interest statement

The authors declare no competing interests.

Figures

Figure 1
Figure 1
Spin-echo imaging pulse sequence. This pulse sequence was used to test the feasibility of imaging with nonlinear magnetic field coils.
Figure 2
Figure 2
Simulation of imaging with nonlinear magnetic field coils. (A) characters “ab” and (B) checkerboard (a) object was used to simulate (b) the expected 2D spectrum, which was then used to reconstruct (c) the image. This process was repeated with (d) the noised spectrum, yielding (e) the noised reconstructed image. This simulation was performed using an infinite wire model for coils with a nonlinear magnetic field.
Figure 3
Figure 3
Reconstructed images and spectra from test sample measurements. (A) The measured spectrum and (B) the reference image of the test sample were used to reconstruct the corresponding (a) images and (d) spectra using the infinite wire model at (C) Ir = 45 A and (D) Ir = 70 A and the finite wire model at (E) Ir = 80 A, a = 3.6 mm and b = 46.8 mm. Magnified (b) low- and (d) high-resolution images of selected regions of interest (ROIs).
Figure 4
Figure 4
Measured and reconstructed images and spectra of a carrot root. A 5 mm thick slice across a carrot root was imaged with nonlinear magnetic field coils to obtain (A) the measured raw (time-domain) data (B) the measured spectrum from which (C) the corresponding image was reconstructed. The measurement was repeated with conventional gradient coils to obtain (D) the reference image and calculate (E) the corresponding spectrum. This was then used to simulate (F) the reconstructed image.
Figure 5
Figure 5
Models of nonlinear magnetic field coils and their corresponding simulated magnetic field maps B1=ω1/γ and B2=ω2/γ. The feasibility of imaging with nonlinear magnetic field coils was tested with (A) infinite and (B) finite straight wire models. The magnetic fields were calculated using Eqs. (12, 15) for parameters Ir = 80 A, a = 3.6 mm and b = 46.8 mm. They are shown in a region of 50 × 50 mm2 with the origin at x = 0 and y = 0.
Figure 6
Figure 6
Nonlinear magnetic field coils and the test sample. (A) Model of the frame for nonlinear magnetic field coils and (B) the finished coils, each made of 50 turns of enameled copper wire wound on the 3D printed plastic frame. The coils in the image are already installed in the NMR probe holder with the RF probe being in the middle. (C) Model for the test sample in a form of a disc with 2 × 2 × 2 mm3 cubic pores arranged in a checkerboard pattern and (D) the test sample before installation in the RF probe with pores filled with 2% agar gel.

Similar articles

References

    1. Stejskal EO, Tanner JE. Spin diffusion measurements: Spin echoes in the presence of a time-dependent field gradient. J. Chem. Phys. 1965;42:288–292. doi: 10.1063/1.1695690. - DOI
    1. Tanner JE. Use of stimulated echo in nmr-diffusion studies. J. Chem. Phys. 1970;52:2523–2526. doi: 10.1063/1.1673336. - DOI
    1. Zupančič I. Current shims for high-resolution nuclear magnetic resonance on the problem of correcting magnetic field inhomogeneities. J. Sci. Instrum. 1962;39:621–624. doi: 10.1088/0950-7671/39/12/331. - DOI
    1. Lauterbur PC. Image formation by induced local interactions: Examples of employing nuclear magnetic resonance. Nature. 1973;242:190–191. doi: 10.1038/242190a0. - DOI - PubMed
    1. Cormack AM. 75 years of radon-transform. J. Comput. Assist. Tomo. 1992;16:673–673. doi: 10.1097/00004728-199209000-00001. - DOI - PubMed