. 2024 Jul;16(7):1113-1124.
doi: 10.1038/s41557-024-01489-x. Epub 2024 Mar 29.

Expanding the molecular language of protein liquid-liquid phase separation

Affiliations

Expanding the molecular language of protein liquid-liquid phase separation

Shiv Rekhi et al. Nat Chem. 2024 Jul.

Abstract

Understanding the relationship between a polypeptide sequence and its phase separation has important implications for analysing cellular function, treating disease and designing novel biomaterials. Several sequence features have been identified as drivers for protein liquid-liquid phase separation (LLPS), schematized as a 'molecular grammar' for LLPS. Here we further probe how sequence modulates phase separation and the material properties of the resulting condensates, targeting sequence features previously overlooked in the literature. We generate sequence variants of a repeat polypeptide with either no charged residues, high net charge, no glycine residues or devoid of aromatic or arginine residues. All but one of 12 variants exhibited LLPS, albeit to different extents, despite substantial differences in composition. Furthermore, we find that all the condensates formed behaved like viscous fluids, despite large differences in their viscosities. Our results support the model of multiple interactions between diverse residue pairs-not just a handful of residues-working in tandem to drive the phase separation and dynamics of condensates.


Conflict of interest statement

Competing Interests

The authors declare no competing interests.

Figures

Extended Data Fig. 1
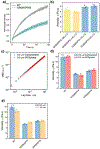
Extended Data Fig. 1. Salt dependence of polycation LLPS.
(a)Turbidity curves for the polycationic GRGNSPYS variant at three salt concentrations (50, 137, and 300 mM NaCl). Three independent experiments are shown at each concentration. (b) Transition temperatures estimated from the turbidity curves as shown in (a). Data are presented as mean values +/−SD, n = 3 independent experiments.
Extended Data Fig. 2
Extended Data Fig. 2. Pairwise contacts of R-to-Q and D-to-N variants.
Average residue pairwise contacts for the (a) GRGNSPYS and (b) GQGDSPYS variants with respect to WT. Residue pairs not involving mutated residues are shown as dark gray circles while residue pairs involving the mutated residues are shown as red squares (D-to-N) or orange diamonds (R-to-Q).
Extended Data Fig. 3
Extended Data Fig. 3. Turbidity and partial phase diagram of GRGASPYA.
Turbidity (a) and partial phase diagram (b) of GRGASPYA at different concentrations of protein in PBS. Data are presented as mean values +/− SD, n = 3 independent experiments.
Extended Data Fig. 4
Extended Data Fig. 4. Pairwise contacts of aromatic substitutions in the polycation.
Average residue pairwise contacts for the (a) GRGNSPFS and (b) GRGNSPWS variants with respect to GRGNSPYS. Upper plots: Residue pairs not involving mutated residues are shown as dark gray circles while residue pairs involving the mutated residues are shown as purple triangles. Lower plots: Contact ratio between residue pairs for the GRGNSPFS and GRGNSPWS variants to that of the GRGNSPYS variant.
Extended Data Fig. 5
Extended Data Fig. 5. Material properties of A-IDP condensates.
(a) FRAP of WT and GRGNSPWS with RGG-GFP-RGG as a fluorescent tracer. Data are presented as mean values +/− SD, n = 4 (WT), n = 9 (GRGNSPWS) different condensates from one experiment. (b) Effect of total protein concentration on condensate viscosity, as measured by microrheology. Measurements were conducted for GRGNSPFS and GQGNSPYS, at two concentrations each. Data are presented as mean values +/− SD, n = 4 videos from one experiment. (c) MSDs measured in polycationic GRGNSPYS condensates using PEGylated and carboxylated beads. (d) Viscosity of GRGDSPYS (WT), GQGNSPYS, and GRGNSPYS determined by particle tracking microrheology of 0.5 μm PEGylated vs. carboxylated beads. Two factor with replication ANOVA confirmed difference in viscosities between 0.5 μm PEGylated and carboxylated beads is not statistically significant, with p-value of 0.753. Data are presented as mean values +/− SD, n = 4 videos from one experiment. (e) Viscosity of GRGDSPYS (WT), GQGNSPYS, and GRGNSPYS determined by particle tracking microrheology of 0.5 μm vs. 1 μm bead diameters. Two factor with replication ANOVA confirmed difference in viscosities between 0.5 μm and 1 μm beads is not statistically significant, with p-value of 0.268. Data are presented as mean values +/− SD, n = 4 videos from one experiment.
Extended Data Fig. 6
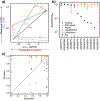
Extended Data Fig. 6. Sequence based predictors of LLPS.
(a) Solvation free energy from Wolfenden et al.1 vs. saturation concentrations measured in this work. Each data point represents a unique variant used in this work. Variants differing by only one residue are connected by lines such that each mutation results in increasing saturation concentration. Dashed lines indicate variants that follow the trend of preferred interaction with solvent leading to lower phase separation propensity, while solid lines show mutations that result in less favorable interaction with solvent and lower phase separation propensity. (b) Ratio of phase separation propensity score for each sequence relative to the propensity score for WT, calculated using several online sequence-based predictors – DeePhase, PScore, PSpredictor, FuzDrop, LLPhysScore and catgranule. Experimental values are shown as black circles. All predictor values are normalized with the WT to account for different scales used by the predictors. In all cases, when the normalized score is above 1, the sequence is predicted to undergo LLPS more avidly than the WT, while values below 1 indicate a lower propensity to undergo LLPS when compared to WT. Experimental values are calculated from the saturation concentration values (Csat) measured at 37 °C. The experimental values are represented as Csat of WT divided by Csat of variant, such that here too, a value above 1 indicates greater phase separation propensity compared to WT, whereas a value below 1 indicates lower phase separation propensity. (c) Correlation between experimental values and predictor results. Data for all data sets are normalized from 0 to 1. Symbols are the same as shown in (b) for the predictors.
Extended Data Fig. 7
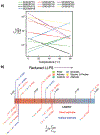
Extended Data Fig. 7. Temperature dependence of saturation concentrations for A-IDP variants.
(a) Ratio of saturation concentrations (Csat) for different sequences with respect to Csat of WT at different temperatures. Lines sloping down indicate that phase separation propensity with respect to the WT is enhanced at higher temperatures, whereas lines sloping upwards indicate reduction in phase separation propensity with respect to WT at higher temperatures. Solid lines indicate the temperatures at which saturation concentration was estimated using turbidimetry experiments, while dashed lines indicate the temperatures at which values were extrapolated from a logarithmic fit to the experimental binodal data. (b) Thermodynamic analysis performed for the different variants based on the estimated saturation concentrations at 20 °C. Higher values indicate greater reduction in phase separation propensity upon carrying out the mutation. Direct estimate refers to values that can be calculated from the experimental variants directly, whereas indirect estimate refers to values for which the mutation was not carried out in this work and the values were inferred based on data from multiple related experimental variants.
Extended Data Fig. 8
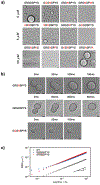
Extended Data Fig. 8. Droplet morphology and dynamics after 24 hrs.
(a)Microscopy images for different mutants after 24 hrs of phase separation, showing regular spherical droplets and no signs of fibrillization or aggregation. (Scale bar: 5 μm). Data presented is representative of multiple images acquired for each sample and validated through imaging a second independent sample for 7 out of 12 variants. (b) Microscopy images of GRGNSPYS (cationic sequence), GRGDSPYS (WT) and GQGNSPYS (neutral sequence) undergoing droplet fusion and relaxing into a single spherical droplet, showing liquid-like behavior at 24 hrs. (Scale bar: 2 μm). Data presented is representative of results from two independent trials. Representative WT snapshots from Supplementary Movie 2. (c) Ensemble mean-squared displacement versus lag time at 24 hrs for the three representative variants (GRGNSPYS, GRGDSPYS, and GQGNSPYS), showing liquid-like behavior even after 24 hrs of phase separation.
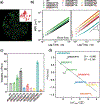
Fig. 1
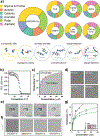
Fig. 1. A diverse range of interactions between residue pairs contributes to phase separation of WT, (GRGDSPYS)25.
(a) Pie charts comparing the composition of the WT polypeptide to naturally occurring sequences. The composition is segregated into Polar; Aromatic; Anionic; Glycine and Proline; Cationic; and Aliphatic residues. Below the pie charts are cartoons highlighting the different residue pair interactions present in WT. (b) Example turbidimetry experiments on WT to estimate transition temperatures; shown here are triplicate turbidity assays at WT concentration 6 μM. (c) Partial phase diagram of WT obtained through turbidimetry at different WT concentrations in PBS. The dashed line is obtained through a logarithmic fit to the transition temperatures at each polypeptide concentration. Data are presented as mean values +/− SD, n=3 independent experiments. (d) Representative microscopy images of WT at 6 μM concentration at time points 10, 20, 30, and 60 minutes after inducing phase separation (Scale bar, 5 μm). The data presented are representative of multiple images acquired. (e) Images of WT droplets undergoing coalescence over a 100 ms time window (Scale bar, 5 μm). Similar results were obtained from at least two independent analyses (f) Microscopy images of WT, ARADSPYS, SRSDSPYS, and GRGDVPYS variants at 6 μM concentration (Scale bar, 5 μm). (g) Partial phase diagram of WT, ARADSPYS, SRSDSPYS, and GRGDVPYS variants in PBS obtained through turbidimetry at different concentrations. Dashed lines are obtained through a logarithmic fit to the measured transition temperatures at each concentration from turbidity experiments. Data are presented as mean values +/− SD, n=3 independent experiments.
Fig. 2
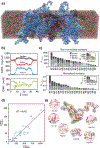
Fig. 2. Atomistic simulations of the WT sequence highlight the diverse interactions encoded within the sequence.
(a) Representative snapshot of the atomistic simulation of the condensed phase of WT. Proteins are shown as a semitransparent surface with bonds and atoms shown explicitly in blue; water in red; and Na+ and Cl ions in green and yellow, respectively. (b) Estimated densities of system (protein, water, and ions combined), and of water, protein, sodium ions, and chloride ions from atomistic simulations of the WT condensed phase, consisting of 30 protein chains in the slab geometry. (c) Average residue pair contacts estimated from atomistic simulations of the WT condensed phase, separated into backbone-backbone (bb-bb), backbone-sidechain (bb-sc) and sidechain-sidechain (sc-sc). The inset shows the average contacts formed by each residue during the simulation. The bottom panel shows the average pairwise contacts formed by the residues when normalized by their abundance within the WT sequence, and the inset shows the individual residue contacts with the same normalization applied. (d) Comparison between residue pairwise contacts observed in a atomistic single-chain simulation of a fragment of the WT (6 repeat units), labeled as Ncontactdilute and the condensed phase, labeled Ncontactdense. Coefficient of determination is shown as a measure of correlation. (e) Snapshot of a representative configuration of the chain in the atomistic single chain simulation. Frequently observed residue pairwise contacts within the simulation are shown surrounding the chain.
Fig. 3
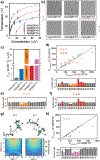
Fig. 3. Presence of arginine promotes but is not required for phase separation.
(a) Partial phase diagrams for WT (GRGDSPYS), GQGNSPYS, GRGNSPYS, and GKGNSPYS in PBS. GQGDSPYS shows no measurable transition even up to a concentration of 80 μM and is thus omitted from the plot. Dashed lines are obtained through a logarithmic fit to the measured transition temperatures from turbidity experiments at different polypeptide concentrations. Data are presented as mean values +/− SD, n=3 independent experiments. (b) Microscopy images for the WT and the different variants at a concentration of 6 μM, shown in the box bounded by solid lines, and additionally at 60 μM for the GKGNSPYS variant in the box bounded by dashed lines. (Scale bar, 5 μm) (c) Saturation concentrations (Csat) measured at 20 °C for the different variants. GQGDSPYS shows no measurable transition even up to a concentration of 80 μM. (d) Average residue pairwise contacts estimated through atomistic simulations for GQGNSPYS. Residue pairwise contacts are plotted with respect to WT. The diagonal indicates equal number of contacts in WT and the variant. Residue pairs not involving the mutated residues are shown as gray circles, while residue pairs involving the mutated residues are shown in accordance with the color code for the mutations in the plot. The lower plot shows contact ratio (Pcontactvariant/PcontactWT of residue pairs in the variant and the WT. The bars follow the same color code for mutations. (e,f) Contact ratio of residue pairs in the GQGDSPYS (e) and GRGNSPYS (f) variants and the WT. Contacts not involving the mutated residue are shown as gray bars, while contacts involving the mutated residue are shown in color. (g) Angle vs. Distance plots highlighting the frequency of occurrence of different configurations adopted between Tyr and Arg (left) and Lys (right) in atomistic simulations of the condensed phases of the GRGNPYS and GKGNSPYS variants. The snapshot above the respective plots shows the definition of the measured angle, θ, and distance, d. (h) Correlation plot similar to (d), comparing residue pair contacts between GRGNSPYS and GKGNSPYS variants.
Fig. 4
Fig. 4. Aromatic residues promote but are not required for phase separation.
(a) Average residue pairwise contacts estimated through atomistic simulations for GRGNSPAS with respect to the GRGNSPYS variant. Residue pairs not involving mutated residues are shown as gray circles while residue pairs involving the mutated residues (Y-to-A) are shown as purple triangles. The plot below shows the contact ratio of each of the residue pairwise contacts for the GRGNSPAS variant to that of the GRGNSPYS variant. (b) Partial phase diagrams for WT (GRGDSPYS), GRGNSPYS, and GRGNSPAS in PBS. Dashed lines in the left plot are obtained through a logarithmic fit to the measured transition temperatures at each concentration from turbidity experiments. Data are presented as mean values +/− SD, n=3 independent experiments. (c) Microscopy for WT, GRGNSPYS, and GRGNSPAS variants at a concentration of 6 μM, shown in the box bounded by solid lines, and additionally for 60 μM for GRGNSPAS, shown in the box bounded by dashed lines. (Scale bar, 5μm) (d) Partial phase diagrams for GRGNSPFS and GRGNSPWS variants in PBS, with WT and GRGNSPYS variants shown as a reference. Dashed lines in the left plot are obtained through a logarithmic fit to the measured transition temperatures at each concentration from turbidity experiments. Data are presented as mean values +/− SD, n=3 independent experiments. (e) Microscopy for the WT, GRGNSPYS, GRGNSPFS, and GRGNSPWS variants at a concentration of 6 μM, shown in the box bounded by solid lines, and additionally for 60 μM for GRGNSPFS, shown in the box bounded by dashed lines. (Scale bar, 5μm). Note: Phase diagrams and microscopy data for WT and GRGNSPYS are the same as shown in Fig. 2; they are repeated here for reference.
Fig. 5
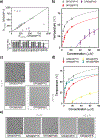
Fig. 5. Variants result in condensates with diverse material properties.
(a) Fluorescence microscopy image of 0.5 μm yellow-green fluorescent polystyrene beads embedded in WT droplet (Scale bar, 5 μm). Inset: Representative trajectory from two-dimensional particle tracking showing Brownian motion of the beads (length of inset box represents 0.02 μm). Similar results were obtained from at least two independent analyses. Representative snapshots from Supplementary Movie 1. (b) Ensemble mean-squared displacement versus lag time for the variants tested in this study. (GQGDSPYS is not shown because it did not phase separate, and GRGNSPAS condensates were too small to analyze using our microrheology method.) (c) Viscosity of the variants, calculated from the particle tracking results after noise correction. Data are presented as mean values +/− SD, n=8 different videos from two independent trials (d) State diagram showing saturation concentration, Csat, and viscosities for the variants tested in this study. Csat is calculated at 18 °C. For viscosity measurements, total concentration differed for different variants. The symbols and colors on the plot are in accordance with the legend of subplot (b). Pearson correlation coefficient (R) and coefficient of determination (R2) are shown as measures of correlation.
Fig. 6
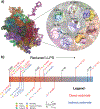
Fig. 6. A multitude of interactions work in tandem to drive LLPS.
(a) Snapshot from atomistic simulations of WT, highlighting representative examples of the wide variety of contacts driving phase separation of WT. Residues are represented by their three letter amino acid codes. (b) Effect of different mutations to Csat at 37 °C, normalized by the number of mutations carried out (denoted by N). Csat denotes the saturation concentration of the variant, whereas Cref denotes the saturation concentration of the reference sequence used to calculate the effect of the mutation. Direct estimates refer to values for which the mutation was carried out in this work, while indirect estimates refer to values where the mutations were not carried out but can be estimated based on combining data from multiple investigated variants. Residues are colored based on the classification used in Fig.1a.

Similar articles

Cited by

References

    1. Feric M et al. Coexisting liquid phases underlie nucleolar subcompartments. Cell 165, 1686–1697 (2016). - PMC - PubMed
    1. Brangwynne CP et al. Germline P granules are liquid droplets that localize by controlled dissolution/condensation. Science 324, 1729–1732 (2009). - PubMed
    1. Lyon AS, Peeples WB & Rosen MK A framework for understanding the functions of biomolecular condensates across scales. Nature Reviews Molecular Cell Biology 22, 215–235 (2021). - PMC - PubMed
    1. Alberti S & Dormann D Liquid–liquid phase separation in disease. Annual review of genetics 53, 171–194 (2019). - PubMed
    1. Alberti S & Hyman AA Biomolecular condensates at the nexus of cellular stress, protein aggregation disease and ageing. Nature reviews Molecular cell biology 22, 196–213 (2021). - PubMed

LinkOut - more resources