. 2024 May;130(11):1841-1854.
doi: 10.1038/s41416-024-02666-y. Epub 2024 Mar 29.

Identification of MYCN non-amplified neuroblastoma subgroups points towards molecular signatures for precision prognosis and therapy stratification

Affiliations

Identification of MYCN non-amplified neuroblastoma subgroups points towards molecular signatures for precision prognosis and therapy stratification

Xiaoxiao Hu et al. Br J Cancer. 2024 May.

Abstract

Background: Despite the extensive study of MYCN-amplified neuroblastomas, there is a significant unmet clinical need in MYCN non-amplified cases. In particular, the extent of heterogeneity within the MYCN non-amplified population is unknown.

Methods: A total of 1566 samples from 16 datasets were identified in Gene Expression Omnibus (GEO) and ArrayExpress. Characterisation of the subtypes was analysed by ConsensusClusterPlus. Independent predictors for subgrouping were constructed from the single sample predictor based on the multiclassPairs package. Findings were verified using immunohistochemistry and CIBERSORTx analysis.

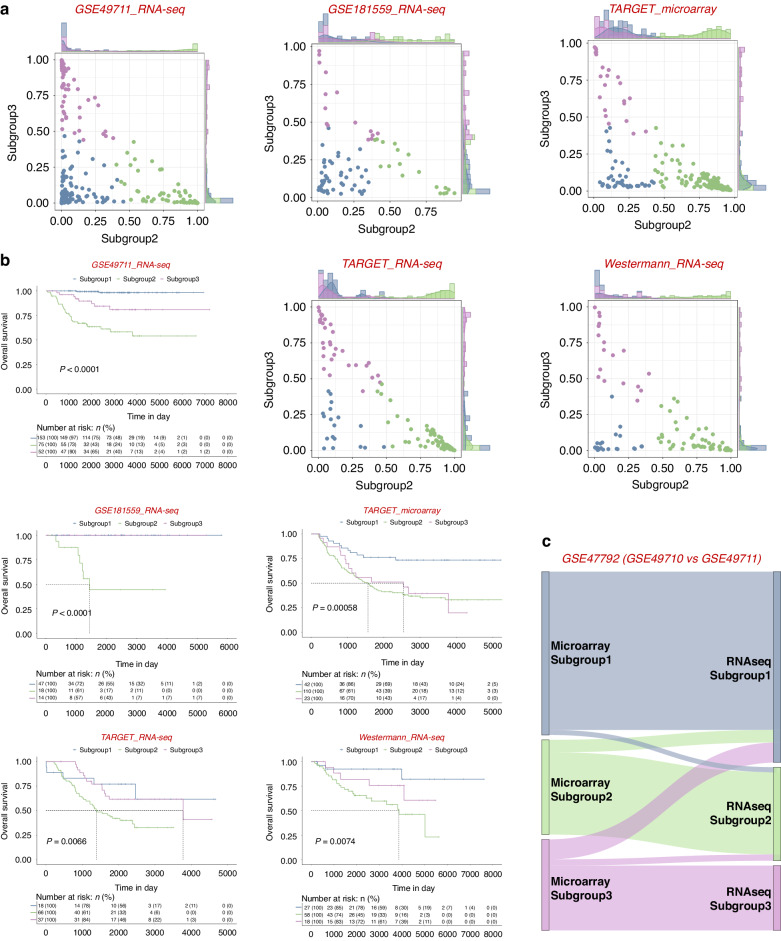
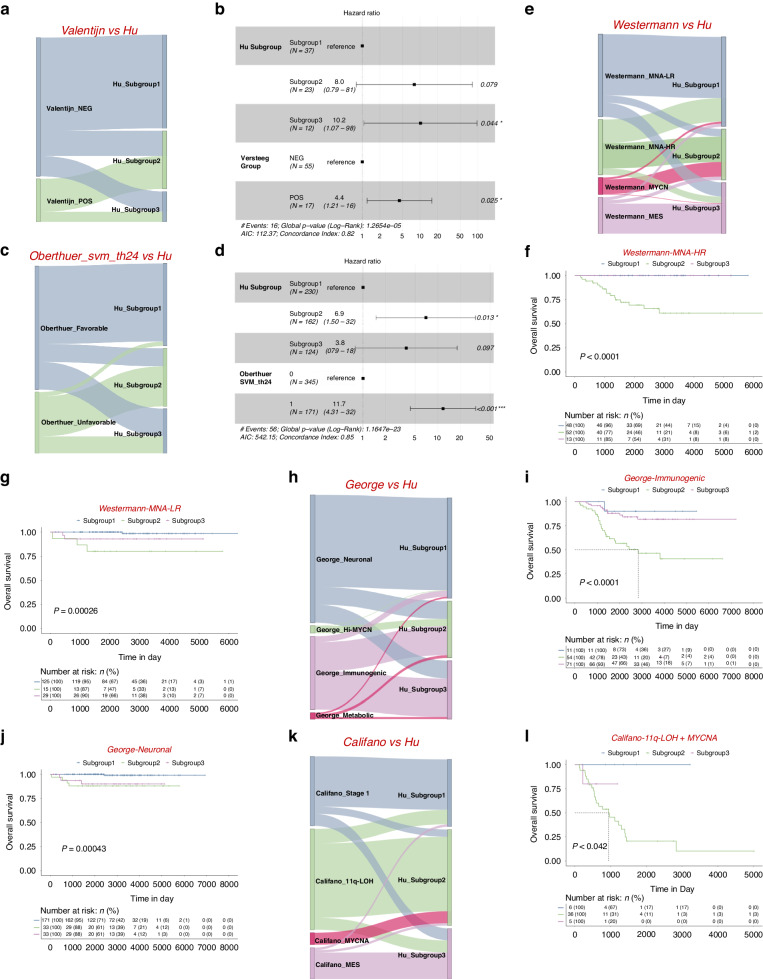
Results: We demonstrate that MYCN non-amplified neuroblastomas are heterogeneous and can be classified into 3 subgroups based on their transcriptional signatures. Within these groups, subgroup_2 has the worst prognosis and this group shows a 'MYCN' signature that is potentially induced by the overexpression of Aurora Kinase A (AURKA); whilst subgroup_3 is characterised by an 'inflamed' gene signature. The clinical implications of this subtype classification are significant, as each subtype demonstrates a unique prognosis and vulnerability to investigational therapies. A total of 420 genes were identified as independent subgroup predictors with average balanced accuracy of 0.93 and 0.84 for train and test datasets, respectively.

Conclusion: We propose that transcriptional subtyping may enhance precision prognosis and therapy stratification for patients with MYCN non-amplified neuroblastomas.


Conflict of interest statement

The authors declare no competing interests.

Figures

Fig. 1
Fig. 1. Characterisation of molecular subtypes in the MYCN non-amplified neuroblastomas.
a Workflow showing the study design (details provided in the Supplementary Methods). b Consensus clustering of top 50% variable genes of train cohort. c Principal component analysis (PCA) showing neuroblastoma patients with subgroup annotations.
Fig. 2
Fig. 2. Clinical characterisation of subtypes within MYCN non-amplified neuroblastomas identifies key distinguishing features.
Graphs showing the frequency (%) of each molecular subtype in different International Neuroblastoma Staging System (INSS) stages or risk status in either train (a) or test (b) cohort. P values are indicated. Kaplan−Meier plots showing the overall survival in each molecular subtype or MYCN-amplification (MYCN-AMP) in either train (c) or test (d) cohort. The numbers below are n (%). P values are indicated. e Multivariate analysis of subgroup classification with risk status in MYCN non-amplified neuroblastomas. HR (hazard ratio), 95% CI (confidence interval), patient number (n), and P values are shown. f Prediction error curves (indicating a mean squared error in predicting survival status) are calculated for the subgroup (red) and INSS stage (green).
Fig. 3
Fig. 3. Defining molecular features of 3 subtypes in MYCN non-amplified neuroblastomas.
a Heatmap showing differential expression of selected genes. Red indicates up-regulation and blue for down-regulation. Colour bars show subgroup information. b Gene set enrichment analysis (GSEA) in 3 subtypes. *FDR (false discovery rate) <0.25; **FDR < 0.05; ***FDR < 0.01. c Weighted gene co-expression network analysis (WGCNA) showing 3 molecular modules. Nodes are colour-coded according to the WGCNA modules. Representative enriched pathway terms are indicated. d Overlay of the median-cantered log2 fold change values per subgroup on the network.
Fig. 4
Fig. 4. Subgroup 2 shows a “MYCN” signature, potentially induced by Aurora Kinase A overexpression.
Violin plots showing MYCN mRNA levels (a) or MYCN scores (b) in neuroblastomas. P values are indicated. c Multivariate analysis of MYCN score and risk status in MYCN non-amplified neuroblastomas. HR (hazard ratio), 95% CI (confidence interval), patient number (n), and P values are shown. d Protein-protein interaction (PPI) network showing an interaction between AURKA and MYCN. e Violin plot showing AURKA mRNA levels in neuroblastomas. P values are indicated. f Kaplan−Meier plot showing the overall survival in samples with low vs. high AURKA expression. The numbers below are n (%). HR (hazard ratio), 95% CI (confidence interval), patient number (n), and P values are shown.
Fig. 5
Fig. 5. N-MYC expression correlates with Aurora kinase A status in MYCN non-amplified neuroblastomas and is indicative of patient survival.
a Representative N-MYC staining pattern (negative or positive N-MYC) in MYCN non-amplified neuroblastoma tissue microarray cores. Scale bar: 1 mm (the left column) and 50 μm (the right column). b Kaplan−Meier plot showing the overall survival in samples with negative vs. positive N-MYC expression. The numbers below are n (%). HR (hazard ratio), 95% CI (confidence interval), patient number (n), and P values are shown. c Adjacent tumour sections from representative cases showing N-MYC and Aurora Kinase A expression in MYCN non-amplified neuroblastoma. Scale bars: 50 μm. d Kaplan−Meier plot showing the overall survival in samples with low vs. high Aurora kinase A expression. The numbers below are n (%). HR (hazard ratio), 95% CI (confidence interval), patient number (n), and P values are shown. e Graph showing percentage (%) and numbers of samples with low or high Aurora kinase A in the negative or positive N-MYC group. P = 0.041.
Fig. 6
Fig. 6. Subgroup 3 is accompanied by an “inflamed” gene signature.
a Heatmap showing neuroblastoma-associated immune pathways and immune cell signatures in subgroups and MYCN-AMP. Graphs showing the cumulative distribution of CYT (b) or MHC-1 (c) scores in different subgroups and MYCN-AMP. d Violin plots showing immune scores in different subgroups and MYCN-AMP in train, test, or train plus test cohort. e Graph showing cell compositions of each subgroup using CIBERSORTx analysis. f Graph showing differential putative immunotherapeutic response in different subgroups. Bonferroni adjusted P values indicated. g Subclass association (SA) matrix for the comparison between different subgroups and vehicle/anlotinib treated mouse. Bonferroni adjusted P values indicated.
Fig. 7
Fig. 7. Identification and evaluation of independent predictors to subgroup patients within MYCN non-amplified neuroblastomas.
a Predicted probability of each subgroup in 5 different cohorts. Each dot in the scatter plot corresponds to a sample (x-axis: predicted probability of subgroup 2, y-axis: predicted probability of subgroup 3). The histogram plot above the scatter plot displayed the distribution of subgroup 2 probabilities while the plot to the right of the scatter plot displayed the distribution of subgroup 3 probabilities. b Kaplan−Meier plots showing the overall survival in predicted molecular subtype in 5 different cohorts. The numbers below are n (%). P values are indicated. c Prediction differences in the superseries GSE47792 using data from either RNA-seq (GSE49711) or microarray (GSE49710).
Fig. 8
Fig. 8. A systematic comparison of the subgroup classifier with previously published gene expression classifiers.
a Prediction differences in GSE16476 using the subgrouping method from this report (named Hu) or Valentijn and colleagues (Valentijn). b Multivariate analysis of subgroup classification with Valentijn classification in MYCN non-amplified neuroblastomas. HR (hazard ratio), 95% CI (confidence interval), patient number (n), and P values are shown. c Prediction differences in E-MTAB-1781 using the subgrouping method from this report (named Hu) or Oberthuer and colleagues (Oberthuer’s svm_th24). d Multivariate analysis of subgroup classification with Oberthuer’s svm_th24 classification in MYCN non-amplified neuroblastomas. HR (hazard ratio), 95% CI (confidence interval), patient number (n), and P values are shown. e Prediction differences in GSE49711 using the subgrouping method from this report (named Hu) or Westermann and colleagues (Westermann). Kaplan−Meier plots showing the overall survival in Westermann_MNA-HR (f) or Westermann_MNA-LR (g) patients using the subgrouping method from this report. Numbers below are n (%). P values are indicated. h Prediction differences in GSE49711 using subgrouping method from this report (named Hu) or George and colleagues (George). Kaplan−Meier plots showing the overall survival in George_Immunogenic (i) or George_Neuronal (j) patients using the subgrouping method from this report. The numbers below are n (%). P values are indicated. k Prediction differences in GSE85047 using the subgrouping method from this report (named Hu) or Califano and colleagues (Califano). l Kaplan−Meier plots showing the overall survival in Califano_11q-LOH & MYCNA patients using the subgrouping method from this report. The numbers below are n (%). P values are indicated.

Similar articles

Cited by

References

    1. Stiller CA, Parkin DM. International variations in the incidence of neuroblastoma. Int J Cancer. 1992;52:538–43. doi: 10.1002/ijc.2910520407. - DOI - PubMed
    1. Tsubota S, Kadomatsu K. Origin and initiation mechanisms of neuroblastoma. Cell Tissue Res. 2018;372:211–21. doi: 10.1007/s00441-018-2796-z. - DOI - PubMed
    1. London WB, Castleberry RP, Matthay KK, Look AT, Seeger RC, Shimada H, et al. Evidence for an age cutoff greater than 365 days for neuroblastoma risk group stratification in the Children’s Oncology Group. J Clin Oncol. 2005;23:6459–65. doi: 10.1200/jco.2005.05.571. - DOI - PubMed
    1. Song X, Huang C, Wang S, Yan L, Wang J, Li Y. Neck management in patients with olfactory neuroblastoma. Oral Oncol. 2020;101:104505. doi: 10.1016/j.oraloncology.2019.104505. - DOI - PubMed
    1. Boeva V, Louis-Brennetot C, Peltier A, Durand S, Pierre-Eugène C, Raynal V, et al. Heterogeneity of neuroblastoma cell identity defined by transcriptional circuitries. Nat Genet. 2017;49:1408–13. doi: 10.1038/ng.3921. - DOI - PubMed

MeSH terms