. 2024 Apr;26(4):593-603.
doi: 10.1038/s41556-024-01387-x. Epub 2024 Mar 29.

Cyclophilin A supports translation of intrinsically disordered proteins and affects haematopoietic stem cell ageing

Affiliations

Cyclophilin A supports translation of intrinsically disordered proteins and affects haematopoietic stem cell ageing

Laure Maneix et al. Nat Cell Biol. 2024 Apr.

Abstract

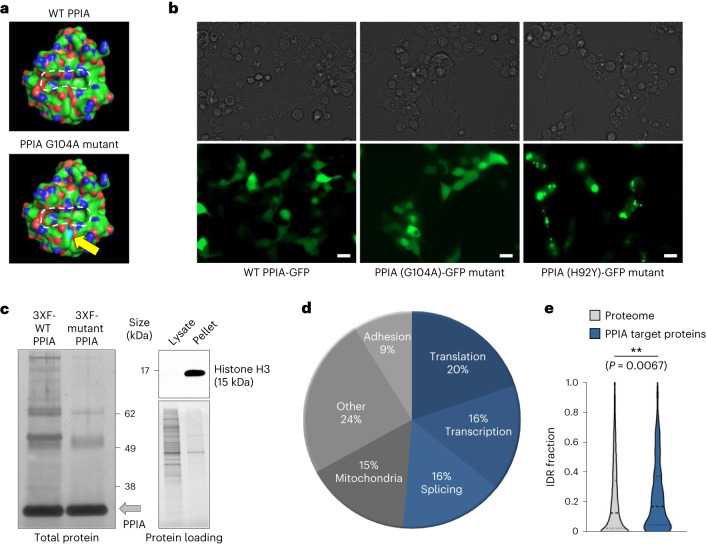
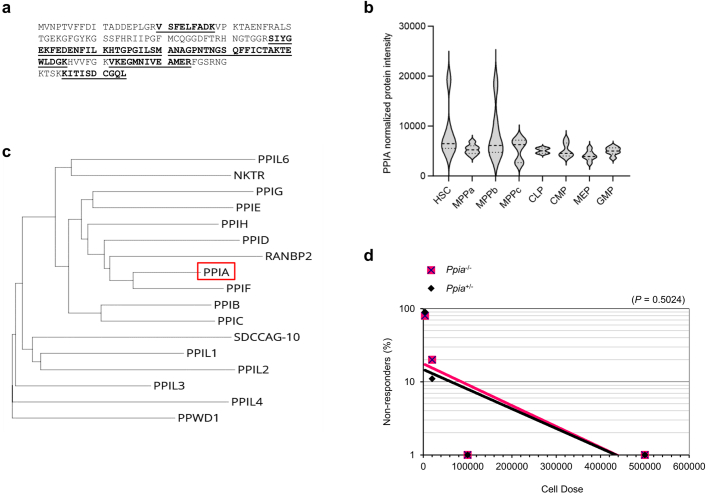
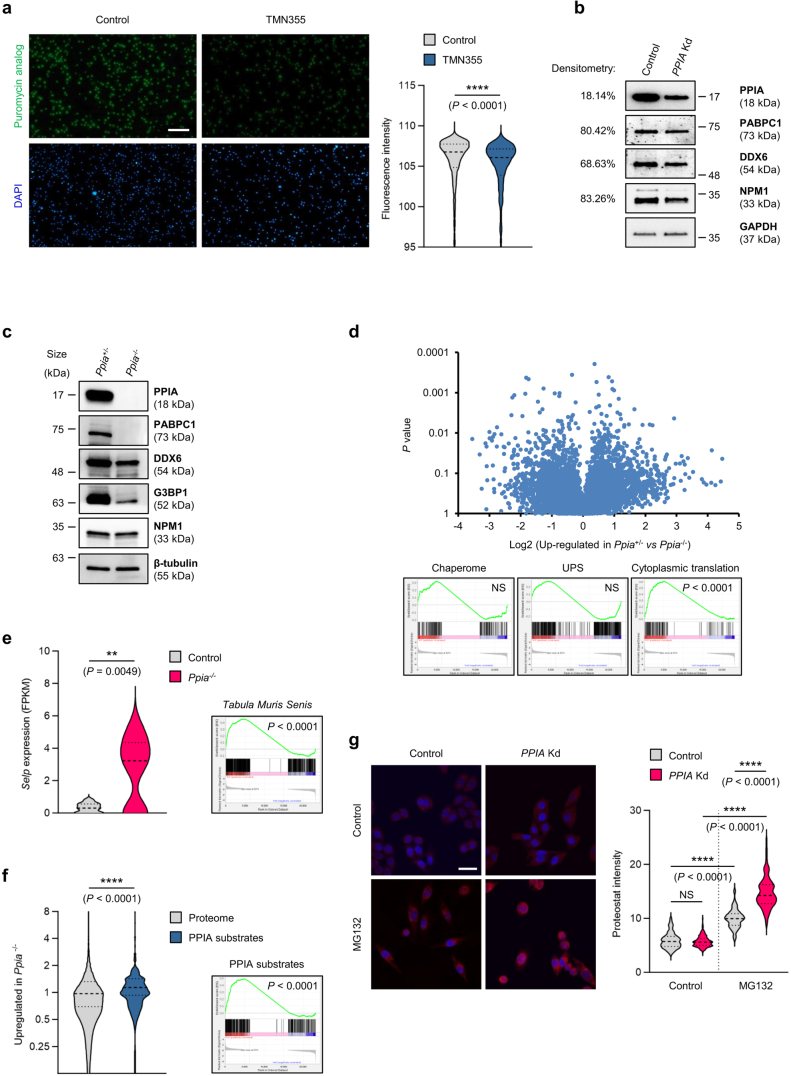
Loss of protein function is a driving force of ageing. We have identified peptidyl-prolyl isomerase A (PPIA or cyclophilin A) as a dominant chaperone in haematopoietic stem and progenitor cells. Depletion of PPIA accelerates stem cell ageing. We found that proteins with intrinsically disordered regions (IDRs) are frequent PPIA substrates. IDRs facilitate interactions with other proteins or nucleic acids and can trigger liquid-liquid phase separation. Over 20% of PPIA substrates are involved in the formation of supramolecular membrane-less organelles. PPIA affects regulators of stress granules (PABPC1), P-bodies (DDX6) and nucleoli (NPM1) to promote phase separation and increase cellular stress resistance. Haematopoietic stem cell ageing is associated with a post-transcriptional decrease in PPIA expression and reduced translation of IDR-rich proteins. Here we link the chaperone PPIA to the synthesis of intrinsically disordered proteins, which indicates that impaired protein interaction networks and macromolecular condensation may be potential determinants of haematopoietic stem cell ageing.


Conflict of interest statement

The authors declare no competing interests.

Figures

Fig. 1
Fig. 1. PPIA deficiency induces an ageing-like haematopoietic phenotype.
a, Left: HSPC lysate labelled with amine-reactive dye and separated on a 2D electrophoresis gel. Right: quantitative representation. Outlines indicate acetylated and non-acetylated PPIA. Dominant ontologies within each peak are depicted (representative of two independent experiments). b, Left: RNA-seq reads in the mouse HSPC transcriptome. PPIA is the sixth most highly expressed gene and the most highly transcribed chaperone in young HSPCs. Right: MS-based protein levels in the mouse HSPC proteome. PPIA is the second most highly expressed chaperone protein in the total proteome of young HSPCs. The results are representative of two independent biological replicates. c, Experimental workflow of competitive BM transplantation. d, Six months after BM transplantation, flow cytometry reveals that PPIA knockout (Ppia−/−) BM donor cells undergo a myeloid shift in the PB compared to animals receiving Ppia+/− BM. Total blood reconstitution was measured as a ratio of CD45.2+ to CD45.1+ cells (n = 10 mice per group at transplant initiation; data are representative of two independent experiments). e, Seven months after transplantation, BM flow cytometry shows that mice transplanted with Ppia−/− donor cells have increased common myeloid progenitors (CMPs) and decreased common lymphoid progenitors (CLPs) compared to recipients of Ppia+/− BM (n = 10 per group at initiation). f, Flow cytometry analysis comparing the ratios of HSPCs (LKS; lineage/c-Kit+/Sca1+ cells) and CD150high (lineage/c-Kit+/Sca1+/CD34/CD135/CD150high) HSCs following transplantation of Ppia−/− or Ppia+/− donor cells (n = 10 per group at initiation). g, Experimental workflow of competitive serial BM transplantation. h, Flow cytometry shows that Ppia−/− donor-derived progenitor cells exhaust in serial transplantations. Depicted is the proportion of donor-derived (CD45.2+) cells among PB cells two, four and twelve months after the first transplantation (n = 5 mice per group in the first round, n = 8 mice per group in the second and third rounds; data are representative of two independent experiments). For df and h, data are means ± s.d.; *P < 0.05, **P < 0.01 and ***P < 0.001; two-sided Wilcoxon rank-sum test. FPKM, fragments per kilobase of transcript per million mapped reads; iFOT, intensity-based fraction of total; NS, not significant. Source data.
Fig. 2
Fig. 2. PPIA overexpression improves transplantation outcomes of aged BM.
a, Experimental workflow. PB chimerism after up to six months of observation following transplantation of aged (18-month-old) lineage/c-Kit+/Sca1+ BM cells transduced with Ppia expressing lentivirus or negative control (reverse complement). b, Overexpression of PPIA improves haematopoietic reconstitution of aged CD45.2+ BM two, four and six months after transplantation (data are means ± s.d.; transplant initiated with n = 5 mice per group). c, PPIA levels in the PB are elevated in animals receiving Ppia-transduced BM (data are means ± s.d.). d, PPIA overexpressing blood shows no signs of myeloid bias in the CD45.2+ lineage (*P < 0.05, **P < 0.01; two-sided Wilcoxon rank-sum test). Source data.
Fig. 3
Fig. 3. PPIA interacts with intrinsically disordered proteins.
a, 3D models of the wild-type (WT) PPIA structure and the G104A mutant PPIA, which has restricted access to the catalytic core,. Dashed white lines outline the PPIA catalytic core. The arrow indicates the additional A104 methyl group in the mutant (light blue spheres). The PPIA structure was sourced from X-ray crystallography data deposited at the Protein Data Bank (7ABT). b, Expression pattern of WT and mutant PPIA proteins. 293T cells were transiently transfected with WT PPIA-GFP, PPIA (G104A)-GFP mutant or PPIA (H92Y)-GFP catalytic core mutant. At 24 h post transfection, the expression pattern of the WT and PPIA mutant proteins was assessed with a Zeiss Celldiscoverer 7 imaging system, using a GFP filter (bottom) or bright field (top). Scale bars, 20 µm. Data are representative of three independent experiments. c, Left: Immunoprecipitation and SYPRO Ruby gel stain of triple FLAG-tagged wild-type (3XF-WT PPIA) and G104A point-mutant PPIA (3XF-Mutant PPIA) were performed in 293T cells to identify PPIA-interacting proteins. The grey arrow indicates positive enrichment for PPIA protein in the pull-down fractions. Right: purity of the cytosolic cell lysates was verified by a lack of histone H3 protein expression in this subcellular fraction. Data are representative of three independent experiments. d, Gene Ontology enrichment analysis of 3XF-WT PPIA versus 3XF-Mutant PPIA immunoprecipitation–MS results. Data represent 385 consistently identified proteins in 293T cells (overlapping MS results from two separate experiments are depicted). e, Quantification of the fraction of IDRs in the total proteome versus 3XF-WT PPIA-interacting proteins. **P < 0.01; two-sided Wilcoxon rank-sum test (violin plot lines indicate quartiles; n = 385 PPIA target proteins). GFP, green fluorescent protein. Source data
Fig. 4
Fig. 4. PPIA activity promotes expression of proteins enriched for IDRs.
a, Schematic of the pulsed SILAC experiment to evaluate protein synthesis. Pulse treatment for 24 h allowed for metabolic labelling of newly translated proteins. Protein synthesis was determined by the heavy to unlabelled ratio quantified by MS, as described in refs. ,. Two independent experiments were performed. b, Pulsed SILAC was performed and protein extracts from control or PPIA knockdown (Kd) cell lines were analysed to measure newly synthetized proteins. The heatmap represents the relative degree of protein synthesis (n = 345 overlapping proteins compared between the different cell types). c, Uptake of heavy amino acids by control or PPIA Kd 293T cells was quantified following a pulsed SILAC experiment. A value of 0.5 indicates the equal presence of light and heavy labelled peptides. *P < 0.05, **P < 0.01 and ****P < 0.0001; two-sided Wilcoxon rank-sum test (comparing 160 PPIA target proteins to 1,280 non-targets; similar findings were observed for HeLa cells). d, List of PPIA client proteins involved in protein phase separation based on PhaSepDB2.0. Proteins are listed by their official gene name. Nuclear bodies include nucleoli, Cajal bodies, nuclear speckles, paraspeckles, promyelocytic leukemia (PML) nuclear bodies and histone locus bodies. e, Immunoprecipitation of endogenous PPIA protein in HeLa cells followed by a western blot to detect the PPIA protein partners (poly(A)-binding protein 1 (PABPC1), DEAD-box helicase 6 (DDX6), Ras GTPase-activating protein-binding protein 1 (G3BP1) and nucleophosmin 1 (NPM1)). Data are representative of two independent experiments, confirmed by unbiased MS. f, PPIA activity is required for substrate binding. PPIA wild type, but not the G104A mutant, binds to PABPC1, DDX6 and NPM1 in IP–western experiments in HeLa cells. Data are representative of two independent experiments, confirmed by unbiased MS. g, Reduced expression of PPIA substrates following knockdown of the chaperone. HeLa cells were stably transduced with negative control or PPIA knockdown construct Kd1. Shown are representative immunoblots of n = 3 independent biological replicates. Right: a pairwise comparison shows significant reduction of PABPC1, DDX6 and NPM1 in PPIA knockdown cells by densitometry. GAPDH expression was used as a reference. Data are means ± s.d.; *P < 0.05, **P < 0.01; two-sided paired Student’s t-test. DMEM, Dulbecco’s modified Eagle medium. Source data
Fig. 5
Fig. 5. PPIA regulates protein phase separation of its substrates.
a, Stress-granule formation was visualized and quantified with G3BP1 staining after stress induction with sodium arsenite in HeLa control or PPIA Kd cells. DAPI, blue; G3BP1, green. Scale bars, 50 µm. PPIA knockdown was partially rescued by the reintroduction of knockdown-resistant PPIA. Cell viability was measured on an automated cell counter with acridine orange/propidium iodide staining solution using n = 6 independently treated replicates per group. Data are means ± s.d.; **P < 0.01, ****P < 0.0001; two-sided Wilcoxon rank-sum test; n = 616 (control), n = 656 (control + PPIA), n = 254 (PPIA knockdown) and n = 293 (PPIA knockdown + PPIA) cells were analysed following blinding. Data are representative of three independent experiments. b, Staining for DDX6 revealed significantly fewer P-bodies in HeLa cells following PPIA knockdown. Scale bars, 20 μm. The arrowhead indicates a representative P-body. ****P < 0.0001; two-sided Wilcoxon rank-sum test; n = 457 (control) and n = 284 (PPIA knockdown) cells were analysed following blinding. Data are representative of three independent experiments. c, OCI-AML3 cells that express a stable, gene-edited NPM1-mCherry fusion, exhibited smaller, more fragmented nucleoli following PPIA knockdown. Cell designation was blinded for the analyst. Scale bars, 20 μm. ***P < 0.001, ****P < 0.0001; two-sided Wilcoxon rank-sum test; n = 564 (control) and n = 617 (PPIA knockdown) cells were analysed following blinding. Data are representative of three independent experiments. d, PLAs in primary haematopoietic stem cells (lin/c-Kit+/Sca1+/CD34/CD135) between PPIA and PABPC1, DDX6 and NPM1. Shown is the signal quantification using single-antibody staining as a control. Scale bar, 5 μm. ****P < 0.0001; two-sided Wilcoxon rank-sum test. Cells were analysed following blinding. Box plots indicate minima, maxima and quartiles; n = 20 randomly chosen cells per group. Data are representative of two independent experiments. Source data.
Fig. 6
Fig. 6. PPIA levels decline with age and contribute to IDR protein deficiency in HSPCs.
a, PLA to quantify PPIA protein levels in mouse HSCs shows decreased PPIA expression in 23-month-old HSCs when compared to 5-month-old cells. DAPI, blue; PPIA, red. Scale bars, 5 µm. ****P < 0.0001; two-sided Wilcoxon rank-sum test; n = 70 (young) and n = 101 (old) cells were analysed following blinding. Data are representative of two independent experiments. b, Quantification of IDR content in the mouse HSPC proteome by tandem-mass-tag (TMT) MS/MS and in the transcriptome (RNA-seq). Shown are the top quartiles of proteins/genes upregulated in young or old cells. NS, not significant; ****P < 0.0001; determined by two-sided Wilcoxon rank-sum test. Displayed are cumulative results from three independent experiments, with each experiment individually showing consistent outcomes. n = 726 proteins and n = 479 transcripts were analysed. c, Quantification of IDR content in the mouse HSPC proteome (TMT MS/MS) and transcriptome (RNA-seq). Shown are the top quartiles of proteins/genes upregulated in Ppia+/− or Ppia−/− cells. ****P < 0.0001; two-sided Wilcoxon rank-sum test. Displayed are cumulative results from three independent experiments, with each experiment individually showing consistent outcomes. n = 479 proteins and n = 1,528 transcripts were analysed. d, Model of PPIA activity and function in the ageing haematopoietic compartment. PPIA supports nascent proteins during translation and affects proline isomerization in IDRs. Therefore, proteins rich in IDRs, some of which can undergo phase separation, may require higher isomerization activity. PPIA expression decreases during haematopoietic ageing, and the aged proteome is consequently depleted of disordered proteins. In conclusion, PPIA deficiency impairs stress response in HSCs, biases lineage commitment, and accelerates HSC ageing. Source data
Extended Data Fig. 1
Extended Data Fig. 1. PPIA mass spectrometry and limiting dilution assay.
a, Identification coverage of PPIA. Spots were excised from 2-D SDS PAGE for extraction and trypsin digestion. MS/MS spectra cover 49.8% of the entire PPIA protein sequence (underlined; representative of two independent mass spectrometry identifications). b, Analysis of proteomic data in the haematopoietic compartment based on Zaro et al.. PPIA is robustly expressed in haematopoietic stem cells (HSCs), but also expressed in progenitor compartments throughout haematopoiesis. Violin plots represent PPIA abundance in six replicate animals. MPP, multipotent progenitors; CLP, common lymphoid progenitors; CMP, common myeloid progenitors; MEP, megakaryocyte-erythroid progenitors; GMP, granulocyte-monocyte progenitors. c, Phylogenetic tree of the Cyclophilin protein family in humans. The tree is based on protein sequence alignments from the NCBI RefSeq database with Clustal Omega. The red box indicates PPIA. Accession numbers for the individual proteins are: PPIL6 (NP_775943.1), NKTR (NP_005376.2), PPIG (NP_004783.2), PPIE (NP_006103.1) PPIH (NP_006338.1), PPID (NP_005029.1), RANBP2 (NP_006258.3), PPIA (NP_066953.1), PPIF (NP_005720.1), PPIB (NP_000933.1), PPIC (NP_000934.1), SDCCAG-10 (NP_005860.2), PPIL1 (NP_057143.1), PPIL2 (NP_055152.1), PPIL3 (NP_115861.1), PPIL4 (NP_624311.1), and PPWD1 (NP_056157.1). d, Limiting dilution transplantations of Ppia heterozygous (Ppia+/−) and knockout (Ppia−/−) bone marrow. 500,000 competitor cells (CD45.1+) were co-injected with 4,000, 20,000, 100,000, or 500,000 nucleated bone marrow cells of Ppia+/− or Ppia−/− mice. Reconstitution of peripheral CD45.2+ cells was assayed 20 weeks after transplantation and differences were compared using a two-tailed Poisson t-test. No significant difference exists between Ppia heterozygous and knockout donors; (a representative example of two independent experiments is shown with n = 5 animals per group for the two high donor cell doses and n = 10 animals per group for the two low donor cell doses). Source data.
Extended Data Fig. 2
Extended Data Fig. 2. PPIA functional validation experiments.
a, Interaction between PPIA and PABPC1 in haematopoietic cells. Co-IP followed by MS/MS identifies PABPC1 as an interactor of PPIA in the human haematopoietic cell lines THP1 (acute monocytic leukemia, AML) and NB4 (acute promyelocytic leukemia, APML). Cells were transduced with 3XF-tagged PPIA (3XF-WT-PPIA or 3XF-Mutant(G104A)-PPIA, respectively) and IP was performed with an anti-3XFLAG antibody. The arrow indicates the band for PABPC1 protein; (representative of two independent experiments shown). b, Identification coverage of PABPC1. Co-immunoprecipitated bands were excised after SDS-PAGE (Fig. 2b), trypsin digested, and identified by MS/MS. Coverage for PABPC1 extends to 26.4% of the protein, including the N-terminal RNA-binding domain, the C-terminal domain interacting with cap-binding proteins, and the unstructured linker region; (representative of two independent experiments shown). c, List of nucleotide-binding PPIA client proteins. Proteins listed by their official gene names. Nucleotide binding was determined based on UniProt classifications. d, Efficiency of PPIA knockdown in 293T cells and HeLa cells. Cells were stably transduced with pLKO.1-TRC control, TRC PPIA Kd1, or TRC PPIA Kd2 lentiviral vectors, respectively. Then, cell lysates were prepared and loaded onto a SDS-PAGE in order to measure PPIA protein expression by westernblot using a rabbit polyclonal anti-PPIA antibody. Glyceraldehyde 3-phosphate dehydrogenase (GAPDH) was used as a loading control for protein normalization; (representative of three independent experiments shown). e, Presence of intrinsically disordered regions correlates with a slower translation rate. Reanalysis of data from Schwanhäusser et al. showing the inverse correlation between protein translation speed and percentage of intrinsically disordered regions in the whole proteome. Proteins with more intrinsically disordered regions translate at a slower rate than structured proteins. Details on the calculation of protein synthesis rates have been described by the original authors. Source data
Extended Data Fig. 3
Extended Data Fig. 3. PPIA’s effect on transcription and translation in haematopoietic cells.
a, Impaired translation in haematopoietic stem and progenitor cells following pharmacological PPIA inhibition. Haematopoietic stem cells (lin/cKit+/Sca1+/CD34/CD135) were isolated and expanded in vitro as previously published. Translation rates were measured through bio-orthogonal labeling with a fluorescently labeled puromycin analog for two hours in cells that were pre-treated with DMSO or PPIA inhibitor TMN355 (10 μM, 24 h). Shown is a representative of three independent biological replicates, in which n = 1,880 (DMSO) and n = 1,303 (TMN355) cells were analysed and fluorescence was measured per cell. Scale bar, 100 μm (****P < 0.0001, two-sided Wilcoxon rank-sum test). Bottom panel depicts DAPI counterstain. b, Reduced expression of PPIA substrates in OCI-AML3 cells following PPIA knockdown. Western blot analyses to detect protein expression of PPIA and PPIA protein partners PABPC1, DDX6, and NPM1 in the OCI-AML3 cell line. GAPDH was used as a loading control for protein normalization and densitometry was measured relative to GAPDH expression. The images represent results of two independent experiments. c, Protein expression of PPIA client proteins is decreased in Ppia−/− HSPCs. Western blot analyses to detect protein expression of PPIA and PPIA protein partners PABPC1, DDX6, G3BP1, and NPM1 in mouse lineage-depleted bone marrow cells. The images represent results of Ppia+/− and Ppia−/− animals (n = 1 each). β-tubulin was used as a loading control for protein normalization. This experiment was performed once. d, Ppia knockout versus heterozygous haematopoietic stem and progenitor cells (lin/c-Kit+) upregulate genes involved in translation. Volcano plot shows comparable up- and downregulation of genes. Gene set enrichment analysis of haematopoietic stem and progenitor cells of Ppia knockout or heterozygous animals. N = 3 independent animals were analysed per group. Genes encoding the entire mouse chaperome or the ubiquitin-proteasome system (UPS) were not significantly increased in knockout cells. However, the gene ontology ‘cytoplasmic translation’ was significantly upregulated in knockout cells. e, Ppia knockout cells show the transcriptional signature of aging. Haematopoietic stem and progenitor cells (lin/cKit+) of three Ppia knockout animals compared to three heterozygous animals show significant upregulation of the aging marker gene P-selectin. In addition, we observed a strong gene set enrichment resembling aged haematopoietic stem cells. Statistics derived using two-sided Wilcoxon rank-sum test (n = 3 mice per group). f, Genes encoding PPIA substrates are upregulated in Ppia knockout haematopoietic stem and progenitor cells. Relative FPKM changes shown in cumulative violin plots representing three animals per genotype (Ppia knockout versus heterozygous); y-axis represented in log2. Gene set enrichment analysis of haematopoietic stem and progenitor cells (lin/c-Kit+) of Ppia knockout or heterozygous animals shows significant upregulation of PPIA substrates (n = 307) compared to the overall proteome (n = 6,114) in knockout animals. Statistics derived using two-sided Wilcoxon rank-sum test. g, No increased spontaneous aggregation of misfolded proteins in absence of PPIA. Left panel: Protein misfolding was quantified using the molecular rotor ProteoStat with affinity for aggregated proteins. Increased protein aggregation causes the dye to stop spinning and emit fluorescence. We analysed misfolding in HeLa cells transduced with either scramble lentivirus or following PPIA knockdown, and used proteasome inhibition as positive control (MG132, 10 μM, 16 h). Scale bar, 80 μm. Right panel: Relative mean intensity per cell was plotted and calculated after blinding. A total of 8 independently treated replicates were analysed per group in this assessment. Statistics calculated using two-sided Wilcoxon rank-sum test (n = 154 control cells, n = 147 PPIA knockdown cells for, n = 75 for MG132-treated control cells, and n = 86 for MG132-treated PPIA knockdown cells; the experiment was performed once). Source data
Extended Data Fig. 4
Extended Data Fig. 4. Mass spectrometry in the haematopoietic compartment.
a, Reanalysis of proteomic data in haematopoietic stem cells based on Zaro et al.. PPIA is significantly downregulated in aged haematopoietic stem cells (HSC). Violin plots represent PPIA abundance in n = 6 replicate animals. Statistics calculated using two-sided Wilcoxon rank-sum test (*P < 0.05). b, Quantification of IDR content in the top quartiles of proteins upregulated in the young and old mouse HSPC proteome by label-free MS/MS, respectively. Analysis of MS/MS data following '365' proteome profiling was validated by a total of two independent biological replicates. ****P < 0.0001, determined by two-sided Wilcoxon rank-sum test (n = 1,703 proteins per sample analysed). c, Aged HSPCs show lower levels of intrinsic disorder in their proteome. Shown are individual comparisons of three independent replicates with the top upregulated proteins, separated by median, in either young or old cells. Quantitative mass spectrometry was performed following isobaric labelling. ****P < 0.0001; two-sided Wilcoxon rank-sum test (n = 4,789, n = 4,789, and n = 4,706 proteins per sample analysed). d, Ppia knockout results in lower levels of proteome disorder. Shown are individual comparisons of three independent replicates with the top upregulated proteins, separated by median, in either Ppia heterozygous (equivalent to wild type) or knockout cells. Quantitative mass spectrometry was performed following isobaric labelling. **P < 0.01, ***P < 0.001, ****P < 0.0001; two-sided Wilcoxon rank-sum test (n = 4,788, n = 4,453, and n = 4,637 proteins per sample analysed). e, Validation of Ppia knockout efficiency in the sets of Ppia+/− and Ppia−/− mice used for TMT MS/MS experiments shown in Fig. 6c. Livers were homogenized with RIPA buffer and cell lysates were loaded onto a SDS-PAGE gel in order to measure PPIA protein expression by western blot using a rabbit polyclonal anti-PPIA antibody. Glyceraldehyde 3-phosphate dehydrogenase (GAPDH) was used as a loading control for protein normalization.
Extended Data Fig. 5
Extended Data Fig. 5. Clustering of proteomic data.
a, PPIA expression affects highly disordered proteins more than proteins with low levels of disorder. Proteins from haematopoietic stem and progenitor cells (lin) of three Ppia heterozygous or knockout animals were quantified by mass spectrometry following isobaric labeling and sorted from high levels to low levels of disorder (top to bottom). The top quartile of proteins with high degrees of intrinsic disorder cluster according to genotype of the origin cells after unbiased hierarchical cluster analysis. The degree of disorder of the top (100%), median (51%), and bottom protein (31%) within the highest quartile is depicted. b, IDR-poor proteins are less dependent on PPIA. Proteins at the bottom quartile of disorder fail to cluster by genotype, indicating that PPIA expression mostly affects highly disordered proteins. The degree of disorder of the top (2.9%), median (0.6%), and bottom protein (0%) within the lowest quartile is depicted. c, Structural disorder correlates with PPIA expression. Performing a reciprocal analysis, we conducted unbiased hierarchical clustering by genotype and protein disorder. The top cluster with consistent upregulation of proteins in PPIA expressing cells (marked with green box) showed significantly higher levels of structural disorder compared to the total proteome (*P < 0.05, ***P < 0.001, two-sided Wilcoxon rank-sum test). The protein cluster with consistent upregulation in PPIA-deficient cells (marked with red box) showed a trend for lower levels of intrinsic disorder compared to the total proteome (P = 0.079; three independent animals were analysed per genotype). Source data

Similar articles

Cited by

References

    1. Sun J, et al. Clonal dynamics of native haematopoiesis. Nature. 2014;514:322–327. doi: 10.1038/nature13824. - DOI - PMC - PubMed
    1. Lopez-Otin C, Blasco MA, Partridge L, Serrano M, Kroemer G. The hallmarks of aging. Cell. 2013;153:1194–1217. doi: 10.1016/j.cell.2013.05.039. - DOI - PMC - PubMed
    1. Signer RA, Magee JA, Salic A, Morrison SJ. Haematopoietic stem cells require a highly regulated protein synthesis rate. Nature. 2014;509:49–54. doi: 10.1038/nature13035. - DOI - PMC - PubMed
    1. Hidalgo San Jose L, et al. Modest declines in proteome quality impair hematopoietic stem cell self-renewal. Cell Rep. 2020;30:69–80. doi: 10.1016/j.celrep.2019.12.003. - DOI - PMC - PubMed
    1. Mohrin M, et al. Stem cell aging. A mitochondrial UPR-mediated metabolic checkpoint regulates hematopoietic stem cell aging. Science. 2015;347:1374–1377. doi: 10.1126/science.aaa2361. - DOI - PMC - PubMed

Publication types

MeSH terms