. 2024 May;25(5):873-885.
doi: 10.1038/s41590-024-01798-w. Epub 2024 Mar 29.

Thioredoxin is a metabolic rheostat controlling regulatory B cells

Affiliations

Thioredoxin is a metabolic rheostat controlling regulatory B cells

Hannah F Bradford et al. Nat Immunol. 2024 May.

Abstract

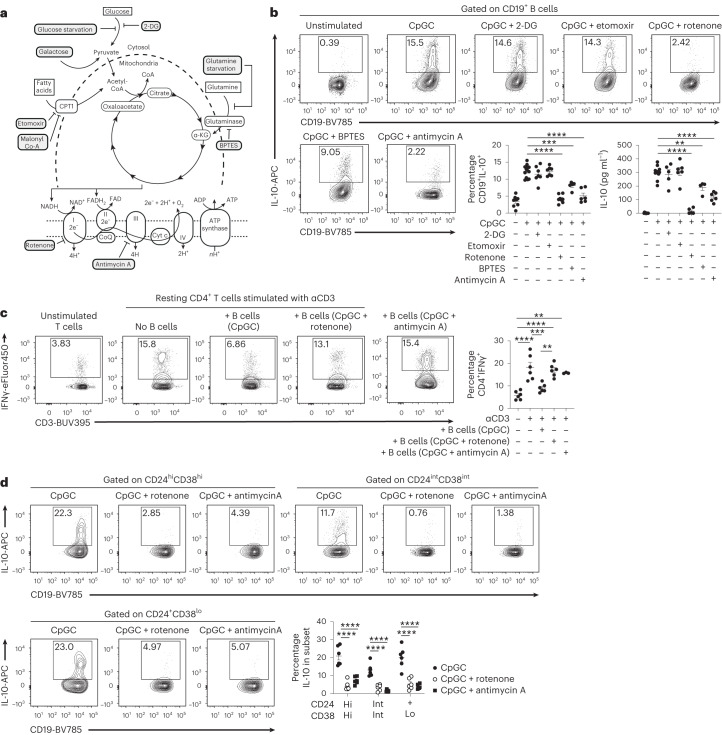
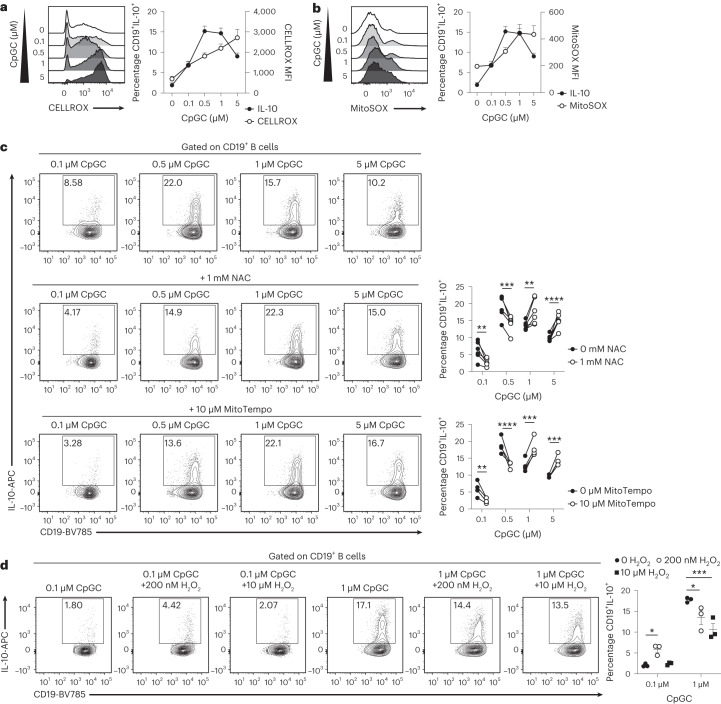
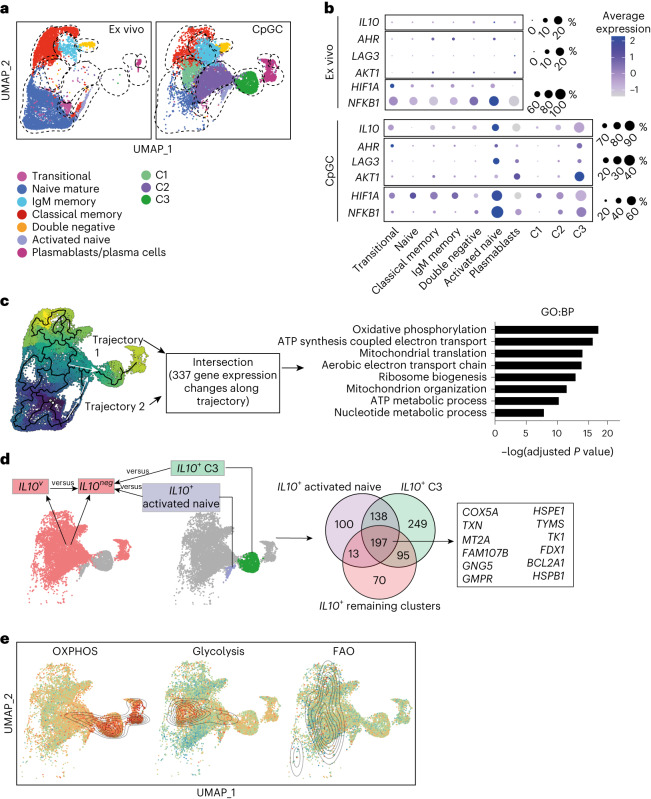
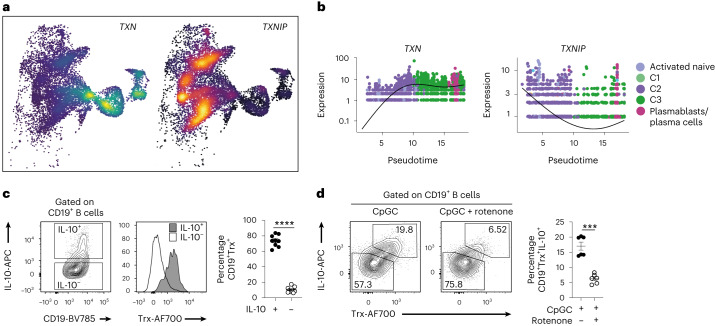
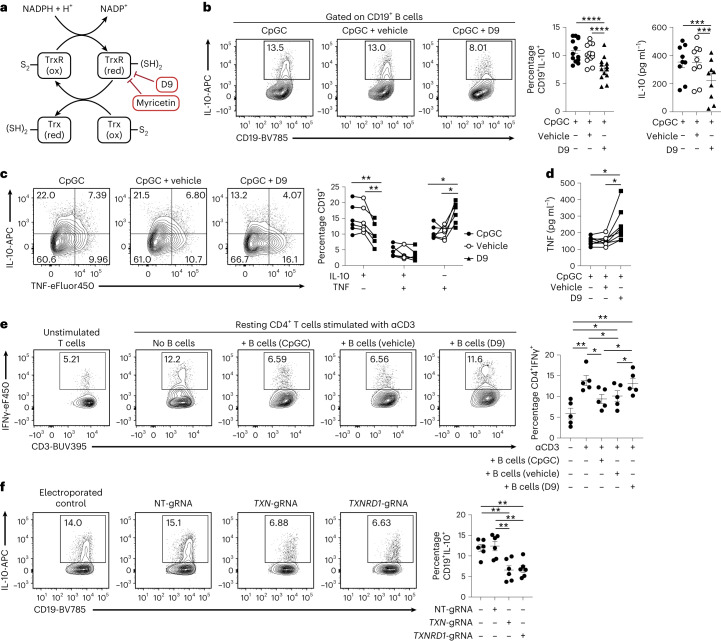
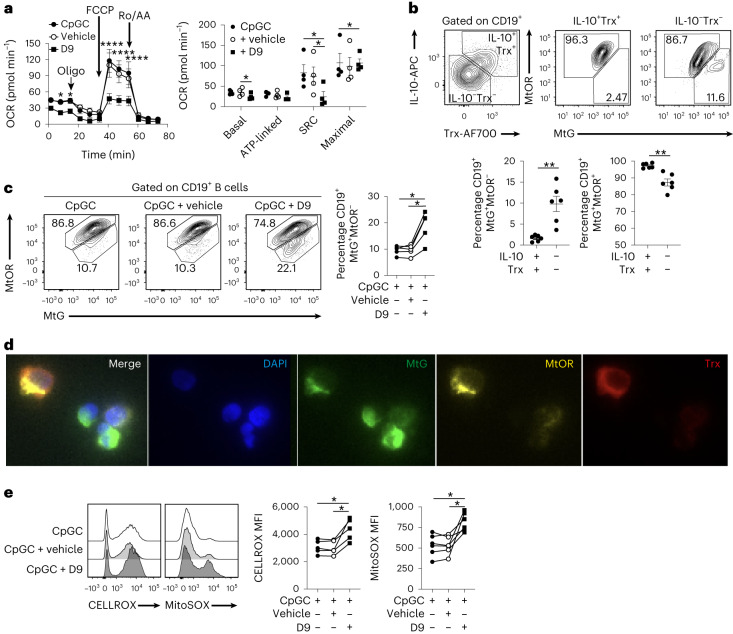
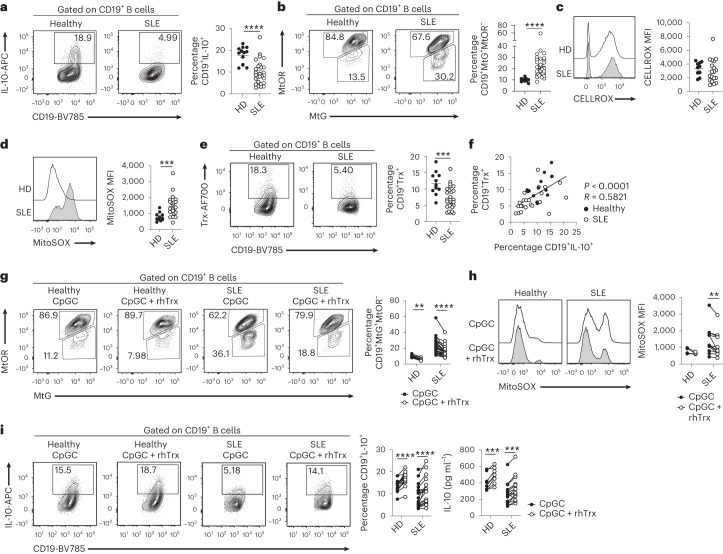
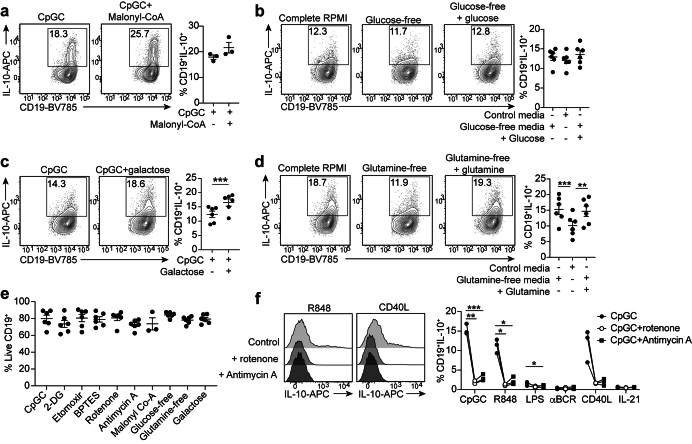
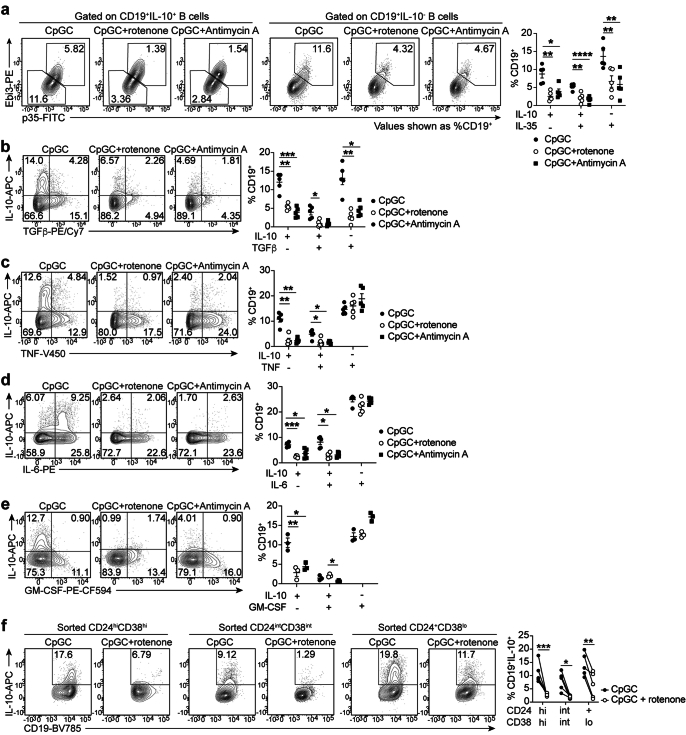
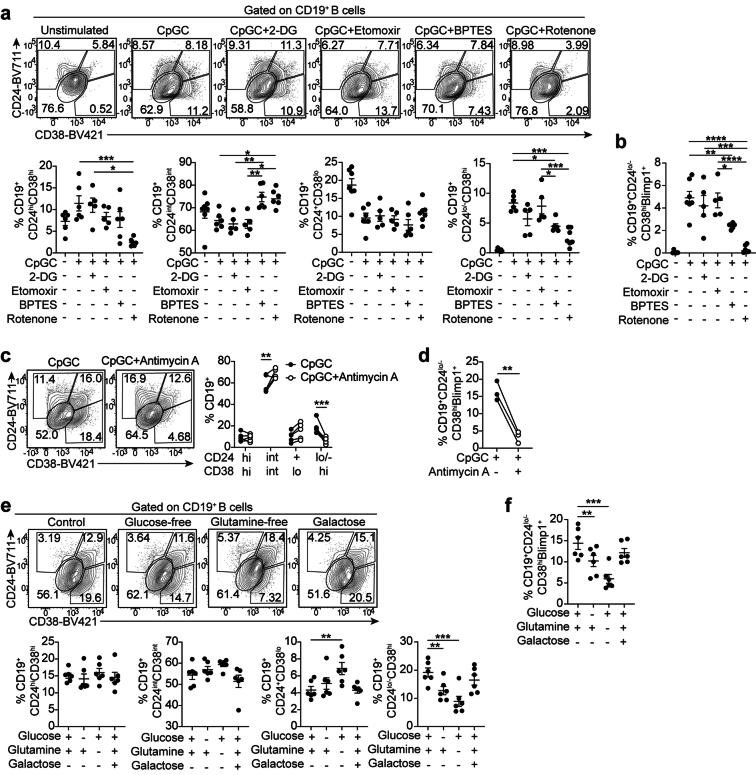
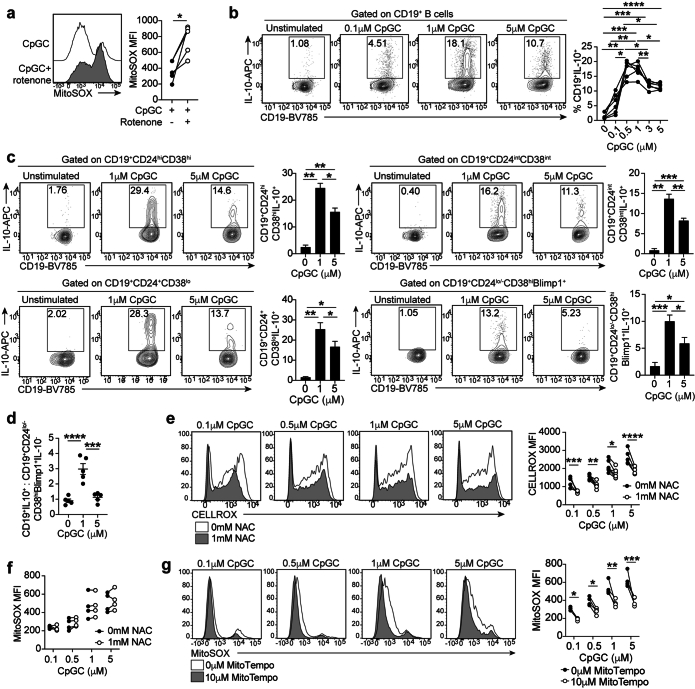
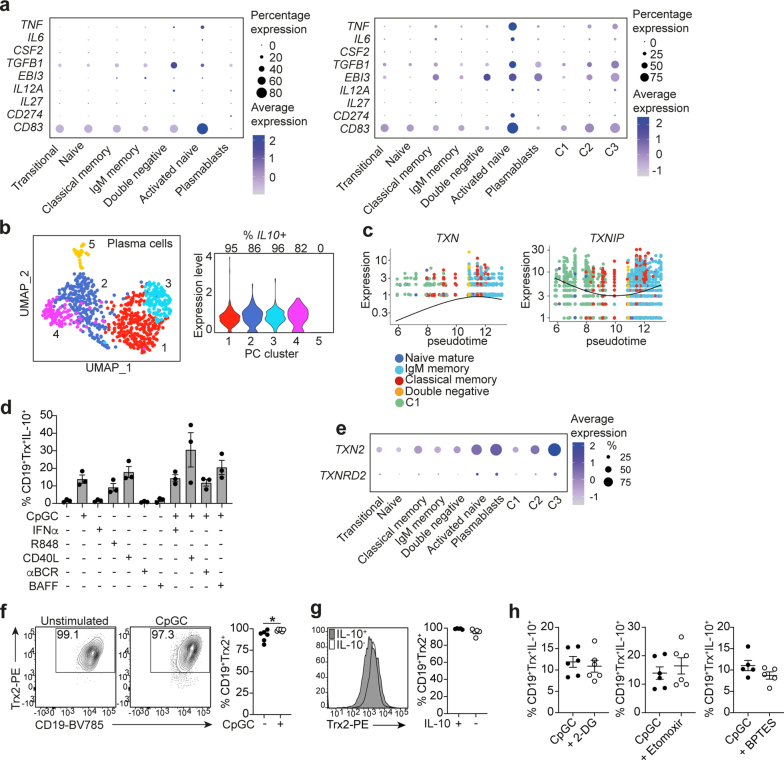
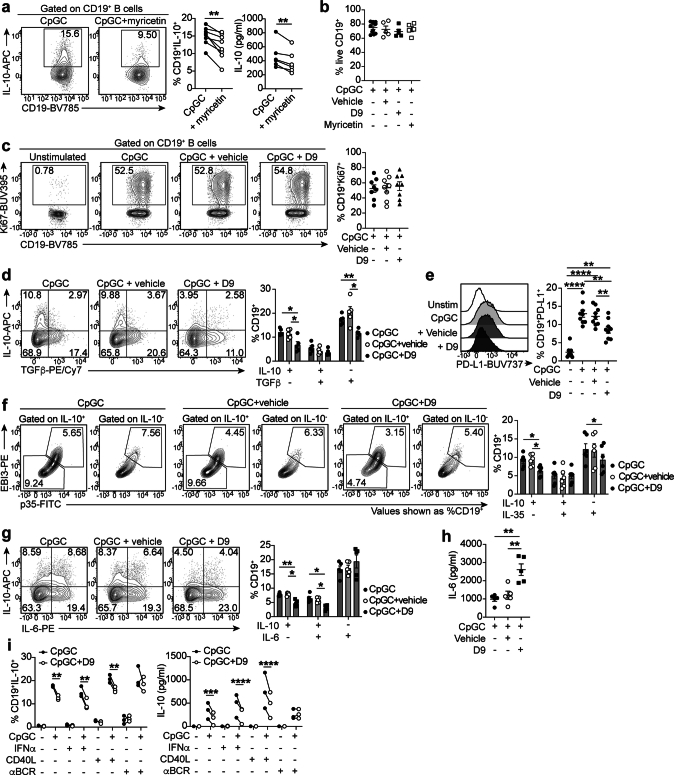
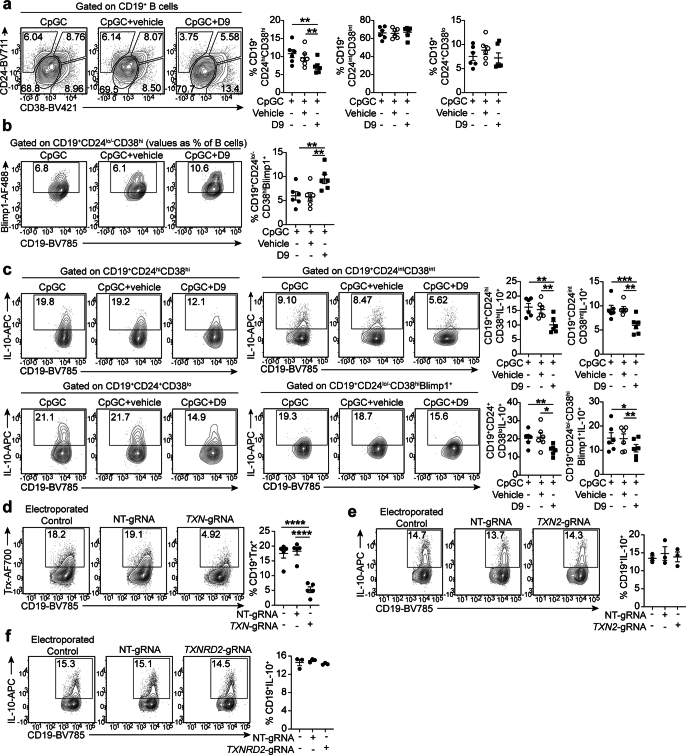
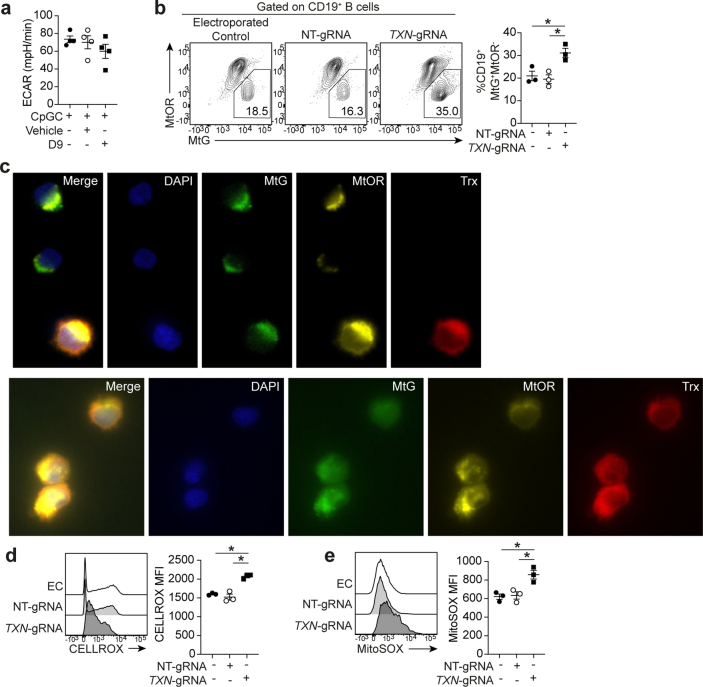
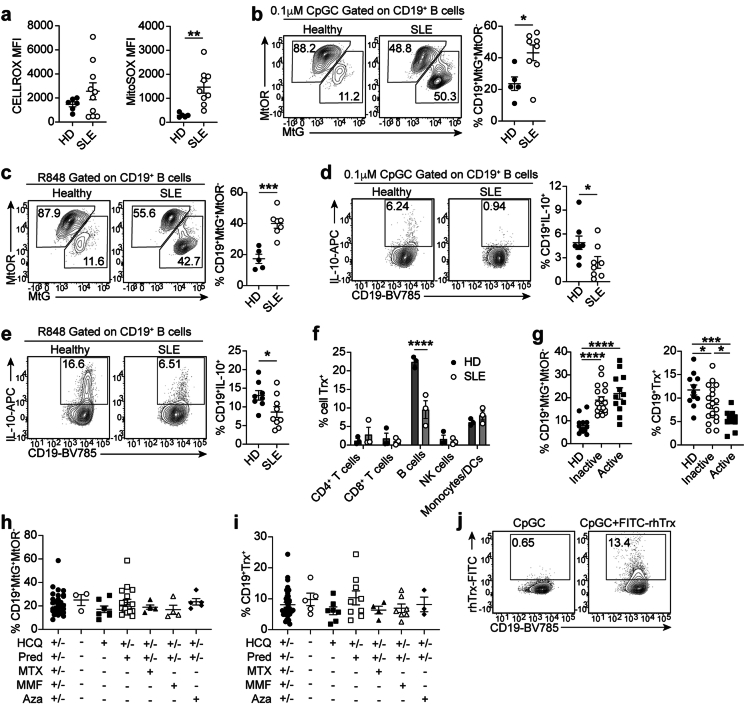
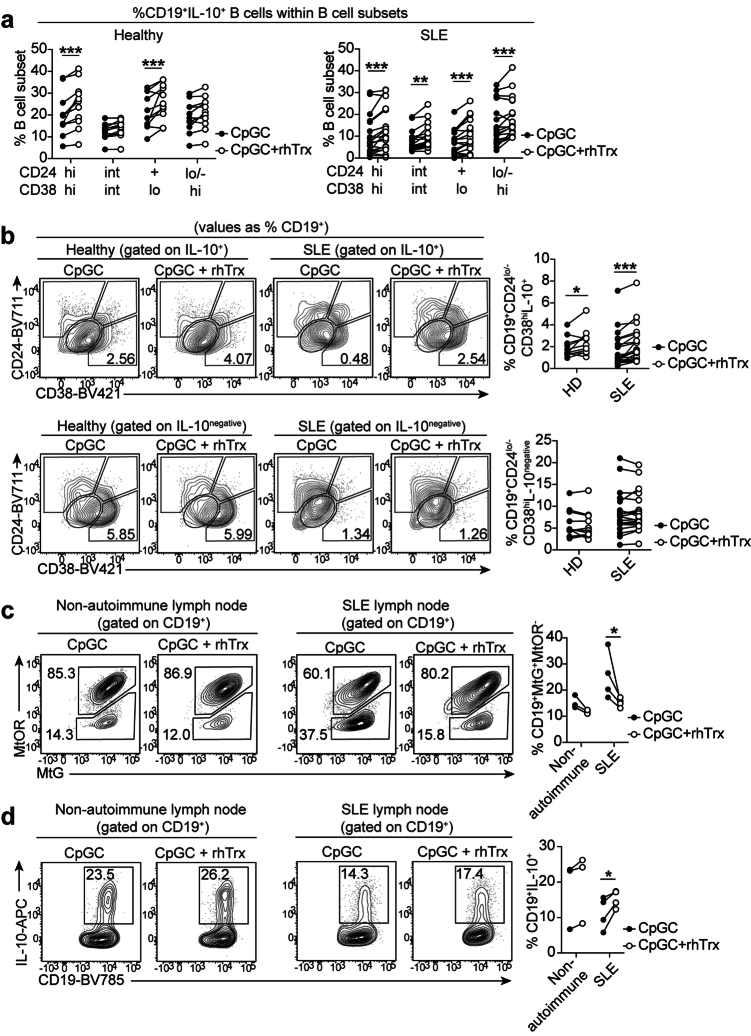
Metabolic programming is important for B cell fate, but the bioenergetic requirement for regulatory B (Breg) cell differentiation and function is unknown. Here we show that Breg cell differentiation, unlike non-Breg cells, relies on mitochondrial electron transport and homeostatic levels of reactive oxygen species (ROS). Single-cell RNA sequencing analysis revealed that TXN, encoding the metabolic redox protein thioredoxin (Trx), is highly expressed by Breg cells, unlike Trx inhibitor TXNIP which was downregulated. Pharmacological inhibition or gene silencing of TXN resulted in mitochondrial membrane depolarization and increased ROS levels, selectively suppressing Breg cell differentiation and function while favoring pro-inflammatory B cell differentiation. Patients with systemic lupus erythematosus (SLE), characterized by Breg cell deficiencies, present with B cell mitochondrial membrane depolarization, elevated ROS and fewer Trx+ B cells. Exogenous Trx stimulation restored Breg cells and mitochondrial membrane polarization in SLE B cells to healthy B cell levels, indicating Trx insufficiency underlies Breg cell impairment in patients with SLE.


Conflict of interest statement

The authors declare no competing interests.

Figures

Fig. 1
Fig. 1. ETC activity is critical for differentiation of IL-10+ B cells.
a, Schematic overview of cellular metabolism and the inhibition of glycolysis (2-DG, glucose starvation), FAO (etomoxir, malonyl co-A), glutamine metabolism (BPTES, glutamine starvation) and Complexes I and III of the ETC (rotenone and antimycin A, respectively). b, Representative contour plots and cumulative data show frequencies of CD19+IL-10+ B cells and IL-10 secretion following 72-h CpGC stimulation of isolated B cells with and without 1 mM 2-DG, 10 μM etomoxir, 1 μM rotenone, 500 nM BPTES or 10 nM antimycin A. **P = 0.001, ***P = 0.0002, ****P < 0.0001; data are representative of four independent experiments. c, Representative contour plots and cumulative data show the frequencies of CD3+CD4+IFNγ+ T cells after co-culture of CD4+ T cells stimulated with anti-CD3, with B cells preconditioned with CpGC, CpGC and rotenone, or CpGC and antimycin A. n = 6 (n = 3 for antimycin A) biologically independent samples examined over two independent experiments. Top to bottom, **P = 0.0024, ****P < 0.0001, ***P = 0.0006, ****P < 0.0001, **P = 0.0031. d, Representative contour plots and cumulative data show frequencies of CD19+IL-10+ B cells within transitional (CD19+CD24hiCD38hi), mature-naive (CD19+CD24intCD38int) and memory (CD19+CD24+CD38lo) gates following stimulation of isolated B cells for 72 h with CpGC, with and without 1 μM rotenone. n = 6 biologically independent samples examined over two independent experiments. ****P < 0.0001. Data were analyzed by one-way ANOVA followed by Tukey’s multiple comparisons test (b,c) or two-way ANOVA followed by Sidak’s test for multiple comparisons (d). Error bars are shown as mean ± s.e.m. Hi, high; Int, intermediate; Lo, low. Panel a created with Biorender.com.
Fig. 2
Fig. 2. High ROS levels impair Breg cell differentiation.
a,b, Histograms and cumulative data show cytoplasmic ROS levels (CELLROX) (a) and mitochondrial ROS levels (MitoSOX) (b) following stimulation of isolated B cells with increasing concentrations of CpGC for 72 h, with paired CD19+IL-10+ B cell frequencies. n = 5 biologically independent samples, examined over two independent experiments. c, Representative contour plots and cumulative data show frequencies of CD19+IL-10+ B cells after stimulation of isolated B cells with 0.1–5 μM CpGC, with and without 1 mM NAC or 10 μM MitoTempo. n = 6 (NAC), n = 4 (MitoTempo) biologically independent samples examined over three independent experiments. In graph order, **P = 0.0053, ***P = 0.0001, **P = 0.0012, ****P < 0.0001, **P = 0.0067, ****P < 0.0001, ***P = 0.0002, ***P = 0.0003. d, Representative contour plots and cumulative data show frequencies of CD19+IL-10+ B cells after stimulation with 0.1 μM or 1 μM CpGC, with and without low (0.2 μM) or high (10 μM) levels of H2O2. n = 3 biologically independent samples, examined over two independent experiments. *P = 0.0384, ***P = 0.0006, *P = 0.0225. Data were analyzed by two-way ANOVA followed by Sidak’s test for multiple comparisons. Error bars are shown as mean ± s.e.m. MFI, median fluorescence intensity.
Fig. 3
Fig. 3. scRNA-seq reveals an enrichment of OXPHOS-associated genes in IL10-expressing B cells.
a, UMAPs showing B cell clusters and phenotypic identities ex vivo (left) and following stimulation for 72 h with CpGC (right). b, Dot plots showing the expression of indicated genes in each subset ex vivo and following CpGC stimulation. c, UMAP and graph showing analysis of genes changing expression along the inferred trajectories through cluster C2 and activated naive into C3 and enriched biological processes. d, UMAP and Venn diagram show common genes upregulated in IL10+ C3 and IL10+ activated naive B cells compared with IL10 B cells in remaining clusters (including transitional, naive, IgM memory, classical memory, double-negative and plasma cells), and genes upregulated in IL10+ B cells within these remaining clusters compared with the IL10 counterpart. e, UMAPs showing B cells scored according to the expression of panels of genes associated with OXPHOS, glycolysis and FAO. Red and high contour density indicate cells with high scores. GO:BP, Gene Ontology:Biological Process.
Fig. 4
Fig. 4. Thioredoxin expression is enriched in IL-10+ Breg cells and requires OXPHOS.
a, UMAP plots show the distribution of TXN+ and TXNIP+ B cells. b, Pseudotemporal gene expression profiles showing the expression levels of TXN and TXNIP with pseudotime within the trajectories seeding C3. c, Representative contour plot, histogram and cumulative data show IL-10 expression following 72-h stimulation with CpGC, and Trx expression and frequencies of CD19+Trx+ B cells within IL-10+ and IL-10 B cell subsets. n = 9 biologically independent samples examined over three independent experiments. ****P < 0.0001. d, Representative contour plots and cumulative data show frequencies of CD19+Trx+IL-10+ B cells following stimulation with CpGC for 72 h with and without 1 μM rotenone. n = 6 biologically independent samples examined over two independent experiments. ***P = 0.001. Data were analyzed by two-tailed paired t-test. Error bars are shown as mean ± s.e.m.
Fig. 5
Fig. 5. Trx is required for Breg cell expansion and suppressive ability.
a, Schematic of the Trx system with the target of D9 and myricetin indicated. b, Representative contour plots and cumulative data show frequencies of CD19+IL-10+ B cells (n = 13 biologically independent samples examined over four independent experiments) and IL-10 secretion (n = 9 biologically independent samples examined over three independent experiments) following culture of B cells with CpGC for 72 h, with and without vehicle control or 100 nM D9. ****P < 0.0001, ****P < 0.0001, ***P = 0.0005, ***P = 0.0007. c, Representative contour plots and graph show frequencies of CD19+IL-10+TNF, CD19+IL-10+TNF+ and CD19+IL-10TNF+ B cells after 72-h culture of isolated B cells with CpGC, with and without D9 or vehicle control. n = 6 biologically independent samples examined over three independent experiments. Left to right, **P = 0.0062, **P = 0.0083, *P = 0.0237, *P = 0.0172. d, Graph showing the levels of secreted TNF by isolated B cells stimulated for 72 h with CpGC, with and without D9 or vehicle control. n = 8 biologically independent samples examined over three experiments. *P = 0.0330. e, Representative contour plots and cumulative data show the frequencies of CD3+CD4+IFNγ+ T cells after co-culture of resting CD4+ T cells stimulated with anti-CD3, with B cells preconditioned with CpGC, CpGC and D9, or CpGC and vehicle control. n = 5 biologically independent samples examined over three independent experiments. Top to bottom, **P = 0.001, *P = 0.0359, *P = 0.0447, **P = 0.0071, *P = 0.0191, *P = 0.0264, *P = 0.0325. f, Representative contour plots and cumulative data showing frequencies of CD19+IL-10+ B cells after CRISPR–Cas9 silencing of TXN and TXNRD1 and culture for 72 h with CpGC. n = 5 biologically independent samples examined over three independent experiments. Top to bottom, **P = 0.0068, **P = 0.0044, **P = 0.0034, **P = 0.0022. Data were analyzed by one-way ANOVA followed by Tukey’s multiple comparisons test (b,d,e,f) or two-way ANOVA followed by Sidak’s test for multiple comparisons (c). Error bars are shown as mean ± s.e.m. Panel a created with Biorender.com.
Fig. 6
Fig. 6. Trx maintains mitochondrial health and low ROS levels.
a, Graphs show real-time Seahorse analysis and basal, ATP-linked, maximal respiration and spare respiratory capacity (SRC) of B cells following 72-h stimulation with CpGC, with and without vehicle control or 100 nM D9. n = 4 biologically independent samples examined over two independent experiments. Left to right, *P = 0.0115, *P = 0.0213, ****P < 0.0001, ****P < 0.0001, ****P < 0.0001, *P = 0.0328, *P = 0.0123, *P = 0.0382, *P = 0.0356. b, Representative contour plots stained with MitoTracker Green (MtG; to assess mitochondrial mass) and MitoTracker Orange (MtOR; its accumulation is dependent upon membrane potential) and graphs show frequencies of B cells with polarized (MtG+MtOR+) and depolarized (MtG+MtOR) mitochondrial membranes within IL-10+Trx+ and IL-10Trx B cell subsets. n = 6 biologically independent samples examined over two independent experiments. Left to right, **P = 0.0035, **P = 0.0021. c, Representative contour plots and graph show frequencies of B cells with polarized (CD19+MtG+MtOR+) and depolarized (CD19+MtG+MtOR) mitochondrial membranes following 24-h stimulation of B cells with CpGC, with and without vehicle control or 100 nM D9. n = 5 biologically independent samples examined over two independent experiments. Top to bottom, *P = 0.0164, *P = 0.0117. d, Confocal images show expression of Trx (red) alongside MtG (green) and MtOR (yellow) staining in B cells stimulated for 72 h with CpGC. e, Representative histograms and cumulative data show levels of cytoplasmic (CELLROX) and mitochondrial (MITOSOX) ROS after 72-h stimulation of isolated B cells with CpGC, with and without D9 or vehicle control. n = 6 biologically independent samples examined over two independent experiments. Left to right, *P = 0.0148, *P = 0.0138, *P = 0.04, *P = 0.0250. Data were analyzed by two-way ANOVA followed by Sidak’s test for multiple comparisons (a), two-sided paired t-test (b) or one-way ANOVA followed by Tukey’s multiple comparisons test (c,e). Error bars are shown as mean ± s.e.m. Ro/AA, rotenone/antimycin A.
Fig. 7
Fig. 7. Exogenous Trx rescues Breg cell deficiencies in SLE.
a, Representative contour plots and cumulative data show frequencies of CD19+IL-10+ B cells in healthy donors (n = 13) and patients with SLE (n = 28) following 72-h stimulation with CpGC. ****P < 0.0001. b, Representative contour plots and cumulative data show frequencies of B cells with polarized (CD19+MtOR+MtG+) and depolarized mitochondria (CD19+MtORMtG+) in healthy controls (n = 10) and patients with SLE (n = 32) following 24-h stimulation with CpGC. ****P < 0.0001. c, Representative histograms and cumulative data show the levels of cytoplasmic ROS (CELLROX) in B cells of healthy donors (n = 10) and patients with SLE (n = 19) after 24-h CpGC stimulation. d, Representative histograms and cumulative data show the levels of mitochondrial ROS (MitoSOX) in B cells of healthy donors (n = 11) and patients with SLE (n = 24) after 24-h CpGC stimulation. ***P = 0.0003. e, Representative contour plots and cumulative data show frequencies of Trx+ B cells in healthy donors (n = 11) and patients with SLE (n = 28) following 72-h stimulation with CpGC. ***P = 0.0004. f, Cumulative data showing correlation between CD19+IL-10+ and CD19+Trx+ B cell frequencies in healthy donors (n = 15) and patients with SLE (n = 26) following 72-h stimulation with CpGC. ****P < 0.0001, R = 0.5821. g, Representative contour plots and cumulative data show frequencies of B cells with polarized (CD19+MtOR+MtG+) and depolarized mitochondria (CD19+MtORMtG+) in healthy donors (n = 10) and patients with SLE (n = 25) following 24-h stimulation with CpGC with and without 100 μM rhTrx. **P = 0.0016, ****P < 0.0001. h, Representative histograms and cumulative data show levels of mitochondrial ROS in B cells of healthy donors (n = 5) and patients with SLE (n = 12) after 24-h CpGC stimulation, with and without 100 μM rhTrx. **P = 0.0019. i, Representative contour plots and cumulative data show frequencies of CD19+IL-10+ B cells (HD n = 14, SLE n = 19) and IL-10 secretion (HD n = 11, SLE n = 16) in healthy donors and patients with SLE following 72-h stimulation with CpGC, with and without 100 μM rhTrx. Left to right, ****P < 0.0001, ****P < 0.0001, ***P = 0.0007, ***P = 0.0006. Data were analyzed by two-tailed unpaired t-test (ae), two-tailed Pearson correlation (f) or two-way ANOVA followed by Sidak’s test for multiple comparisons (gi). Error bars are shown as mean ± s.e.m. HD, healthy donor.
Extended Data Fig. 1
Extended Data Fig. 1. Glutamine and ETC activity are required for the differentiation of IL-10+Breg cells.
a-d, Representative contour plots and cumulative data show frequencies of CD19+IL-10+ B cells after 72h CpGC stimulation when cultured (a) in the presence of 10mM Malonyl co-A, (b) in glucose-free media or glucose-free media replenished with glucose, (c) in the presence of 5mM galactose (***P = 0.0005), (d) in the absence of glutamine or glutamine-free media replenished with glutamine (***P = 0.0001, **P = 0.0022). (b,c,d) n = 6 biologically independent samples examined over 2 independent experiments, (a) n = 3 biologically independent samples examined over 2 independent experiments. e, Cumulative data showing percentage of live cells within CD19+B cells after 72h CpGC stimulation with and without metabolism inhibitors. n = 6 biologically independent samples examined over 2 independent experiments. f, Representative histograms and cumulative data show frequencies of CD19+IL-10+ B cells after 72h stimulation with CpGC, TLR7 ligand R848, TLR4 ligand LPS, aBCR, CD40L, or IL-21, with and without rotenone or antimycin A. n = 3 biologically independent samples examined over 2 independent experiments (left to right) **P = 00025, ***P = 0.0002, *P = 0.0179, *P = 0.0139, *P = 0.0372. Data analysed by (c) two-sided paired t-test, (d) one-way ANOVA followed by Tukey’s multiple comparison test, (f) two-way ANOVA followed by Sidak’s test for multiple comparisons. Error bars are shown as mean±SEM.
Extended Data Fig. 2
Extended Data Fig. 2. Electron transport chain regulate the induction of immunoregulatory cytokines expressed by Breg cells.
a-e, Representative contour plots and cumulative data show frequencies of (a) CD19+IL-10+IL-35, CD19+IL-10+IL-35+, CD19+IL-10IL-35+ B cells (left to right; **P = 0.0018, *P = 0.0255, **P = 0.0025, ****P < 0.0001, **P = 0.0042, **P = 0.0014) (b) CD19+IL-10+TGFb-, CD19+IL-10+TGFb+ and CD19+IL-10TGFb+ B cells, (left to right; **P = 0.006, ***P = 0.0007, *P = 0.042, **P = 0.0044, *P = 0.043 (c) CD19+IL-10+TNF, CD19+IL-10+TNF+ and CD19+IL-10TNF+ B cells (left to right; **P = 0.0052, **P=0.0053, *P = 0.0134, *P = 0.0419), (d) CD19+IL-10+IL-6, CD19+IL-10+IL-6+, CD19+IL-10IL-6+ B cells (left to right; *P = 0.0278, ***P = 0.0005, *P=0.0174, *P = 0.0411), and (e) CD19+IL-10+GM-CSF, CD19+IL-10+GM-CSF+ and CD19+IL-10GM-CSF+ B cells (left to right; *P = 0.0204, **P = 0.0063, *P = 0.0124) after 72h CpGC stimulation of isolated B cells with and without rotenone or antimycin A. CD19+IL-35+ B cells were identified as Ebi3+p35+. (a,b,c,d) n = 5 biologically independent samples examined over 2 independent experiments, (e) n = 3 biologically independent samples examined over 2 independent experiments. f, Representative contour plots and cumulative data show frequencies of CD19+IL-10+B cells following 72h stimulation of sorted ex vivo transitional, naïve-mature and memory subsets with CpGC, with and without 1mM rotenone. n = 6 biologically independent samples examined over 2 independent experiments, ***P = 0.0010, *P = 0.0108, **P = 0.0018. Data analyzed by two-way ANOVA followed by Sidak’s test for multiple comparisons. Error bars are shown as mean±SEM.
Extended Data Fig. 3
Extended Data Fig. 3. Inhibition of OXPHOS impairs plasma cell differentiation.
a-b, Representative contour plots and cumulative data show frequencies of (a) transitional (CD19+CD24hiCD38hi), mature-naïve (CD19+CD24intCD38int), memory (CD19+CD24+CD38lo) B cells and (b) plasmablasts (CD19+CD24lo/−CD38hiBlimp1+) following stimulation of isolated B cells for 72h with CpGC, with and without 1mM 2-DG, 10mM etomoxir, 500nM BPTES or 1mM rotenone. n = 6 biologically independent samples examined over 2 independent experiments. (a - left to right) ***P = 0.0005, *P = 0.0251, *P = 0.0242, **P = 0.0077, *P = 0.0108, **P = 0.0076, ***P = 0.0001, *P = 0.0120, ***P = 0.0007, *P = 0.0488, (b – left to right) ****P < 0.0001, ***P = 0.0001, **P = 0.0081, ****P < 0.0001, *P = 0.0378. c-d, Representative contour plots and cumulative data show frequencies of (c) transitional (CD19+CD24hiCD38hi), mature-naïve (CD19+CD24intCD38int), memory (CD19+CD24+CD38lo) B cells (**P = 0.0037, ***P = 0.0001) and (d) plasmablasts (CD19+CD24lo/−CD38hiBlimp1+) (**P = 0.005) following stimulation of isolated B cells for 72h with CpGC, with and without 10nM Antimycin A. (c) n = 5 biologically independent samples examined across 2 independent experiments. (d) n = 3 biologically independent samples examined over 2 independent experiments. e-f, Representative contour plots and cumulative data show frequencies of (e) transitional (CD19+CD24hiCD38hi), mature-naïve (CD19+CD24intCD38int), memory (CD19+CD24+CD38lo) B cells (left to right; **P = 0.0027, **P = 0.0044, ***P = 0.0003) and (f) plasmablasts (CD19+CD24lo/−CD38hiBlimp1+) (**P = 0.0097, ***P = 0.0008) following stimulation of isolated B cells for 72h with CpGC, in glucose-free RPMI or glucose-free RPMI supplemented with glucose, glutamine-free RPMI supplemented with glutamine, or galactose. n = 6 biologically independent samples examined over 2 independent experiments. Data analysed by (a,b,e,f) one-way ANOVA followed by Tukey’s multiple comparisons test, (c) two-way ANOVA followed by Sidak’s test for multiple comparisons, or (d) two-sided paired t-test. Error bars are shown as mean±SEM.
Extended Data Fig. 4
Extended Data Fig. 4. Elevated cellular ROS results in a reduced IL-10+Breg cell to IL-10negativeplasmablast ratio.
a, Cumulative data showing the levels of mitochondrial ROS (MitoROS) in B cells after 24h CpGC stimulation with and without rotenone. n = 5 biologically independent samples examined over 2 independent experiments, *P = 0.0136. b, Representative contour plots and cumulative data showing frequencies of CD19+IL-10+B cells following stimulation of isolated B cells with increasing concentrations of CpGC for 72h. n = 5 biologically independent samples examined over 2 independent experiments. (top to bottom) ****P < 0.0001, ***P = 0.0005, *P = 0.0294, ***P = 0.0005, **P = 0.0064, *P = 0.0122, **P = 0.0012, *P = 0.0117, *P = 0.0218, **P = 0.0087. c, Representative contour plots and cumulative data show frequencies of CD19+IL-10+B cells within transitional (CD19+CD24hiCD38hi), mature-naïve (CD19+CD24intCD38int), memory (CD19+CD24+CD38lo) B cells and plasmablasts (CD19+CD24lo/-CD38hiBlimp1+) following stimulation of isolated B cells for 72h with 1mM or 5mM CpGC. n = 6 biologically independent samples examined over 2 independent experiments. (left to right, top to bottom) **P = 0.0025, **P = 0.0024, *P = 0.0209, ***P = 0.0006, **P = 0.0011, **P = 0.0059, *P = 0.0112, **P = 0.0035, *P = 0.0291, ***P = 0.0002, *P = 0.0284, *P = 0.0326. d, Cumulative data showing the ratio of CD19+IL-10+Bregs to CD19+CD24lo/−CD38hiBlimp1+ plasmablasts after stimulation of B cells with 1mM or 5mM CpGC for 72h. n = 5 biologically independent samples examined over 2 independent experiments. ****P < 0.0001, ***P = 0.0003. e, Histograms and cumulative data show the levels of cytoplasmic ROS (CELLROX) after stimulation of B cells with 0.1–5mM CpGC, with and without 1mM NAC. n = 6 biologically independent samples examined over 2 independent experiments. ***P = 0.0009, **P = 0.0017, *P = 0.01, ****P < 0.0001. f, Cumulative data shows the levels of mitochondrial ROS after stimulation of B cells with 0.1–5mM CpGC, with and without 1mM NAC. n = 4 biologically independent samples examined over 2 independent experiments. g, Histograms and cumulative data show the levels of mitochondrial ROS after stimulation of B cells with 0.1–5mM CpGC, with and without 10mM MitoTempo. n = 3 biologically independent samples examined over 2 independent experiments. *P = 0.0346, *P = 0.0477, **P = 0.0035, ***P = 0.0002. Data analysed by (a) two-sided paired t-test, (b-d) one-way ANOVA followed by Tukey’s multiple comparisons test, or (e,g) two-way ANOVA followed by Sidak’s test for multiple comparisons. Error bars are shown as mean±SEM.
Extended Data Fig. 5
Extended Data Fig. 5. B cells expressing high levels of IL-10 express high levels of Trx. Trx expression does not rely on glycolysis, fatty acid oxidation or glutamine metabolism and its expression mirrors that of IL-10 following different stimuli.
a, Dotplots showing expression of other cytokines and immunoregulatory markers in (left) ex vivo B cells and (right) B cell clusters after CpGC stimulation. b, UMAP and violin plot show sub-clustering of plasmablasts/plasma cells and associated expression of IL10. c, Graph shows the expression levels of TXN and TXNIP with pseudotime within trajectories seeding classical memory, IgM memory and double negative B cell subsets. d, Graph showing frequencies of CD19+IL-10+Trx+B cells following 72h culture with different stimuli. n = 3 biologically independent samples examined over 2 independent experiments. e, Dotplot showing average and percentage expression of TXN2, and TXNRD2 in CpGC-stimulated B cell clusters. f, Representative contour plots and cumulative data show frequencies of CD19+Trx2+B cells in B cells stimulated with and without CpGC for 72h. n = 6 biologically independent samples examined over 2 independent experiments. *P = 0.0448, by two-sided paired t-test. g, Representative histogram and cumulative data show frequencies of CD19+Trx2+B cells within respectively IL-10+ and IL-10-B cell subsets after 72h CpGC stimulation. n = 5 biologically independent samples examined over 2 independent experiments. h, Cumulative data show frequencies of CD19+Trx+IL-10+B cells following stimulation of isolated B cells with CpGC with and without 1mM 2-DG, 10mM etomoxir or 500nM BPTES for 72h. n = 6 biologically independent samples examined over 2 independent experiments. Error bars are shown as mean±SEM.
Extended Data Fig. 6
Extended Data Fig. 6. Trx inhibition suppresses TGFb, IL-35 and PD-L1 expression by B cells, increases IL-6 secretion.
a, Representative contour plots and cumulative data show frequencies of CD19+IL-10+B cells and IL-10 secretion following stimulation of isolated B cells with CpGC with and without 10mM of the TrxR inhibitor myricetin. n = 8 biologically independent samples examined over 3 independent experiments. (left to right) **P = 0.0027, **P = 0.0056. b, Cumulative data show frequencies of live cells within CD19+ B cells after stimulation of B cells with CpGC, with and without D9, vehicle control, or myricetin. c, Representative contour plots and cumulative data show frequencies of CD19+Ki67+B cells following stimulation of isolated B cells with CpGC with and without 100nM D9 or vehicle control. n = 8 biologically independent samples examined over 3 independent experiments. d-f, Representative contour plots and cumulative data show frequencies of (d) CD19+IL-10+TGFb-, CD19+IL-10+TGFb+ and CD19+IL-10-TGFb- B cells (left to right) *P = 0.0119, *P = 0.0208, **P = 0.0049, *P = 0.0264, (e) PD-L1+ B cells (top to bottom) **P = 0.003, ****P < 0.0001, **P = 0.0017, ****P < 0.0001, **P = 0.0011, and (f) CD19+IL-10+IL-35-, CD19+IL-10+IL-35+ and CD19+IL-10IL-35+ B cells (left to right) *P = 0.0184, *P = 0.0245, *P = 0.0296, following 72h CpGC stimulation of isolated B cells with and without D9 or vehicle control. (d) n = 5 biologically independent samples examined over 2 independent experiments, (e) n = 9 biologically independent samples examined over 3 independent experiments, (f) n = 6 biologically independent samples examined over 2 independent experiments. g,h, Representative contour plots and graphs show (g) the frequencies of CD19+IL-10+IL-6, CD19+IL-10+IL-6+, and CD19+IL-10IL-6+ B cells (left to right) **P = 0.0096, *P = 0.0189, *P = 0.0126, *P = 0.0223, and (h) IL-6 secretion (top to bottom) **P = 0.001, **P = 0.0031, following 72h CpGC stimulation of isolated B cells with and without D9 or vehicle control. n = 5 biologically independent samples examined over 2 independent experiments. i, Cumulative data showing frequencies of CD19+IL-10+B cells and IL-10 secretion following 72h stimulation of isolated B cells with CpGC alone, or CD40L, IFNa, anti-BCR either alone or in combination with CpGC, with and without 100nM D9. n = 3 biologically independent samples examined over 2 independent experiments. (left to right) **P = 0.0042, **P = 0.0026, **P = 0.0078, ***P = 0.0007, ****P < 0.0001, ****P < 0.0001. Data analyzed by (a) two-sided paired t-test, (e,h) one-way ANOVA followed by Tukey’s test for multiple comparisons, (d,f,g,i) or two-way ANOVA followed by Sidak’s test for multiple comparisons. Error bars are shown as mean±SEM.
Extended Data Fig. 7
Extended Data Fig. 7. Trx system inhibition expands CD24lo/−CD38hiBlimp1+ plasmablasts and inhibits IL-10+Breg cell differentiation.
a-b, Representative contour plots and cumulative data show (a) frequencies of CD19+CD24hiCD38hi (immature), CD19+CD24intCD38int (mature naïve), CD19+CD24+CD38lo (memory) B cells (**P = 0.0022, **P = 0.0018) and (b) CD19+CD24lo/-CD38hiBlimp1+ plasmablasts (**P = 0.0014) following 72h stimulation of isolated B cells with CpGC, with and without vehicle control or 100nM D9. n = 6 biologically independent samples examined over 2 independent experiments. c, Cumulative data show frequencies of IL-10+B cells within CD19+CD24hiCD38hi (immature), CD19+CD24intCD38int (mature naïve), CD19+CD24+CD38lo (memory) B cells and CD19+CD24lo/−CD38hi plasmablasts following 72h stimulation of isolated B cells with CpGC, with and without vehicle control or 100nM D9. (left to right, top to bottom) **P = 0.0061, **P = 0.0042, ***P = 0.0006, **P = 0.0031, **P = 0.0018, *P = 0.0208, *P = 0.03, **P = 0.0094. n = 6 biologically independent samples examined over 2 independent experiments. d, Representative contour plots and cumulative data show frequencies of CD19+Trx+ B cells after CRISPR/Cas9 silencing of TXN and culture for 72h with CpGC. ****P < 0.0001. n = 5 biologically independent samples examined over 2 independent experiments. e-f, Representative contour plots and cumulative data show frequencies of CD19+IL-10+ B cells after CRISPR/Cas9 silencing of (d) TXN2 and (e) TXNRD2 and culture for 72h with CpGC. n = 3 biologically independent samples examined over 2 independent experiments. Data analyzed by one-way ANOVA followed by Tukey’s test for multiple comparisons. Error bars are shown as mean±SEM.
Extended Data Fig. 8
Extended Data Fig. 8. Silencing TXN results in mitochondrial membrane depolarisation and increased levels of cytoplasmic and mitochondrial ROS.
a, Graph shows extracellular acidification rate (ECAR) of B cells following stimulation with CpGC, with and without vehicle control or 100nM D9. n = 4 biologically independent samples examined over 2 independent experiments. b, Representative contour plots stained with MitoTracker Green (MtG: to assess mitochondrial mass) and MitoTracker Orange (MtOR: its accumulation is dependent upon membrane potential) and graph show frequencies of B cells with depolarized (CD19+MtG+MtOR) mitochondrial membranes following CRISPR/Cas9 silencing of TXN and 24h stimulation of B cells with CpGC, with and without vehicle control or 100nM D9. (top to bottom) *P = 0.0154, *P = 0.0324. n = 3 biologically independent samples examined over 2 independent experiments. c, Confocal images show expression of Trx (red) alongside MtG (green) and MtOR (yellow) staining in B cells stimulated for 72h with CpGC. d,e, Histograms and cumulative data show the levels of (d) cytoplasmic (CELLROX) ROS (*P = 0.0126, *P = 0.0231) and (e) mitochondrial (MitoSOX) ROS (top to bottom - *P = 0.0406, *P = 0.0437) in B cells after CRISPR/Cas9 silencing of TXN and CpGC stimulation for 24h. n = 3 biologically independent samples examined over 2 independent experiments. Data analyzed by one-way ANOVA followed by Tukey’s test for multiple comparisons. Error bars are shown as mean±SEM.
Extended Data Fig. 9
Extended Data Fig. 9. B cells, but not other immune-cells, from SLE patients display reduced IL-10+Breg cells and depolarised mitochondrial membranes when stimulated with R848 or low-dose CpGC.
a, Cumulative data showing the levels of cytoplasmic (CELLROX) and mitochondrial ROS (MitoSOX) in ex vivo B cells of SLE patients and healthy donors (HD). (CELLROX – SLE n = 10, HD n = 6, MITOSOX – SLE n = 9, HD n = 5) **P = 0.0051. b-c, Representative contour plots and cumulative data showing frequencies of B cells with depolarised mitochondrial membranes (CD19+MtG+MtOR) from SLE patients and healthy donors after 72h stimulation with (b) 0.1mM CpGC (SLE n = 8, HD n = 5) (*P = 0.0197) or (c) TLR7 ligand R848 (SLE n = 7, HD n = 5) (***P = 0.0004). d-e, Representative contour plots and cumulative data showing frequencies of CD19+IL-10+ B cells from SLE patients and healthy donors after 72h stimulation with (d) 0.1mM CpGC (SLE n = 8, HD n = 8) (*P = 0.0439) or (e) the TLR7 ligand R848 (SLE n = 9, HD n = 8) (*P = 0.0357). f, Cumulative data show the frequencies of Trx+ cells within different immune cell subsets following 72h CpGC stimulation of SLE patient (n = 3) or healthy donor (n = 3) PBMCs (****P < 0.0001). g, Cumulative data showing frequencies of CD19+MtG+MtOR- (****P < 0.0001) and CD19+Trx+B cells (***P = 0.0001, *P = 0.0439, *P = 0.0345) in SLE patients with active disease (BILAG global score (GS) over or equal to 5, n = 13) and inactive (BILAG GS < 5) disease, compared to healthy donors (CD19+MtG+MtOR-; HD n = 13, active SLE n = 12, inactive SLE n = 18, CD19+Trx+; HD n = 11, active SLE n = 12, inactive SLE n = 20). h-i, Cumulative data showing frequencies of (h) CD19+MtG+MtOR (n = 22) and (i) CD19+Trx+B cell frequencies in SLE patients (n = 26) treated with hydroxychloroquine (HCQ), prednisolone (Pred), methotrexate (MTX), mycophenolate mofetil (MMF) or azathioprine (Aza). j, Contour plots show the intracellular presence of FITC-conjugated recombinant human Trx (rhTrx) in B cells after 72h culture with CpGC and exogenous FITC-rhTrx. Data analyzed by (a-e) two-sided unpaired t-test, (f) two-way ANOVA followed by Sidak’s test for multiple comparisons, or (g) one-way ANOVA followed by Tukey’s test for multiple comparisons. Error bars are shown as mean±SEM.
Extended Data Fig. 10
Extended Data Fig. 10. Exogenous Trx expands IL-10+Breg cells within all B cell subsets in SLE patients and rescues Mitochondrial Membrane Polarization and IL-10+Breg cells in SLE patient lymph node B cells.
a, Cumulative data showing frequencies of IL-10+B cells within CD24hiCD38hi (immature), CD24intCD38int (mature naïve), CD24+CD38lo (memory) B cells and CD24lo/-CD38hi plasmablasts in healthy donors (n = 11) and SLE patients (n = 20) following 72h stimulation of isolated B cells with CpGC, with and without 100mM recombinant human thioredoxin (rhTrx). (left to right) ***P = 0.0002, ***P = 0.0003, ***P = 0.0004, **P = 0.00068, ***P = 0.0009, ***P = 0.0009. b, Cumulative data showing frequencies of IL-10+ and IL-10 CD24lo/−CD38hi plasmablasts (as a frequency of total CD19+B cells) in healthy donors (n = 11) and SLE patients (n = 20) following 72h stimulation of isolated B cells with CpGC with and without 100mM rhTrx. *P = 0.0152, ***P = 0.0002. c-d, Representative contour plots and graph show (c) frequencies of B cells with polarized (MtOR+MtG+) and depolarized mitochondria (MtORMtG+) (*P = 0.0476) and (d) frequencies of IL-10+B cells (*P = 0.0114) isolated from lymph nodes of SLE patients (n = 4) and non-autoimmune donors (Control) (n = 3), following 24h stimulation with CpGC, with and without 100mM rhTrx. Data analyzed by two-way ANOVA followed by Sidak’s test for multiple comparisons.

Similar articles

Cited by

References

    1. Rosser EC, Mauri C. Regulatory B cells: origin, phenotype, and function. Immunity. 2015;42:607–612. doi: 10.1016/j.immuni.2015.04.005. - DOI - PubMed
    1. Mauri C, Bosma A. Immune regulatory function of B cells. Annu. Rev. Immunol. 2012;30:221–241. doi: 10.1146/annurev-immunol-020711-074934. - DOI - PubMed
    1. Blair PA, et al. CD19+CD24hiCD38hi B cells exhibit regulatory capacity in healthy individuals but are functionally impaired in systemic lupus erythematosus patients. Immunity. 2010;32:129–140. doi: 10.1016/j.immuni.2009.11.009. - DOI - PubMed
    1. Menon M, Blair PA, Isenberg DA, Mauri C. A regulatory feedback between plasmacytoid dendritic cells and regulatory B cells is aberrant in systemic lupus erythematosus. Immunity. 2016;44:683–697. doi: 10.1016/j.immuni.2016.02.012. - DOI - PMC - PubMed
    1. Olkhanud PB, et al. Tumor-evoked regulatory B cells promote breast cancer metastasis by converting resting CD4+ T cells to T-regulatory cells. Cancer Res. 2011;71:3505–3515. doi: 10.1158/0008-5472.CAN-10-4316. - DOI - PMC - PubMed

Publication types