. 2024 Mar 29;29(1):45.
doi: 10.1186/s11658-024-00559-9.

Effects of mifepristone on adipocyte differentiation in mouse 3T3-L1 cells

Affiliations

Effects of mifepristone on adipocyte differentiation in mouse 3T3-L1 cells

Takeshi Hashimoto et al. Cell Mol Biol Lett. .

Abstract

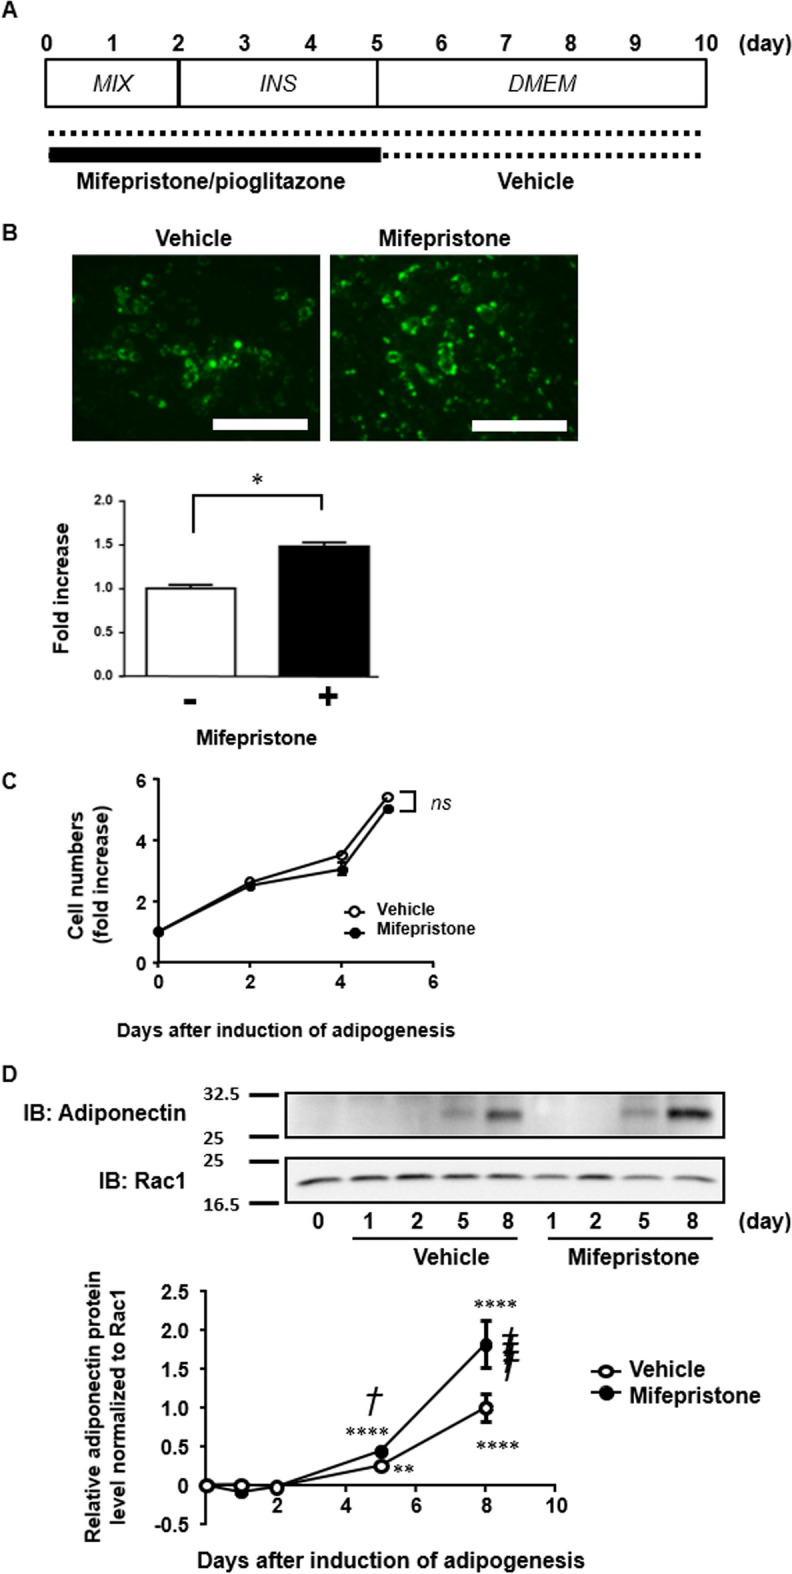
Background: Both glucocorticoid receptor and peroxisome proliferator-activated receptor-γ (PPARγ) play a critical role in adipocyte differentiation. Mifepristone is not only an antagonist of the glucocorticoid receptor but also an agonist of PPARγ. Therefore, the present study investigated the effect of mifepristone on adipocyte differentiation.

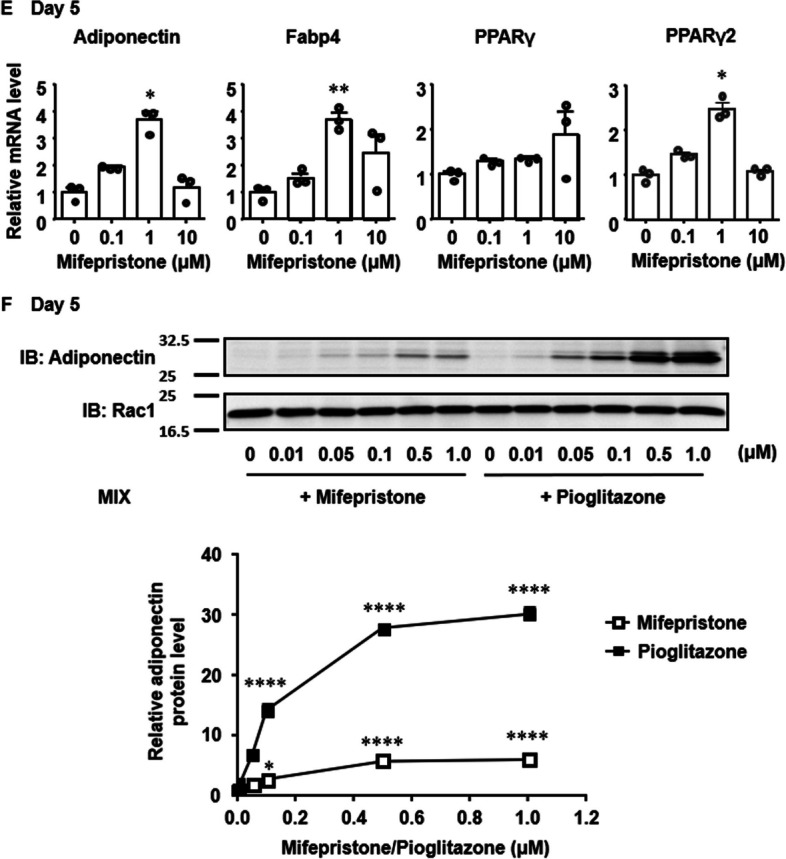
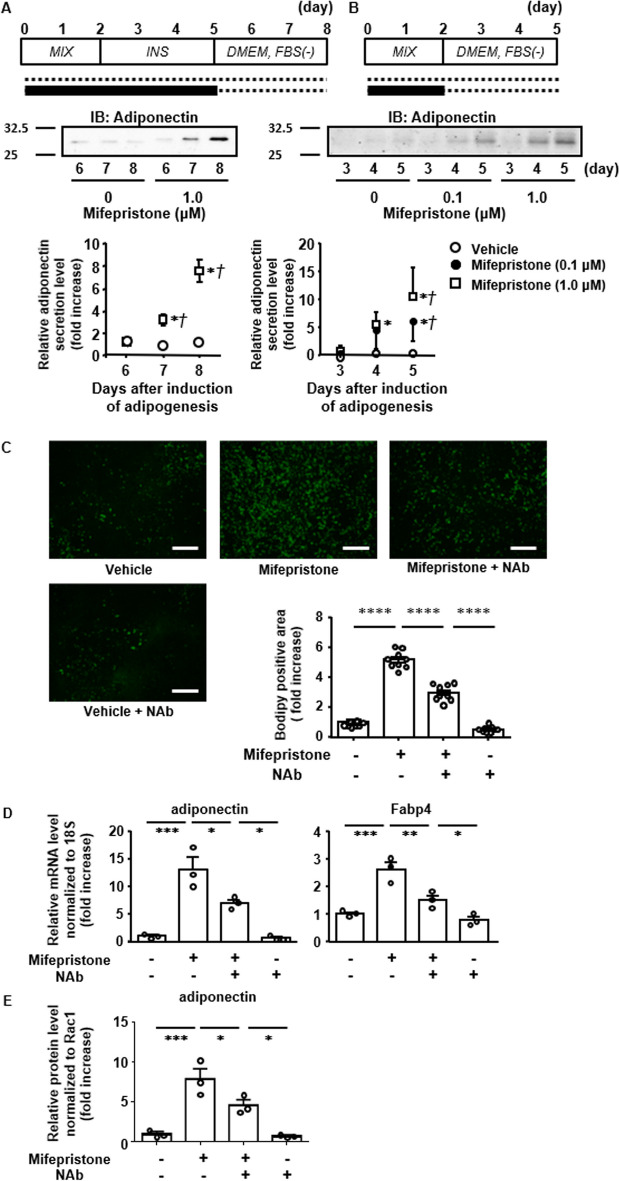
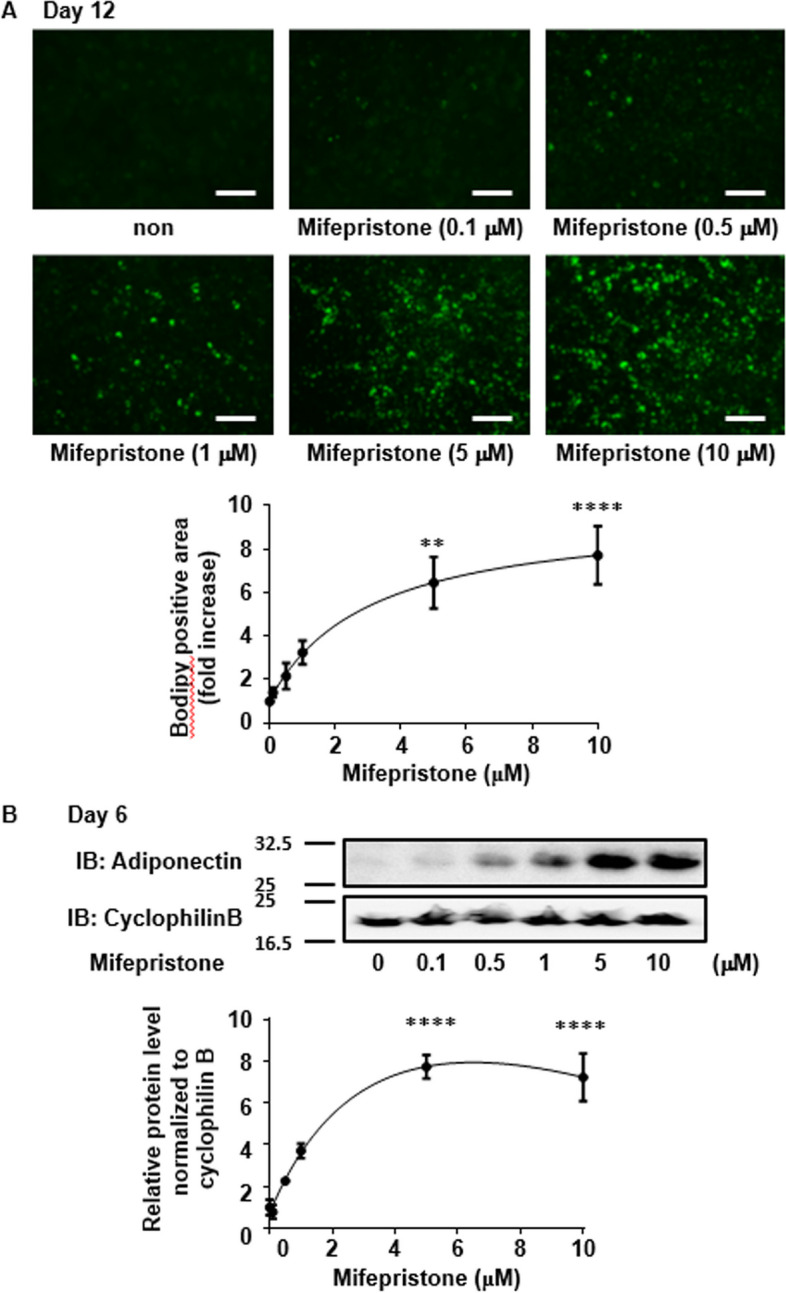
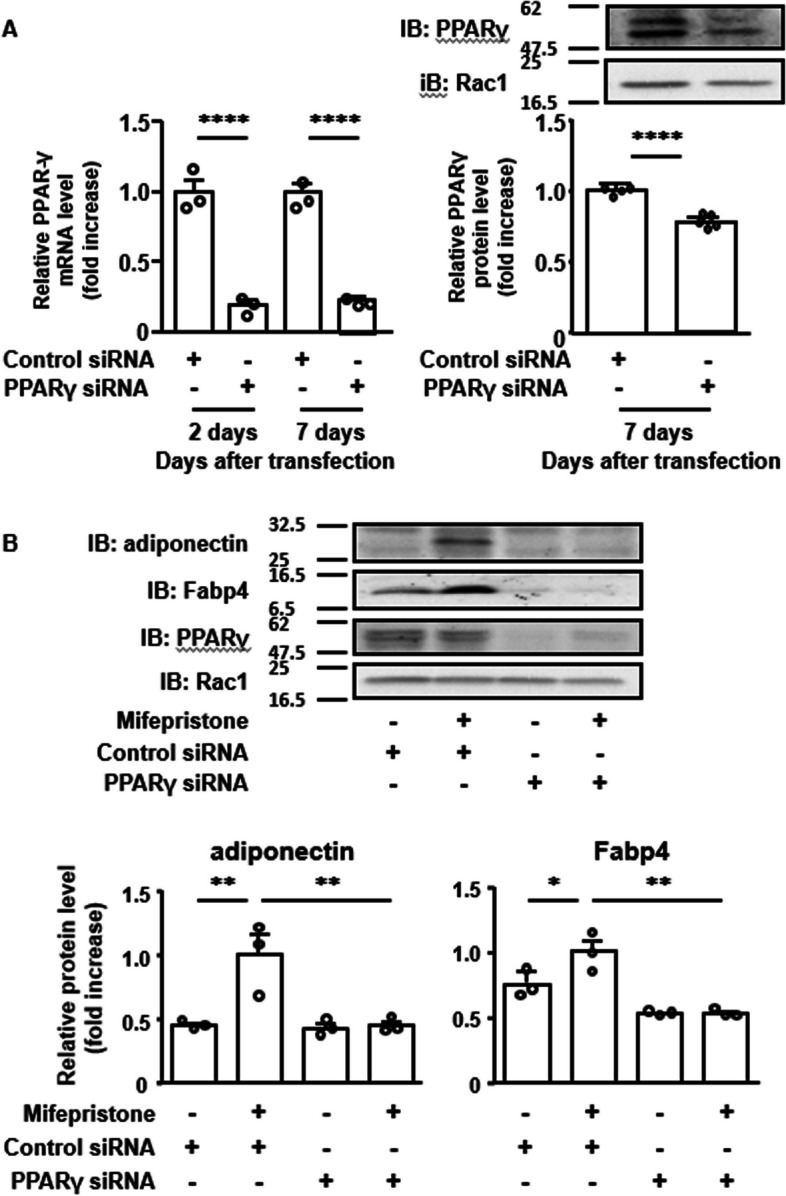
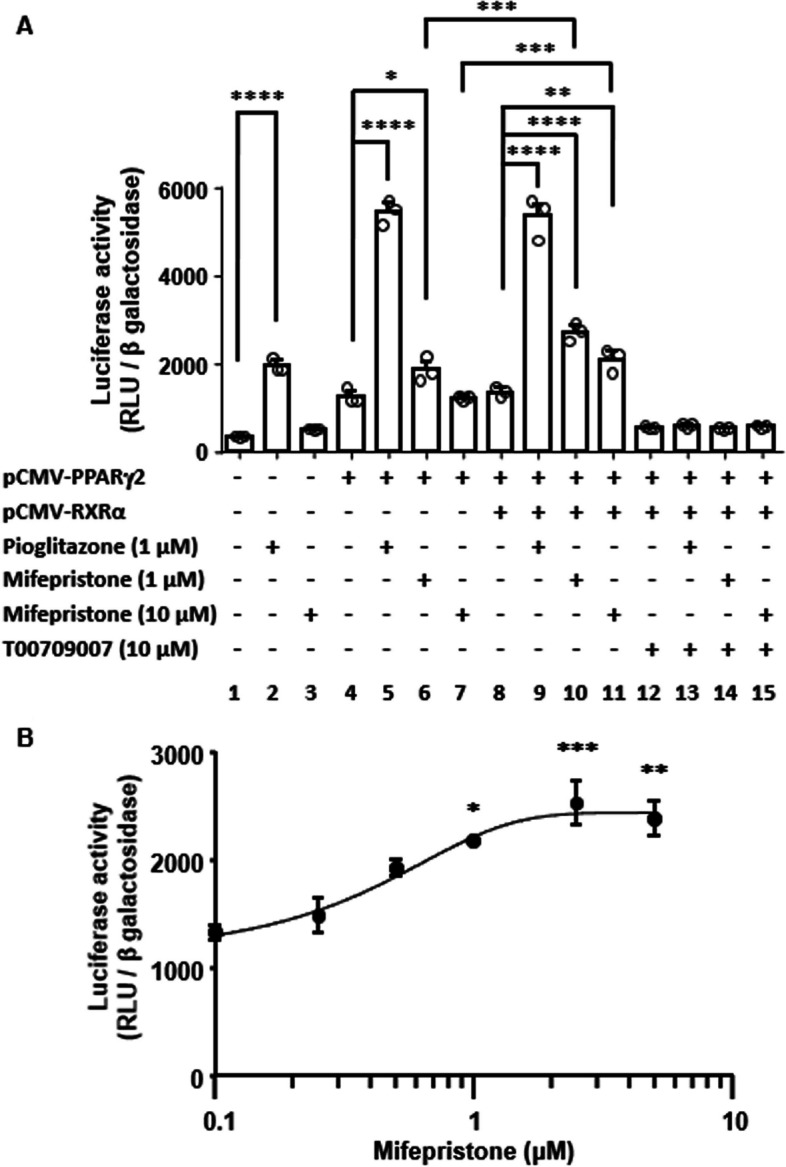
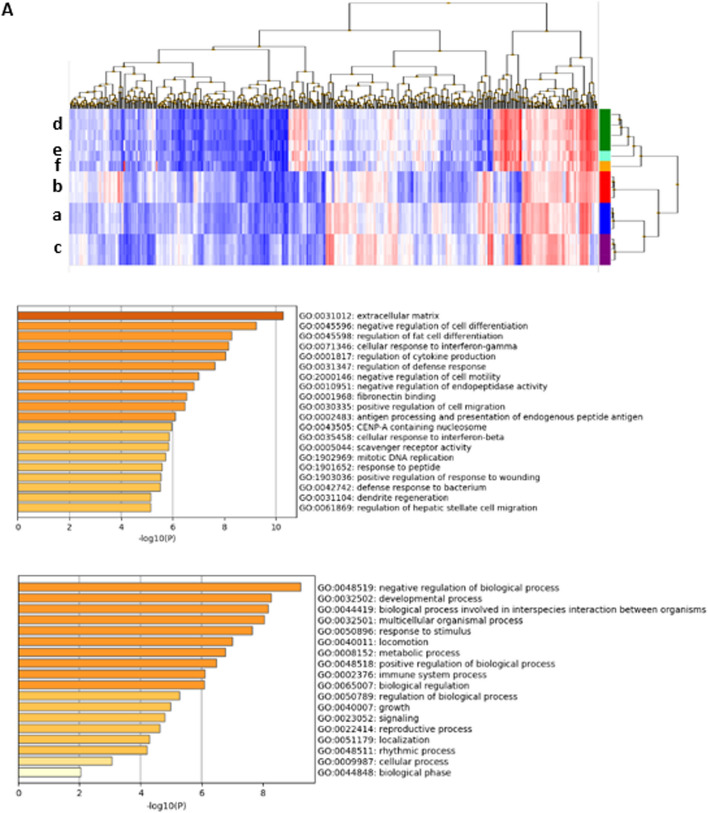
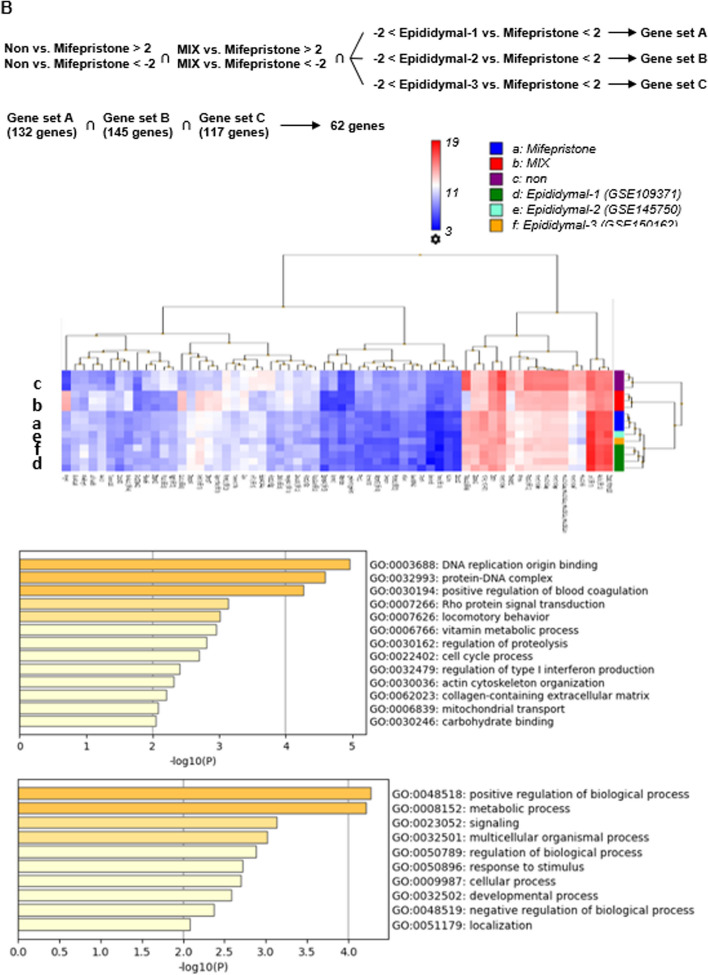
Methods: Mouse 3T3-L1 cells were used as a model for adipocyte differentiation. The lipid droplet formation was evaluated with Bodipy493/503 staining and the expression of adipocyte markers [adiponectin and adipocyte fatty acid binding protein-4 (Fabp4)] was evaluated with quantitative PCR and immunoblot analyses for indication of adipocyte differentiation. siRNA and neutralizing antibodies were used to elucidate the molecular mechanism of mifepristone-induced adipocyte differentiation. Luciferase reporter assay was used to examine the effect of mifepristone on the promoter activity of PPAR-response element (PPRE). The DNA microarray analysis was used to characterize the transcriptome of the mifepristone-induced adipocytes. In vivo adipogenic effect of mifepristone was examined in mice.

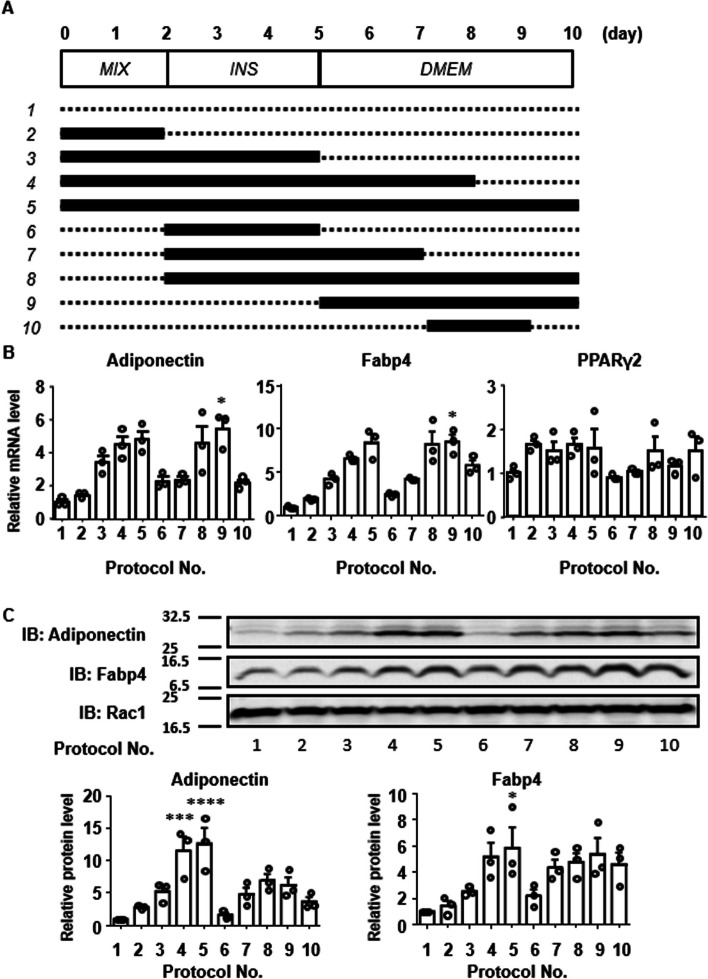
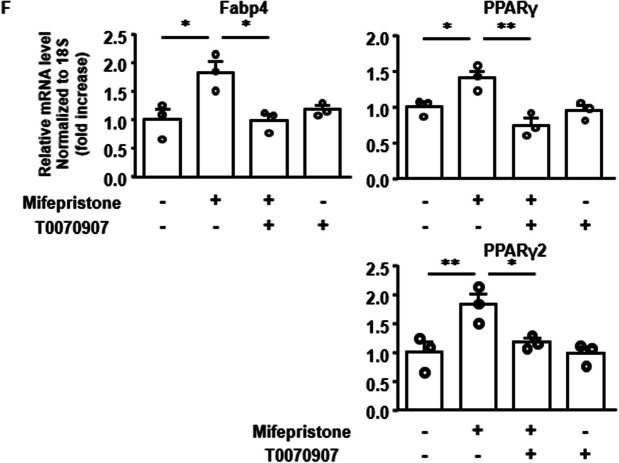
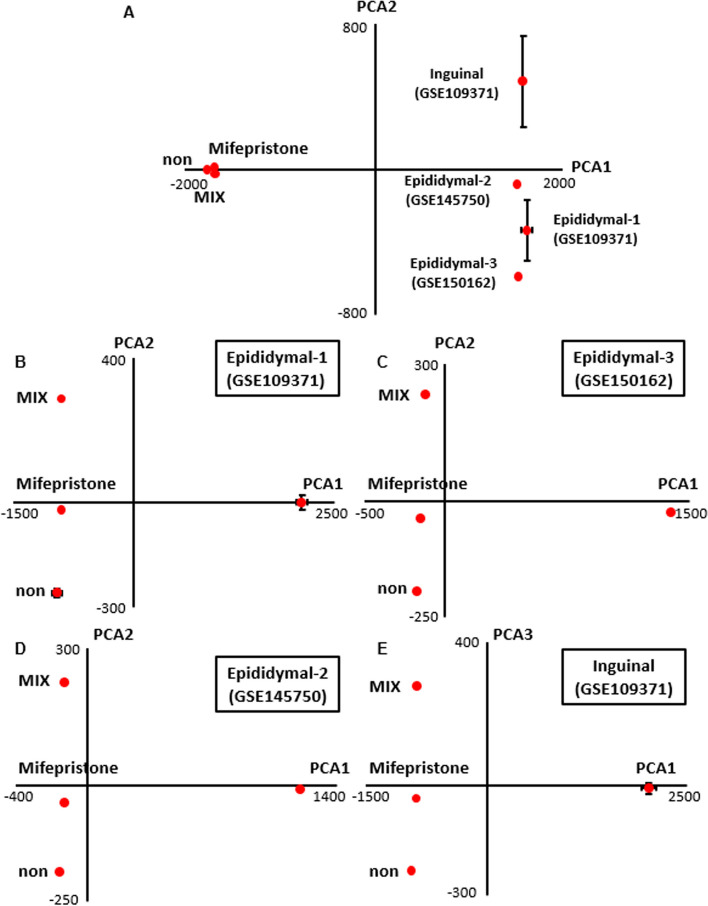
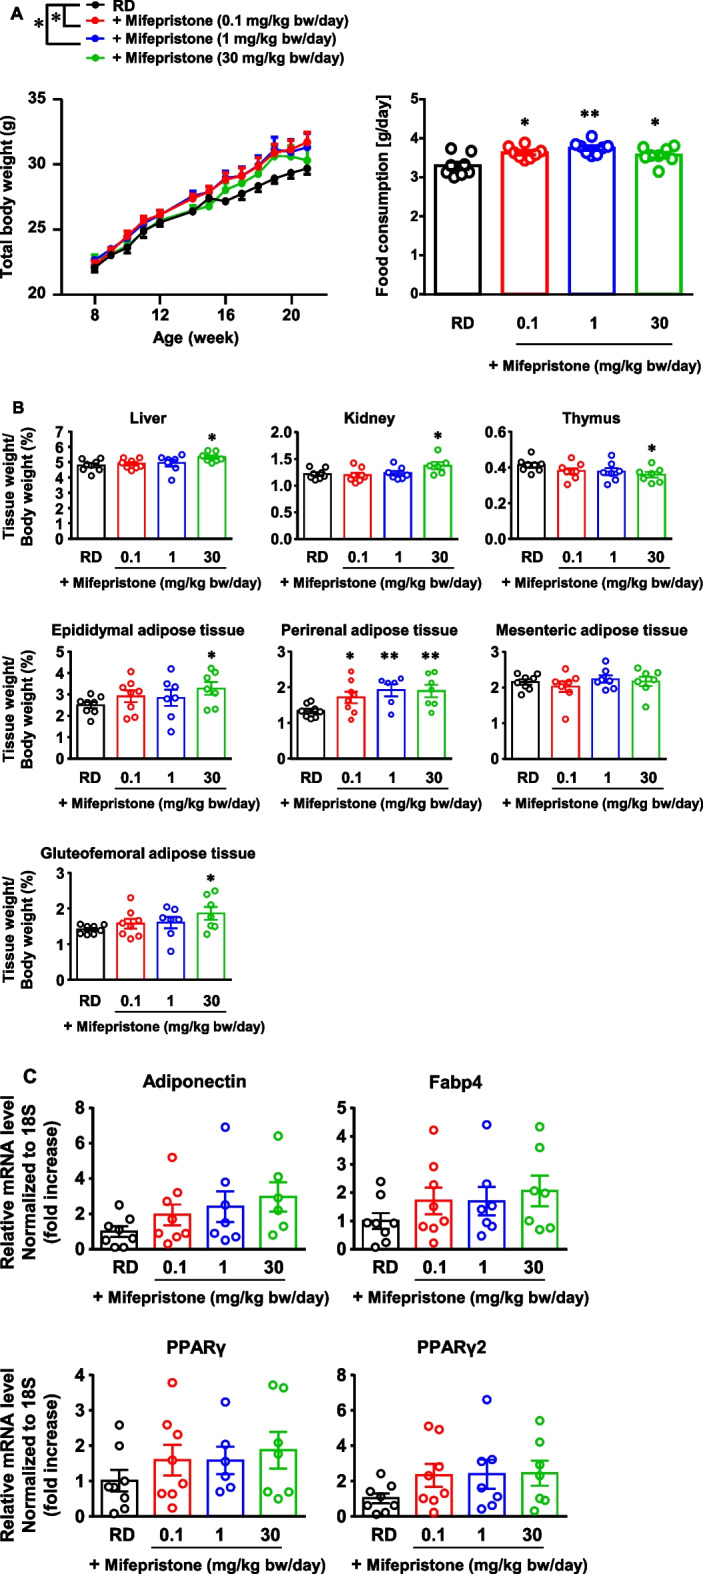
Results: Mifepristone not only enhanced adipocyte differentiation induced by the conventional protocol consisting of insulin, dexamethasone and 3-isobutyl-1-methylxanthine but also induced adipocyte differentiation alone, as evidenced by lipid droplets formation and induction of the expression of adiponectin and Fabp4. These effects were inhibited by an adiponectin-neutralizing antibody and a PPARγ antagonist. Mifepristone activated the promoter activity of PPRE in a manner sensitive to PPARγ antagonist. A principal component analysis (PCA) of DNA microarray data revealed that the mifepristone-induced adipocytes represent some characteristics of the in situ adipocytes in normal adipose tissues to a greater extent than those induced by the conventional protocol. Mifepristone administration induced an increase in the weight of epididymal, perirenal and gluteofemoral adipose tissues.

Conclusions: Mifepristone alone is capable of inducing adipocyte differentiation in 3T3-L1 cells and adipogenesis in vivo. PPARγ plays a critical role in the mifepristone-induced adipocyte differentiation. Mifepristone-induced adipocytes are closer to the in situ adipocytes than those induced by the conventional protocol. The present study proposes a single treatment with mifepristone as a novel protocol to induce more physiologically relevant adipocytes in 3T3-L1 cells than the conventional protocol.

Keywords: Adipocyte differentiation; Mifepristone; Neutralizing antibodies; PPARγ; siRNA.


Conflict of interest statement

The authors declare no competing interests in association with the present study.

Figures

Fig. 1
Fig. 1
Augmentation by mifepristone of upregulation of adiponectin expression during adipocyte differentiation in 3T3-L1 cells. A The experimental protocol used to examine the effect of treatment with vehicle (dotted line) and either mifepristone or pioglitazone (solid line) during the differentiation of 3T3-L1 cells to adipocytes. Adipocyte differentiation was induced as described in the Materials and Methods. MIX, the period of incubation with the first differentiation medium, containing 4.5 g/L D-glucose, 1 µg/mL insulin, 1 µM dexamethasone and 0.5 mM IBMX in the standard culture media. INS, the period of incubation with the second differentiation medium, consisting of 4.5 g/L D-glucose and 1 µg/mL insulin in the standard culture media. DMEM, the period of incubation with the standard culture media. B Representative microscopic images of Bodipy staining and summaries (n = 6) of the quantification on day 10 after induction of adipogenesis. Scale bar, 600 µm. C The time-dependent changes in the cell count during adipogenesis with and without 1 µM mifepristone. D Representative immunoblot images and summary (n = 4) showing the time course of changes in the adiponectin and Rac1 protein expression during adipogenesis with and without treatment with 1 µM mifepristone. The levels of adiponectin were normalized by those of Rac1, and the value obtained without mifepristone treatment on day 8 was assigned a value of 1. E Summary (n = 6) of the qRT-PCR analysis of the expression of adiponectin, Fabp4, PPARγ and PPARγ2 mRNA on day 5. The level of each transcript was normalized to that of 18S rRNA, and the value obtained without treatment was assigned a value of 1. F Representative Immunoblot (IB) images and summary (n = 4) of the concentration-dependent effects of treatment with mifepristone or pioglitazone on the adiponectin protein expression on day 5. The expression levels of adiponectin were normalized to those of Rac1, and then expressed as the fold increase from the value obtained without treatment. All data represent the mean ± S.E.M. *, P < 0.05; **, P < 0.01; ***, P < 0.001; ****, P < 0.0001 vs. Day 0 (B) or the values obtained without treatment (C, D). †P < 0.05; ††††, P < 0.0001 vs. vehicle. ns, not significantly different
Fig. 1
Fig. 1
Augmentation by mifepristone of upregulation of adiponectin expression during adipocyte differentiation in 3T3-L1 cells. A The experimental protocol used to examine the effect of treatment with vehicle (dotted line) and either mifepristone or pioglitazone (solid line) during the differentiation of 3T3-L1 cells to adipocytes. Adipocyte differentiation was induced as described in the Materials and Methods. MIX, the period of incubation with the first differentiation medium, containing 4.5 g/L D-glucose, 1 µg/mL insulin, 1 µM dexamethasone and 0.5 mM IBMX in the standard culture media. INS, the period of incubation with the second differentiation medium, consisting of 4.5 g/L D-glucose and 1 µg/mL insulin in the standard culture media. DMEM, the period of incubation with the standard culture media. B Representative microscopic images of Bodipy staining and summaries (n = 6) of the quantification on day 10 after induction of adipogenesis. Scale bar, 600 µm. C The time-dependent changes in the cell count during adipogenesis with and without 1 µM mifepristone. D Representative immunoblot images and summary (n = 4) showing the time course of changes in the adiponectin and Rac1 protein expression during adipogenesis with and without treatment with 1 µM mifepristone. The levels of adiponectin were normalized by those of Rac1, and the value obtained without mifepristone treatment on day 8 was assigned a value of 1. E Summary (n = 6) of the qRT-PCR analysis of the expression of adiponectin, Fabp4, PPARγ and PPARγ2 mRNA on day 5. The level of each transcript was normalized to that of 18S rRNA, and the value obtained without treatment was assigned a value of 1. F Representative Immunoblot (IB) images and summary (n = 4) of the concentration-dependent effects of treatment with mifepristone or pioglitazone on the adiponectin protein expression on day 5. The expression levels of adiponectin were normalized to those of Rac1, and then expressed as the fold increase from the value obtained without treatment. All data represent the mean ± S.E.M. *, P < 0.05; **, P < 0.01; ***, P < 0.001; ****, P < 0.0001 vs. Day 0 (B) or the values obtained without treatment (C, D). †P < 0.05; ††††, P < 0.0001 vs. vehicle. ns, not significantly different
Fig. 2
Fig. 2
Critical period of mifepristone treatment for augmenting the adiponectin expression during adipocyte differentiation in 3T3-L1 cells. A Experimental protocols used to determine the critical period of treatment with 1 µM mifepristone (solid lines) for augmenting the expression of adiponectin during adipogenesis. Confluent 3T3-L1 cells were subjected to adipocyte differentiation as described in the Materials and Methods. The dotted lines indicate the period of vehicle treatment. B Summary (n = 6) of the qRT-PCR analysis of the expression of adiponectin, Fabp4, and PPARγ2 mRNA on day 10. The level of each transcript was normalized to that of 18S rRNA, and the value obtained with protocol 1 was assigned a value of 1. C Representative immunoblot (IB) images and summary (n = 4) of the expression of adiponectin and Fabp4 proteins on day 10. The levels of adiponectin and the Fabp4 expression were normalized by those of Rac1, and then expressed as the fold increase from the values obtained with protocol 1. All data represent the mean ± S.E.M. *, P < 0.05; **, P < 0.01 vs. values obtained with protocol 1 (vehicle alone)
Fig. 3
Fig. 3
Evaluation of the paracrine/autocrine effect of adiponectin in the mifepristone-induced enhancement of adipocyte differentiation in 3T3-L1 cells. A, B The effect of mifepristone on the secretion of adiponectin during adipogenesis was examined in two protocols. Representative immunoblot (IB) images and summary (n = 4) show the levels of adiponectin secretion with and without mifepristone treatment (0.1 and 1 µM) on days 6, 7 and 8 (A) and days 3, 4 and 5 (B). The adiponectin secretion levels were expressed relative to those obtained without mifepristone on day 6 (A) or day 3 (B). In the schematic illustrations showing the experimental protocols, the dotted lines indicate the period of vehicle treatment, while the solid lines indicate the period of mifepristone treatment. Since bovine adiponectin in FBS interferes with the quantification of secreted mouse adiponectin, the samples were obtained in serum-free medium. C Representative fluorescent microscopic images and summary (n = 4) of Bodipy 493/503 (green) fluorescence on day 12 after the induction of adipogenesis, with and without treatment with 1 µM mifepristone and 12.5 µg/mL adiponectin-neutralizing antibody ANOC 9104 (NAb). Mifepristone and NAb were applied during 5-day treatment with MIX and INS medium. Scale bar, 300 µm. D, E The effects of mifepristone and NAb on the expression of adiponectin and Fabp4 mRNA (D) and adiponectin protein (E) on day 5 after the induction of adipogenesis. The mRNA level was normalized to that of 18S rRNA; the protein level was normalized to that of Rac1. The values obtained with no treatment were assigned a value of 1. F Summary (n = 3) of the effect of 1 µM mifepristone and 10 µM T0070907 on the expression of Fabp4, PPARγ, and PPARγ2 mRNA on day 5 after the induction of adipogenesis according to the protocol shown in Fig. 1A. The levels of Fabp4 and PPARγ were normalized to the level of 18S rRNA, and expressed relative to that obtained without any treatment. All data represent the mean ± S.E.M. *P < 0.05; **P < 0.01 vs. day 6 (A), day 3 (B) or as indicated (CF). P < 0.05; ††P < 0.01 vs. vehicle (A and B)
Fig. 3
Fig. 3
Evaluation of the paracrine/autocrine effect of adiponectin in the mifepristone-induced enhancement of adipocyte differentiation in 3T3-L1 cells. A, B The effect of mifepristone on the secretion of adiponectin during adipogenesis was examined in two protocols. Representative immunoblot (IB) images and summary (n = 4) show the levels of adiponectin secretion with and without mifepristone treatment (0.1 and 1 µM) on days 6, 7 and 8 (A) and days 3, 4 and 5 (B). The adiponectin secretion levels were expressed relative to those obtained without mifepristone on day 6 (A) or day 3 (B). In the schematic illustrations showing the experimental protocols, the dotted lines indicate the period of vehicle treatment, while the solid lines indicate the period of mifepristone treatment. Since bovine adiponectin in FBS interferes with the quantification of secreted mouse adiponectin, the samples were obtained in serum-free medium. C Representative fluorescent microscopic images and summary (n = 4) of Bodipy 493/503 (green) fluorescence on day 12 after the induction of adipogenesis, with and without treatment with 1 µM mifepristone and 12.5 µg/mL adiponectin-neutralizing antibody ANOC 9104 (NAb). Mifepristone and NAb were applied during 5-day treatment with MIX and INS medium. Scale bar, 300 µm. D, E The effects of mifepristone and NAb on the expression of adiponectin and Fabp4 mRNA (D) and adiponectin protein (E) on day 5 after the induction of adipogenesis. The mRNA level was normalized to that of 18S rRNA; the protein level was normalized to that of Rac1. The values obtained with no treatment were assigned a value of 1. F Summary (n = 3) of the effect of 1 µM mifepristone and 10 µM T0070907 on the expression of Fabp4, PPARγ, and PPARγ2 mRNA on day 5 after the induction of adipogenesis according to the protocol shown in Fig. 1A. The levels of Fabp4 and PPARγ were normalized to the level of 18S rRNA, and expressed relative to that obtained without any treatment. All data represent the mean ± S.E.M. *P < 0.05; **P < 0.01 vs. day 6 (A), day 3 (B) or as indicated (CF). P < 0.05; ††P < 0.01 vs. vehicle (A and B)
Fig. 4
Fig. 4
Induction of adipocyte differentiation and the expression of adiponectin by mifepristone alone in 3T3-L1 cells. A Representative fluorescent microscopic images of Bodipy 493/503 (green) fluorescence and summary (n = 3) of the concentration-dependent effects of mifepristone on the lipid accumulation on day 12. The cells were treated with mifepristone for the first 5 days, and then cultured in its absence until day 12. Scale bar, 300 µm. B Representative immunoblot (IB) images and summary (n = 3) of the concentration-dependent effects of treatment with mifepristone on the adiponectin protein expression on day 6. The expression levels of adiponectin were normalized to those of cyclophilin B, and then expressed as the fold increase from the value obtained without treatment. All data represent the mean ± S.E.M. *P < 0.05; **P < 0.01; ***P < 0.001; ****P < 0.0001 vs. the values obtained without treatment
Fig. 5
Fig. 5
Effects of knockdown of PPARγ on the expression of adiponectin and Fabp4 during mifepristone-induced adipocyte differentiation in 3T3-L1 cells. A Summary of the qRT-PCR (n = 3) and immunoblot (IB) (n = 4) analyses of the efficacy of knockdown of PPARγ on 2 and 7 days after transfection of siRNA (10 nM). Representative IB images are also shown. The levels of PPARγ mRNA and protein were normalized by those of 18S rRNA and Rac1, respectively, and the values obtained with control siRNA were assigned a value of 1. B Representative immunoblot (IB) images and summary (n = 3) of the effects of PPARγ knockdown on the mifepristone-induced expression of adiponectin and Fabp4 proteins on day 5 after the induction of adipogenesis (i.e., 7 days after transfection of PPARγ or control siRNA). The levels of adiponectin and the Fabp4 protein expression were normalized to those of Rac1, and the values obtained with mifepristone and control siRNA were assigned a value of 1. All data represent the mean ± S.E.M. *P < 0.05; **P < 0.01
Fig. 6
Fig. 6
Effect of mifepristone on the activity of promoter containing PPAR response elements and its dependence on the co-expression of PPARγ2 and RXRα in COS7 cells. A The concentration-dependent effects of mifepristone on the activity of promoter containing three copies of PPAR response element in COS7 cells, which were co-transfected with PPARγ2 and RXRα expression vectors. B Summary of the effects of mifepristone (1 and 10 µM) and pioglitazone (1 µM) on the promoter activity of PPAR response element with and without the co-expression of PPARγ2 and RXRα or co-treatment with the PPARγ2 antagonist, T00709007 (10 µM), as indicated. The data represent the mean ± S.E.M. of triplicate measurements of one set of experiments. Similar results were obtained with an additional two sets of experiments
Fig. 7
Fig. 7
The principal component analysis of three datasets of 3T3-L1 cell and four registered datasets of the normal mouse adipose tissues. The principal component analysis of the datasets of 3T3-L1 cells under three conditions (non, mifepristone, and MIX), as described in the Materials and Methods section, with all registered datasets of epidydimal or inguinal adipose tissues (A), or any one of the four registered datasets as indicated (BE)
Fig. 8
Fig. 8
Hierarchical clustering and the gene ontology (GO) enrichment analysis of the differentially expressed genes (DEGs). Hierarchical clustering display of the datasets (a–f as indicated in a key) and the GO enrichment analysis of 403 transcripts that showed a significant twofold difference in expression level between mifepristone-differentiated adipocytes (a, mifepristone) and adipocytes differentiated by the conventional differentiation protocol (b, MIX) or non-differentiated adipocytes (c, non) (A) and 62 genes that were selected by the algorithm shown on the top (B). Namely, 62 genes were differentially expressed (> twofold) between mifepristone (a) vs. MIX (b) and non (b), but commonly expressed (< twofold) in mifepristone (a) and either one of epididymal adipose tissues (d, e, f). The top GO terms with a value of -log10P > 2 in all three subcategories (top bar graph) and a subcategory of biological processes (lower bar graph) are shown below the hierarchical clustering display
Fig. 8
Fig. 8
Hierarchical clustering and the gene ontology (GO) enrichment analysis of the differentially expressed genes (DEGs). Hierarchical clustering display of the datasets (a–f as indicated in a key) and the GO enrichment analysis of 403 transcripts that showed a significant twofold difference in expression level between mifepristone-differentiated adipocytes (a, mifepristone) and adipocytes differentiated by the conventional differentiation protocol (b, MIX) or non-differentiated adipocytes (c, non) (A) and 62 genes that were selected by the algorithm shown on the top (B). Namely, 62 genes were differentially expressed (> twofold) between mifepristone (a) vs. MIX (b) and non (b), but commonly expressed (< twofold) in mifepristone (a) and either one of epididymal adipose tissues (d, e, f). The top GO terms with a value of -log10P > 2 in all three subcategories (top bar graph) and a subcategory of biological processes (lower bar graph) are shown below the hierarchical clustering display
Fig. 9
Fig. 9
In vivo adipogenic effect of mifepristone in mice. A Summary (n = 8) of the dose-dependent effects of mifepristone (0.1, 1, and 30 mg/kg bw/day) on the time course of changes in the body weight after 12-week oral treatment with mifepristone. The summary of the calculated average daily food consumption during the experimental protocol (8–20 weeks) in the indicated experimental groups. The mice were fed a regular diet (RD) with or without mifepristone for 12 weeks. B Summaries of the body weight-normalized weights of the indicated organs and tissues. C Summaries of the mRNA expression of adiponectin, Fabp4, PPARγ and PPARγ2 in epididymal adipose tissues obtained from the mice of the indicated experimental groups. The mRNA levels were normalized by that of 18S rRNA and expressed as a fold increase from those of the mice of RD. The data represent the mean ± S.E.M. *P < 0.05; **P < 0.01 vs. RD

Similar articles

References

    1. Ghaben AL, Scherer PE. Adipogenesis and metabolic health. Nat Rev Mol Cell Biol. 2019;20(4):242–258. doi: 10.1038/s41580-018-0093-z. - DOI - PubMed
    1. Cristancho AG, Lazar MA. Forming functional fat: a growing understanding of adipocyte differentiation. Nat Rev Mol Cell Biol. 2011;12(11):722–734. doi: 10.1038/nrm3198. - DOI - PMC - PubMed
    1. Rosen ED, MacDougald OA. Adipocyte differentiation from the inside out. Nat Rev Mol Cell Biol. 2006;7(12):885–896. doi: 10.1038/nrm2066. - DOI - PubMed
    1. Tang QQ, Lane MD. Adipogenesis: from stem cell to adipocyte. Annu Rev Biochem. 2012;81:715–736. doi: 10.1146/annurev-biochem-052110-115718. - DOI - PubMed
    1. Ali AT, Hochfeld WE, Myburgh R, Pepper MS. Adipocyte and adipogenesis. Eur J Cell Biol. 2013;92(6–7):229–236. doi: 10.1016/j.ejcb.2013.06.001. - DOI - PubMed