. 2024 Mar 29;25(1):137.
doi: 10.1186/s12859-023-05591-8.

Towards a unified medical microbiome ecology of the OMU for metagenomes and the OTU for microbes

Affiliations

Towards a unified medical microbiome ecology of the OMU for metagenomes and the OTU for microbes

Zhanshan Sam Ma. BMC Bioinformatics. .

Abstract

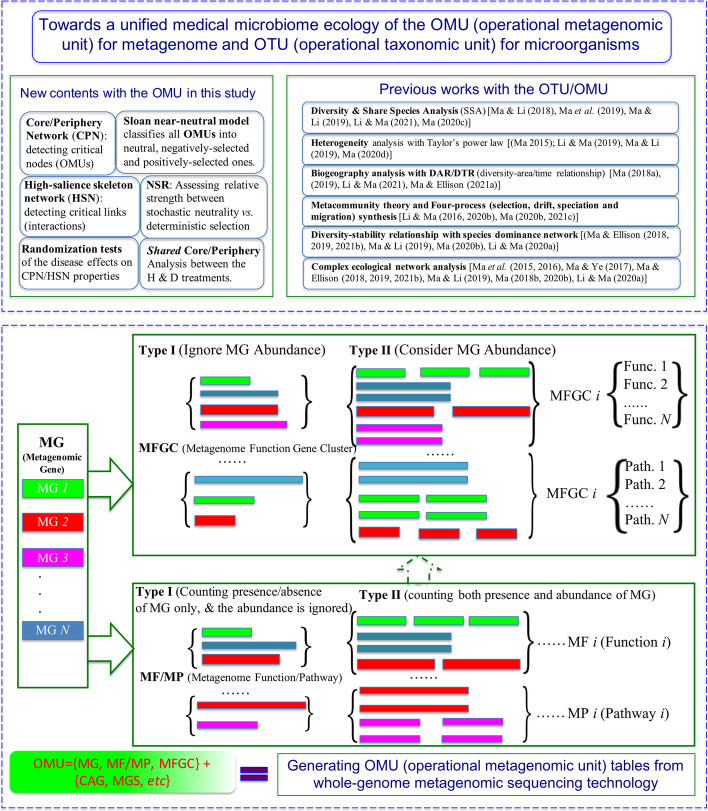
Background: Metagenomic sequencing technologies offered unprecedented opportunities and also challenges to microbiology and microbial ecology particularly. The technology has revolutionized the studies of microbes and enabled the high-profile human microbiome and earth microbiome projects. The terminology-change from microbes to microbiomes signals that our capability to count and classify microbes (microbiomes) has achieved the same or similar level as we can for the biomes (macrobiomes) of plants and animals (macrobes). While the traditional investigations of macrobiomes have usually been conducted through naturalists' (Linnaeus & Darwin) naked eyes, and aerial and satellite images (remote-sensing), the large-scale investigations of microbiomes have been made possible by DNA-sequencing-based metagenomic technologies. Two major types of metagenomic sequencing technologies-amplicon sequencing and whole-genome (shotgun sequencing)-respectively generate two contrastingly different categories of metagenomic reads (data)-OTU (operational taxonomic unit) tables representing microorganisms and OMU (operational metagenomic unit), a new term coined in this article to represent various cluster units of metagenomic genes.

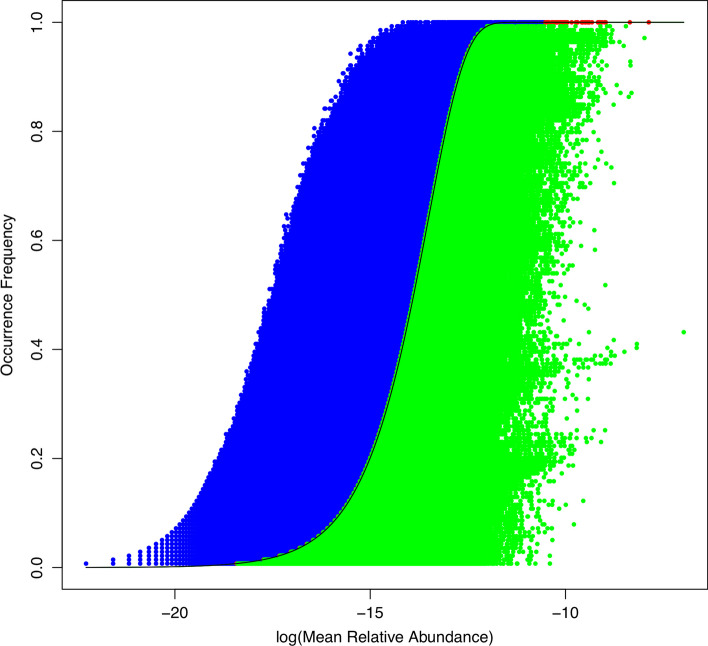
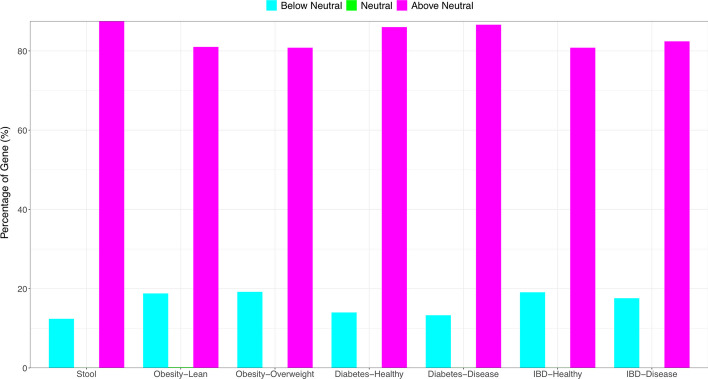
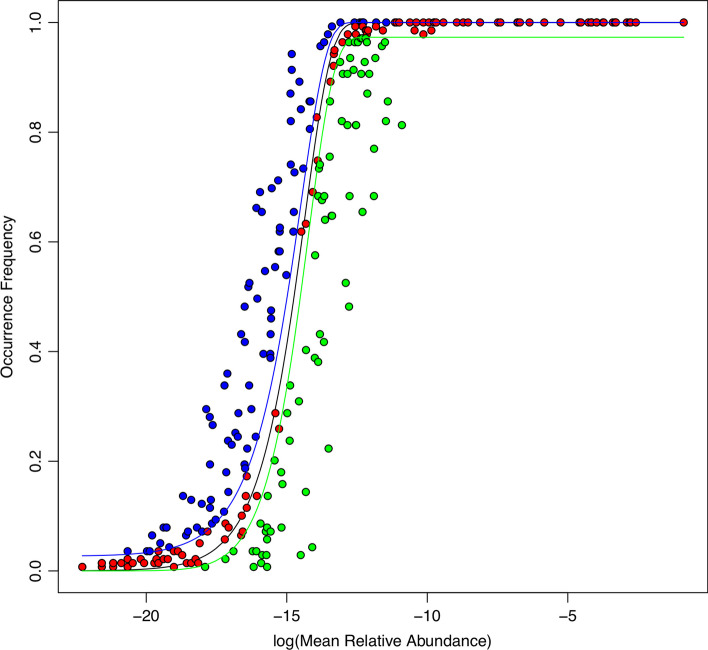
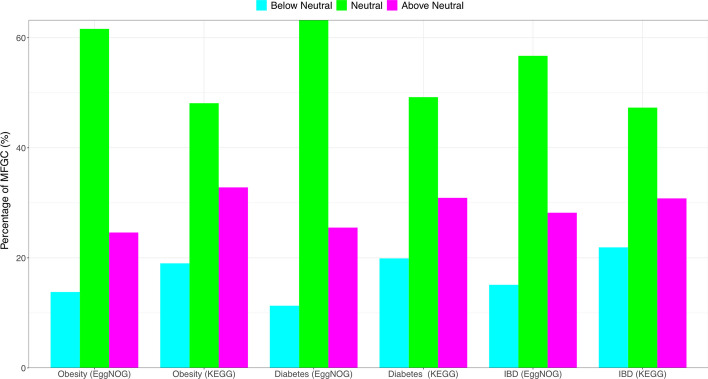
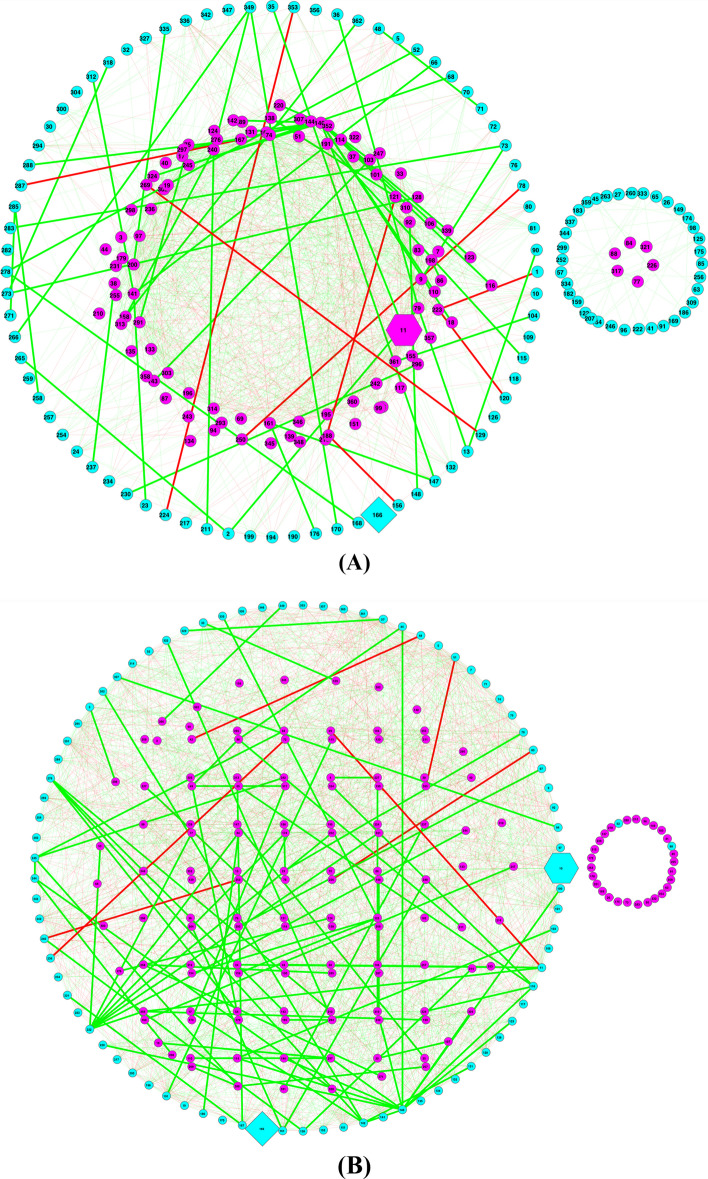
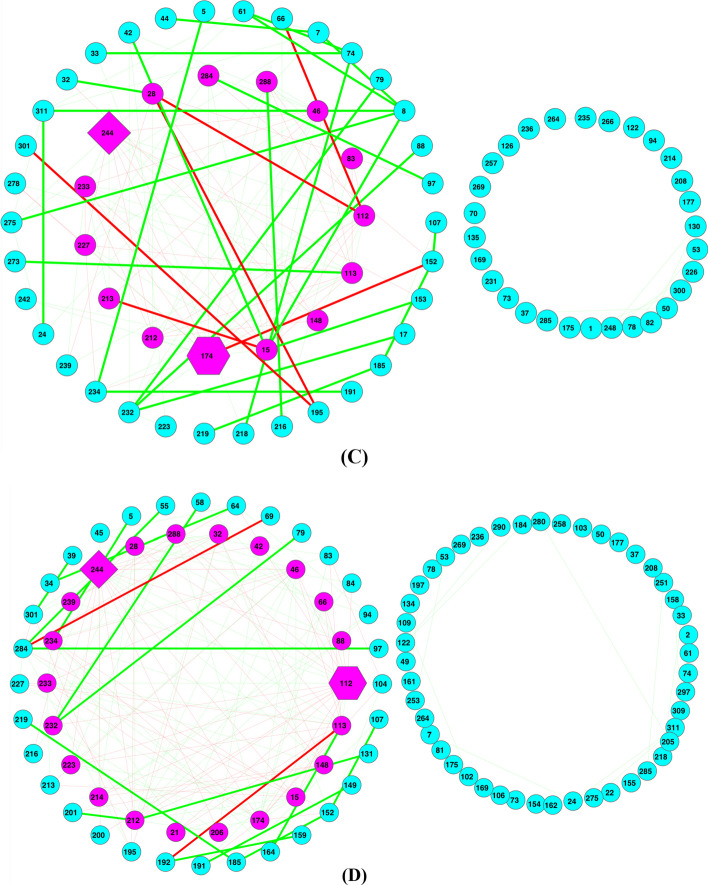
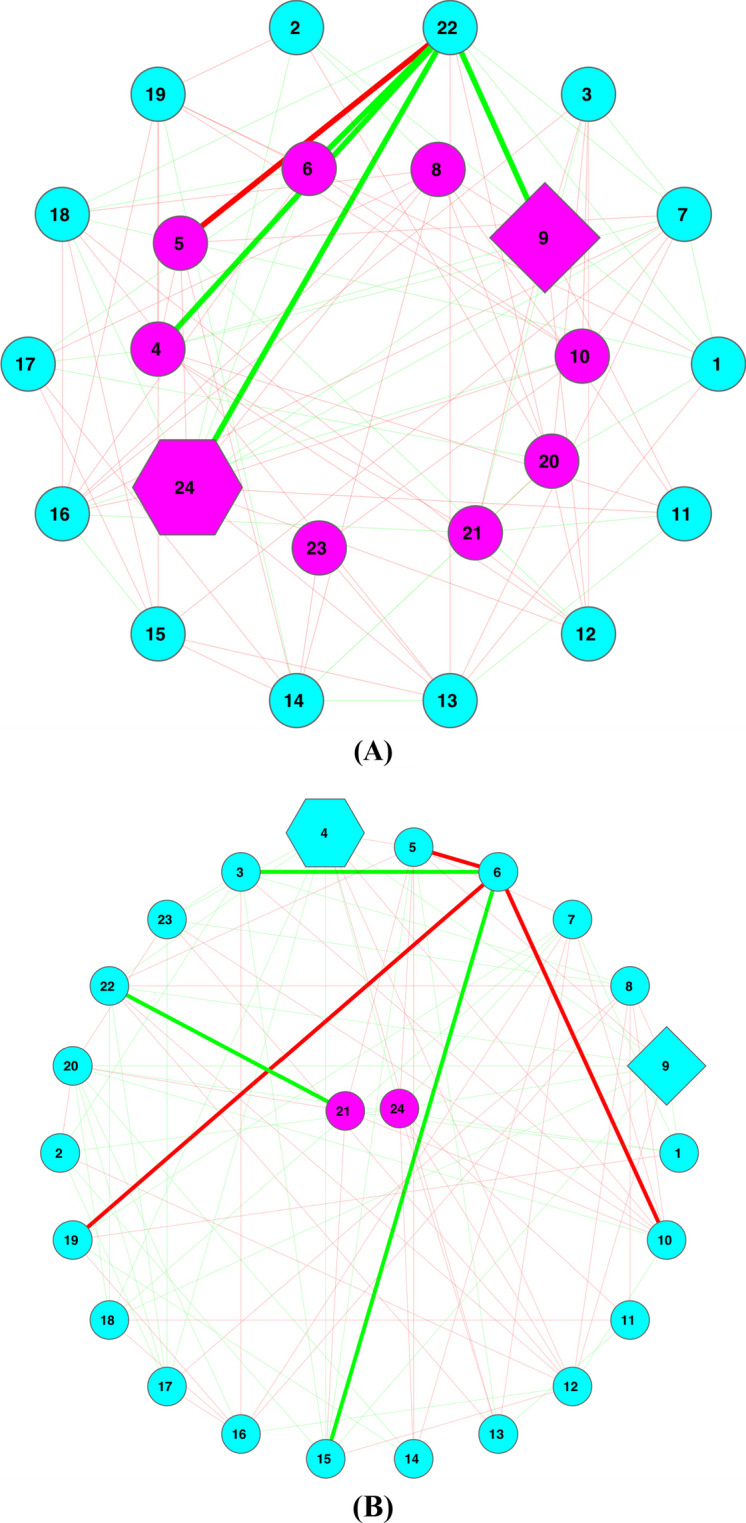
Results: The ecological science of microbiomes based on the OTU representing microbes has been unified with the classic ecology of macrobes (macrobiomes), but the unification based on OMU representing metagenomes has been rather limited. In a previous series of studies, we have demonstrated the applications of several classic ecological theories (diversity, composition, heterogeneity, and biogeography) to the studies of metagenomes. Here I push the envelope for the unification of OTU and OMU again by demonstrating the applications of metacommunity assembly and ecological networks to the metagenomes of human gut microbiomes. Specifically, the neutral theory of biodiversity (Sloan's near neutral model), Ning et al.stochasticity framework, core-periphery network, high-salience skeleton network, special trio-motif, and positive-to-negative ratio are applied to analyze the OMU tables from whole-genome sequencing technologies, and demonstrated with seven human gut metagenome datasets from the human microbiome project.

Conclusions: All of the ecological theories demonstrated previously and in this article, including diversity, composition, heterogeneity, stochasticity, and complex network analyses, are equally applicable to OMU metagenomic analyses, just as to OTU analyses. Consequently, I strongly advocate the unification of OTU/OMU (microbiomes) with classic ecology of plants and animals (macrobiomes) in the context of medical ecology.

Keywords: Core/periphery network; High-salience skeleton network; Medical ecology; Metagenome ecology; Operational metagenomic unit (OMU); Operational taxonomic unit (OTU); Sloan near neutral model; Unified ecology of metagenomes and organisms (species); Unified ecology of microbiomes and macrobiomes.


Conflict of interest statement

The authors declare no competing interests.

Figures

Fig. 1
Fig. 1
Diagramming the study design towards unified medical microbiome ecology of metagenomes (OMU) and organisms (OTU). The whole diagram consists of top section and bottom section, as well as formal set-theoretic (mathematical) definition of OMU, which are interpreted below. (1) The top section displays the study design consisting of two parts, i.e., the previous works (for the OTU and three topics of the OMU) including diversity, heterogeneity and biogeography) and the contents planned for this study. The new contents with the OMU in this study include six approaches: two network-approaches with core/periphery network (CPN) and high-salience skeleton network (HSN), Sloan near-neutral model, normalized stochasticity ratio (NSR), two statistical test approaches (randomization tests and shared OMU analysis) for detecting the disease effects. (2) In the bottom section, the ad-hoc concept OMU (operational metagenomic unit) or its shorthand MU is introduced as the counterpart of OTU (see the methods section for their interpretations), and MG (metagenomic gene) is considered as the basic (‘atomic’) unit of OMU and is similar to (the counterpart of) the species in the OTU (97% similarity in 16S-rRNA sequences for bacteria) taxonomic hierarchy. Both MGs and species exist as basic (undividable) units. In the case of MG, each MG may have one or more functions, but the ‘components’ (if forced to divide) of MG is sequencing reads that do not have a corresponding function (hence being atomic). Species is the foundation of a taxonomic system in the case of OTU hierarchy. The other entities of OMU include MF/MP/MFGC (defined by Ma & Li 2018: Mol. Ecol. Res.) and CAG and MGS (by Li et al. 2014; Nielsen et al. 2014, both in Nature Biotechnology). All of them are generated from MGs, just like other taxonomic units such as genus and family are combinations of species. (3) Formal mathematical definitions for MF/MP/MFGC from the MG are defined as follows. Assuming there are n MGs, i.e., MG1, MG2,…, MGn, we can define MF/MP/MFGC with mathematic set notation: MF=MG1,MG2,MG3,, where MG1, MG2, MG3 are mapped to same metagenomic function. MP can be defined similarly except that all of its genes (MGs) are mapped to same metagenomic pathway. Therefore, MF (or MP) can be described as a set of the MGs annotated to the same metagenomic function (or pathway). Conceptually, MFGC is a set of subsets of MFs (or MPs). That is, the elements of MFGC set consist of the combination of MFs. For example, MFGC={{MF1,MF7}}, this MFGC consists of the MGs that simultaneously annotated to two metagenomic functions MF1, and MF7. Assuming there are m possible MFs, the total possible number of MFGC is equal to M=Cm2+Cm3+Cmm-1+Cmm. In practice, only a tiny portion of the possible number exists naturally
Fig. 2
Fig. 2
Sloan near-neutral model fitted to the MGs (metagenomic genes) in human stool metagenomes (the 1st dataset in Table 1) showing the neutral MG (few and negligible red dots), above-neutral (blue dots at the left side) and below-neutral (green dots at the right side)
Fig. 3
Fig. 3
Percentages of the three categories of MGs (metagenomic genes) classified by Sloan near neutral models: below-neutral (cyan blue bar), neutral (green bar showing neutral MGs), and above-neutral (magenta bar) (drawn based on Additional file 1: Table S1). Note that the green bars for the neutral percentages were too low to be visible here
Fig. 4
Fig. 4
Sloan near-neutral model fitted to the MFGCs (metagenome functional gene clusters) of the human stool metagenome samples (the first dataset in Table 1) (based on KEGG database) showing the neutral MFGC (red dots), above-neutral (left side blue dots) and below-neutral (right side green dots)
Fig. 5
Fig. 5
Percentages of three categories of MFGCs (metagenome functional gene clusters, based on KEGG and EggNOG database) classified by Sloan near neutral models: below-neutral (cyan blue bar), neutral (green bar showing neutral MGFCs), and above-neutral (magenta bar)
Fig. 6
Fig. 6
The MFGC-II (Type-II MFGC or abundance-based MFGC) networks for the lean and overweight treatments of the obesity dataset (A-D); Legends: core nodes in magenta (located mostly in center), periphery nodes in cyan, green links for positive correlations and red links for negative correlations, thicken links are high-salience skeletons (backbones), hexagon-shaped node for network hub, diamond-shaped node for the most abundant MFGC in the network, cycle for regular nodes (either core in magenta or periphery in cyan). (A) MFGC-II (abundance-based MFGC) network based on functional eggNOG database—Lean treatment of Obesity dataset (B) MFGC-II (abundance based MFGC) network based on eggNOG database—Overweight treatment of Obesity dataset; (C) MFGC-II (abundance-based MFGC) network based on KEGG database—Lean treatment of Obesity dataset; (D) MFGC-II (abundance based MFGC) network based on KEGG database—Overweight treatment of Obesity dataset
Fig. 6
Fig. 6
The MFGC-II (Type-II MFGC or abundance-based MFGC) networks for the lean and overweight treatments of the obesity dataset (A-D); Legends: core nodes in magenta (located mostly in center), periphery nodes in cyan, green links for positive correlations and red links for negative correlations, thicken links are high-salience skeletons (backbones), hexagon-shaped node for network hub, diamond-shaped node for the most abundant MFGC in the network, cycle for regular nodes (either core in magenta or periphery in cyan). (A) MFGC-II (abundance-based MFGC) network based on functional eggNOG database—Lean treatment of Obesity dataset (B) MFGC-II (abundance based MFGC) network based on eggNOG database—Overweight treatment of Obesity dataset; (C) MFGC-II (abundance-based MFGC) network based on KEGG database—Lean treatment of Obesity dataset; (D) MFGC-II (abundance based MFGC) network based on KEGG database—Overweight treatment of Obesity dataset
Fig. 7
Fig. 7
The MF-I (Type-I metagenomic function or non-abundance based, aligned with eggNOG database) and MP-I (type-I metagenomic path, based on KEGG databases) networks for the lean and overweight treatments of the obesity dataset (A-D); Legends: core nodes in magenta (located mostly in center), periphery nodes in cyan, green links for positive correlations and red links for negative correlations, thicken links are high-salience skeletons (backbones), hexagon-shaped node for network hub, diamond-shaped node for the most abundant MF/MP in the network, cycle for regular nodes (either core in magenta or periphery in cyan). (A) MF-I (non-abundance based MF) network based on eggNOG database—Lean treatment of Obesity dataset; (B) MF-I (non-abundance based MF) network based on eggNOG database)—Overweight treatment of Obesity dataset; (C). MP-I (non-abundance based MF) network based on KEGG database—Lean treatment of Obesity dataset; (D) MP-I (non-abundance based MF) network based on KEGG database—Overweight treatment of Obesity dataset
Fig. 7
Fig. 7
The MF-I (Type-I metagenomic function or non-abundance based, aligned with eggNOG database) and MP-I (type-I metagenomic path, based on KEGG databases) networks for the lean and overweight treatments of the obesity dataset (A-D); Legends: core nodes in magenta (located mostly in center), periphery nodes in cyan, green links for positive correlations and red links for negative correlations, thicken links are high-salience skeletons (backbones), hexagon-shaped node for network hub, diamond-shaped node for the most abundant MF/MP in the network, cycle for regular nodes (either core in magenta or periphery in cyan). (A) MF-I (non-abundance based MF) network based on eggNOG database—Lean treatment of Obesity dataset; (B) MF-I (non-abundance based MF) network based on eggNOG database)—Overweight treatment of Obesity dataset; (C). MP-I (non-abundance based MF) network based on KEGG database—Lean treatment of Obesity dataset; (D) MP-I (non-abundance based MF) network based on KEGG database—Overweight treatment of Obesity dataset

Similar articles

References

    1. Jensen J, Payseur BA, Stephan W, Aquadro CF, Lynch M, Charlesworth D, Charlesworth B. The importance of the Neutral Theory in 1968 and 50 years on: a response to Kern and Hahn. Evolution. 2018;73–1:111–114. - PMC - PubMed
    1. Kimura M. Evolutionary rate at the molecular level. Nature. 1968;217:624–626. doi: 10.1038/217624a0. - DOI - PubMed
    1. Hubbell SP. The unified neutral theory of biodiversity and biogeography. Princeton: Princeton University Press; 2001. - PubMed
    1. Duret L. Neutral theory: the null hypothesis of molecular evolution. Nature Education. 2008;1(1):218.
    1. Hartl DL, Clark AG. Principles of population genetics. 3. Sunderland: Sinauer Associates; 1997.

LinkOut - more resources