

Transcriptional and metabolic effects of aspartate-glutamate carrier isoform 1 (AGC1) downregulation in mouse oligodendrocyte precursor cells (OPCs)
- PMID: 38553684
- PMCID: PMC10979587
- DOI: 10.1186/s11658-024-00563-z
Transcriptional and metabolic effects of aspartate-glutamate carrier isoform 1 (AGC1) downregulation in mouse oligodendrocyte precursor cells (OPCs)
Abstract
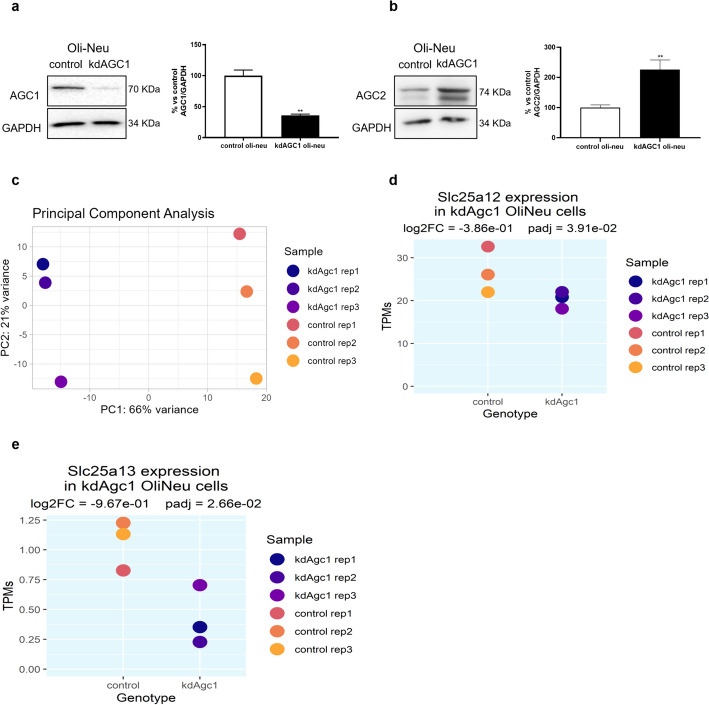
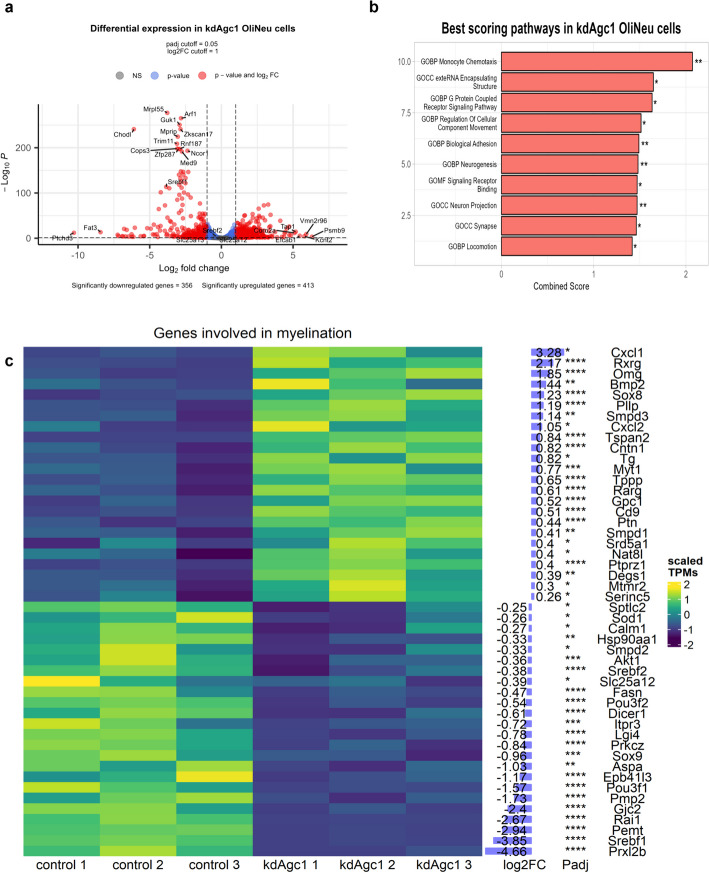
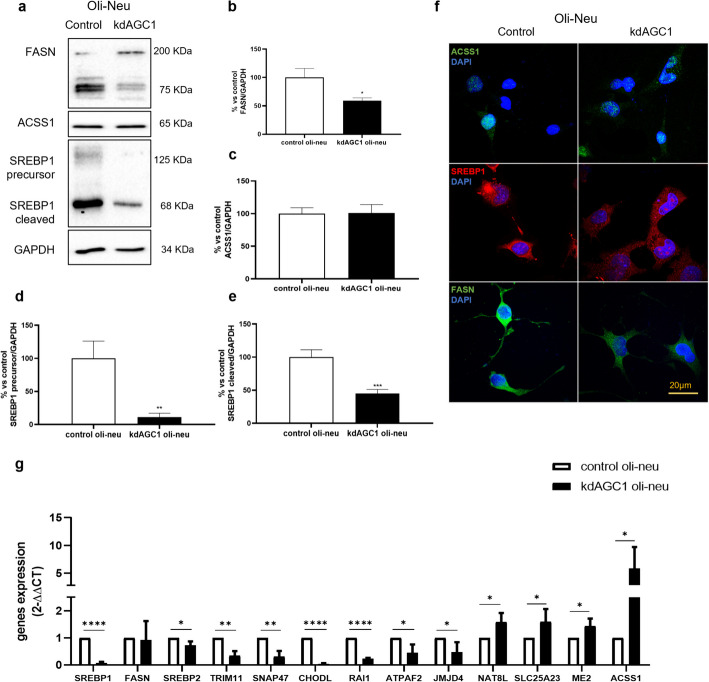
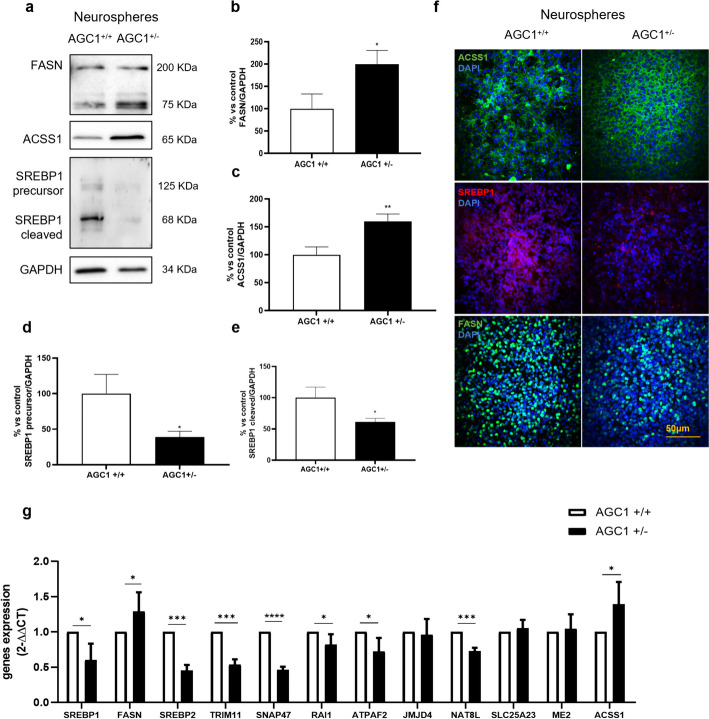
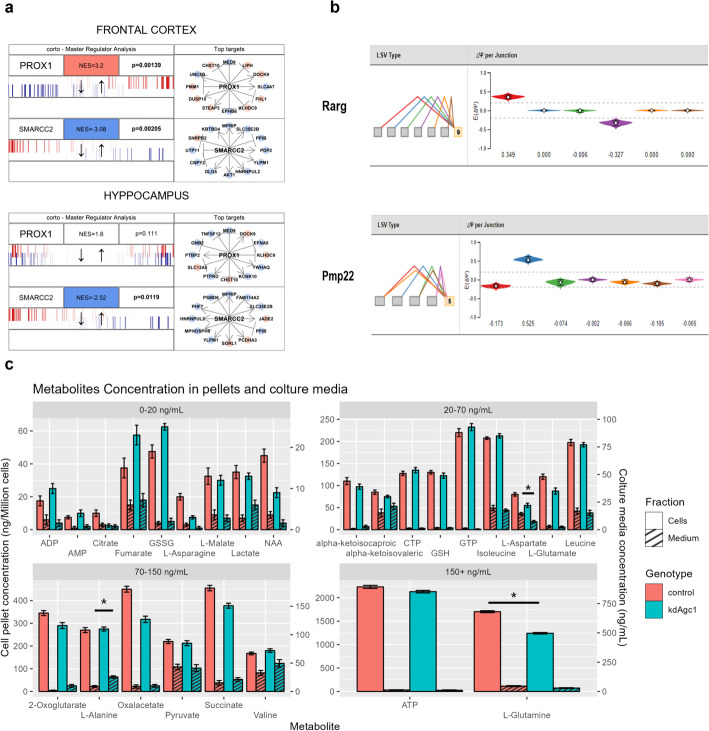
Aspartate-glutamate carrier isoform 1 (AGC1) is a carrier responsible for the export of mitochondrial aspartate in exchange for cytosolic glutamate and is part of the malate-aspartate shuttle, essential for the balance of reducing equivalents in the cells. In the brain, mutations in SLC25A12 gene, encoding for AGC1, cause an ultra-rare genetic disease, reported as a neurodevelopmental encephalopathy, whose symptoms include global hypomyelination, arrested psychomotor development, hypotonia and seizures. Among the biological components most affected by AGC1 deficiency are oligodendrocytes, glial cells responsible for myelination processes, and their precursors [oligodendrocyte progenitor cells (OPCs)]. The AGC1 silencing in an in vitro model of OPCs was documented to cause defects of proliferation and differentiation, mediated by alterations of histone acetylation/deacetylation. Disrupting AGC1 activity could possibly reduce the availability of acetyl groups, leading to perturbation of many biological pathways, such as histone modifications and fatty acids formation for myelin production. Here, we explore the transcriptome of mouse OPCs partially silenced for AGC1, reporting results of canonical analyses (differential expression) and pathway enrichment analyses, which highlight a disruption in fatty acids synthesis from both a regulatory and enzymatic stand. We further investigate the cellular effects of AGC1 deficiency through the identification of most affected transcriptional networks and altered alternative splicing. Transcriptional data were integrated with differential metabolite abundance analysis, showing downregulation of several amino acids, including glutamine and aspartate. Taken together, our results provide a molecular foundation for the effects of AGC1 deficiency in OPCs, highlighting the molecular mechanisms affected and providing a list of actionable targets to mitigate the effects of this pathology.
Keywords: Mitochondria; Neurodevelopment; Oligodendrocytes; Omics analysis; SLC25A12/aralar1/AGC1 deficiency; White matter disorder.
© 2024. The Author(s).
Conflict of interest statement
The authors affirm that the study was carried out without any affiliations with commercial or financial entities that could be interpreted as potential conflicts of interest.
Figures
Similar articles
-
Deficiency of Mitochondrial Aspartate-Glutamate Carrier 1 Leads to Oligodendrocyte Precursor Cell Proliferation Defects Both In Vitro and In Vivo.Int J Mol Sci. 2019 Sep 11;20(18):4486. doi: 10.3390/ijms20184486. Int J Mol Sci. 2019. PMID: 31514314 Free PMC article.
-
AGC1 Deficiency: Pathology and Molecular and Cellular Mechanisms of the Disease.Int J Mol Sci. 2022 Jan 4;23(1):528. doi: 10.3390/ijms23010528. Int J Mol Sci. 2022. PMID: 35008954 Free PMC article. Review.
-
Down-regulation of the mitochondrial aspartate-glutamate carrier isoform 1 AGC1 inhibits proliferation and N-acetylaspartate synthesis in Neuro2A cells.Biochim Biophys Acta Mol Basis Dis. 2017 Jun;1863(6):1422-1435. doi: 10.1016/j.bbadis.2017.02.022. Epub 2017 Feb 21. Biochim Biophys Acta Mol Basis Dis. 2017. PMID: 28235644
-
AGC1 deficiency associated with global cerebral hypomyelination.N Engl J Med. 2009 Jul 30;361(5):489-95. doi: 10.1056/NEJMoa0900591. N Engl J Med. 2009. PMID: 19641205
-
AGC1/2, the mitochondrial aspartate-glutamate carriers.Biochim Biophys Acta. 2016 Oct;1863(10):2394-412. doi: 10.1016/j.bbamcr.2016.04.011. Epub 2016 Apr 28. Biochim Biophys Acta. 2016. PMID: 27132995 Review.
Cited by
-
Impact of Histone Acetyltransferases and Histone Deacetylases on Adult Brain Myelin Plasticity.Results Probl Cell Differ. 2025;75:213-246. doi: 10.1007/978-3-031-91459-1_8. Results Probl Cell Differ. 2025. PMID: 40593212 Review.
-
Aspartate in the Brain: A Review.Neurochem Res. 2025 Jun 12;50(3):199. doi: 10.1007/s11064-025-04454-3. Neurochem Res. 2025. PMID: 40506607 Free PMC article. Review.
References
MeSH terms
Substances
Supplementary concepts
Grants and funding
LinkOut - more resources
Full Text Sources
Medical
Molecular Biology Databases
