

Lipidome characterisation and sex-specific differences in type 1 and type 2 diabetes mellitus
- PMID: 38553758
- PMCID: PMC10981308
- DOI: 10.1186/s12933-024-02202-5
Lipidome characterisation and sex-specific differences in type 1 and type 2 diabetes mellitus
Abstract
Background: In this study, we evaluated the lipidome alterations caused by type 1 diabetes (T1D) and type 2 diabetes (T2D), by determining lipids significantly associated with diabetes overall and in both sexes, and lipids associated with the glycaemic state.
Methods: An untargeted lipidomic analysis was performed to measure the lipid profiles of 360 subjects (91 T1D, 91 T2D, 74 with prediabetes and 104 controls (CT)) without cardiovascular and/or chronic kidney disease. Ultra-high performance liquid chromatography-electrospray ionization mass spectrometry (UHPLC-ESI-MS) was conducted in two ion modes (positive and negative). We used multiple linear regression models to (1) assess the association between each lipid feature and each condition, (2) determine sex-specific differences related to diabetes, and (3) identify lipids associated with the glycaemic state by considering the prediabetes stage. The models were adjusted by sex, age, hypertension, dyslipidaemia, body mass index, glucose, smoking, systolic blood pressure, triglycerides, HDL cholesterol, LDL cholesterol, alternate Mediterranean diet score (aMED) and estimated glomerular filtration rate (eGFR); diabetes duration and glycated haemoglobin (HbA1c) were also included in the comparison between T1D and T2D.
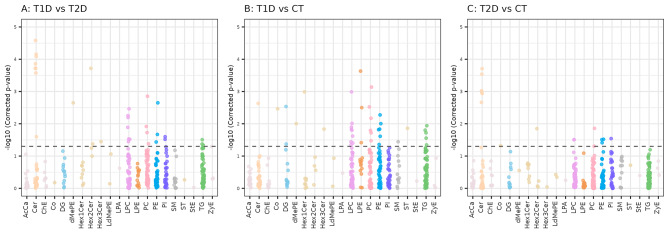
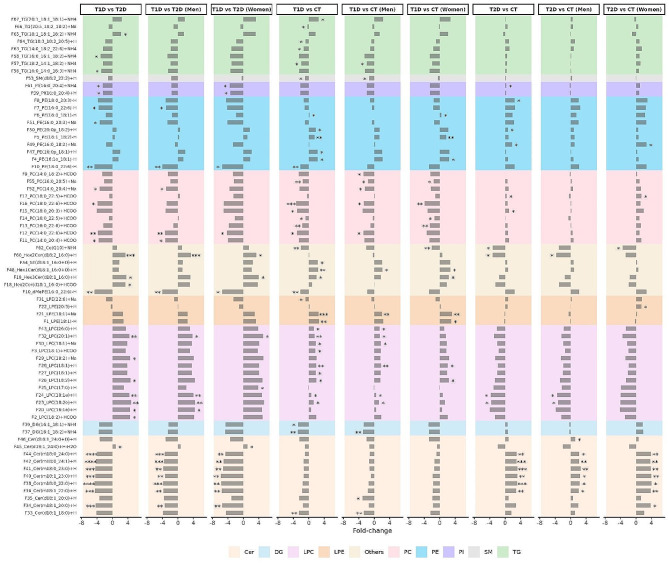
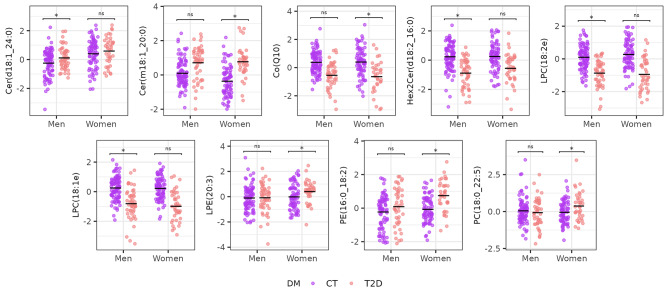
Results: A total of 54 unique lipid subspecies from 15 unique lipid classes were annotated. Lysophosphatidylcholines (LPC) and ceramides (Cer) showed opposite effects in subjects with T1D and subjects with T2D, LPCs being mainly up-regulated in T1D and down-regulated in T2D, and Cer being up-regulated in T2D and down-regulated in T1D. Also, Phosphatidylcholines were clearly down-regulated in subjects with T1D. Regarding sex-specific differences, ceramides and phosphatidylcholines exhibited important diabetes-associated differences due to sex. Concerning the glycaemic state, we found a gradual increase of a panel of 1-deoxyceramides from normoglycemia to prediabetes to T2D.
Conclusions: Our findings revealed an extensive disruption of lipid metabolism in both T1D and T2D. Additionally, we found sex-specific lipidome changes associated with diabetes, and lipids associated with the glycaemic state that can be linked to previously described molecular mechanisms in diabetes.
Keywords: Sex-specific differences; Type 1 diabetes; Type 2 diabetes; Untargeted lipidomics.
© 2024. The Author(s).
Conflict of interest statement
Prof. Mauricio is a co-author of this study and an Editorial Board member of the Cardiovascular diabetology journal. He was not involved in handling this manuscript during the submission and the review processes.
Figures


References
-
- Saeedi P, Petersohn I, Salpea P, Malanda B, Karuranga S, Unwin N et al. Global and regional diabetes prevalence estimates for 2019 and projections for 2030 and 2045: Results from the International Diabetes Federation Diabetes Atlas, 9th edition. 2019. 10.1016/j.diabres.2019.107843. - PubMed
-
- Wenk MR. The emerging field of lipidomics. Nat Rev Drug Discov 2005. - PubMed
-
- Castelblanco E, Hernández M, Ortega E, Amigó N, Real J, Granado-Casas M, et al. Outstanding improvement of the advanced lipoprotein profile in subjects with new-onset type 1 diabetes mellitus after achieving optimal glycemic control. Diabetes Res Clin Pract. 2021;182. 10.1016/j.diabres.2021.109145. - PubMed
Publication types
MeSH terms
Substances
Grants and funding
LinkOut - more resources
Full Text Sources
Medical
Research Materials
Miscellaneous
