. 2024 Mar 29;25(1):81.
doi: 10.1186/s13059-024-03219-5.

FixNCut: single-cell genomics through reversible tissue fixation and dissociation

Affiliations

FixNCut: single-cell genomics through reversible tissue fixation and dissociation

Laura Jiménez-Gracia et al. Genome Biol. .

Abstract

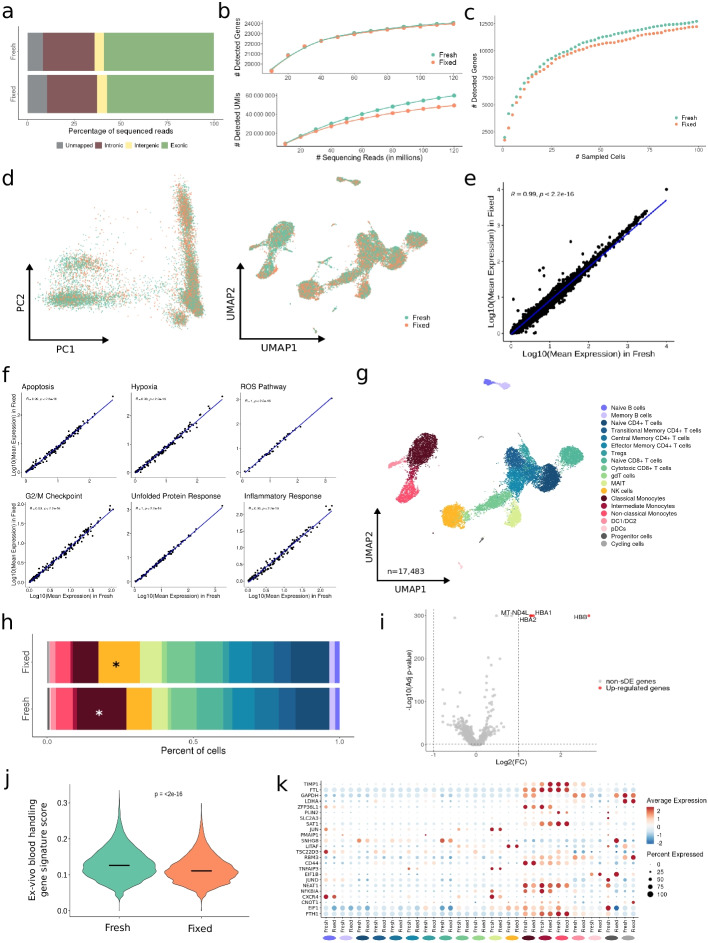
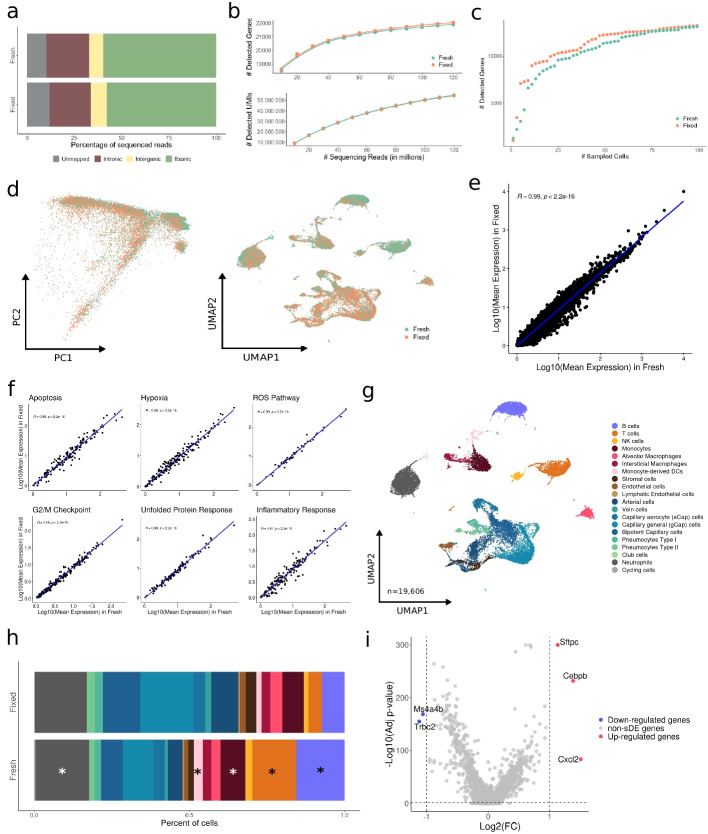
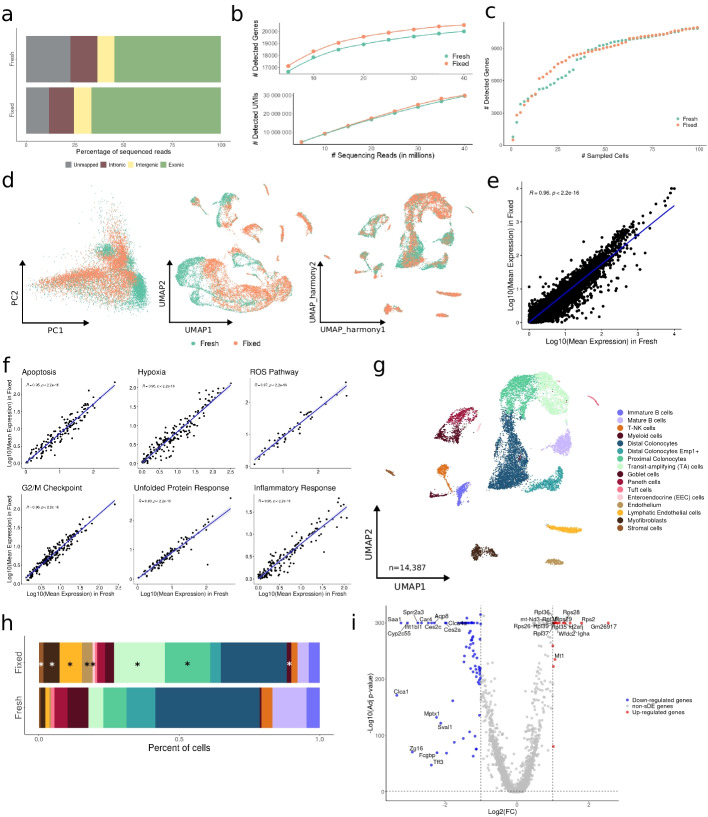
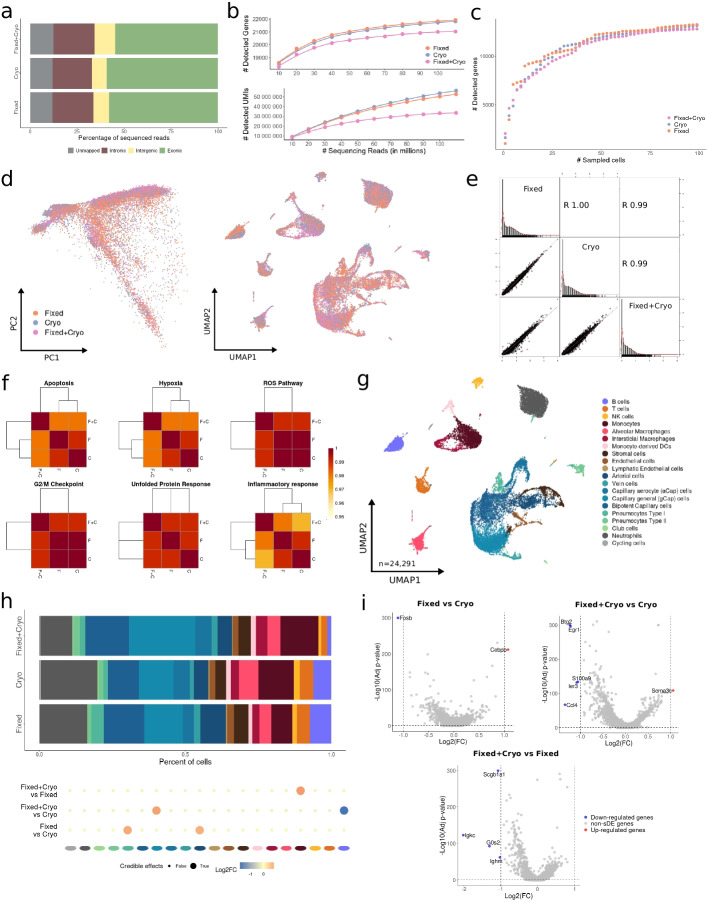
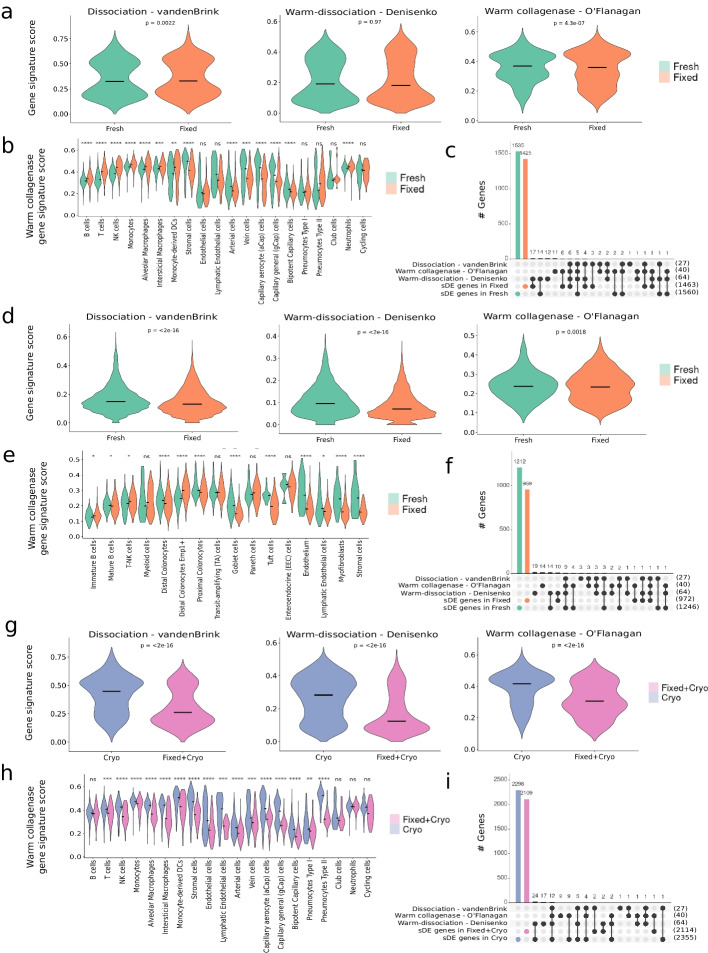
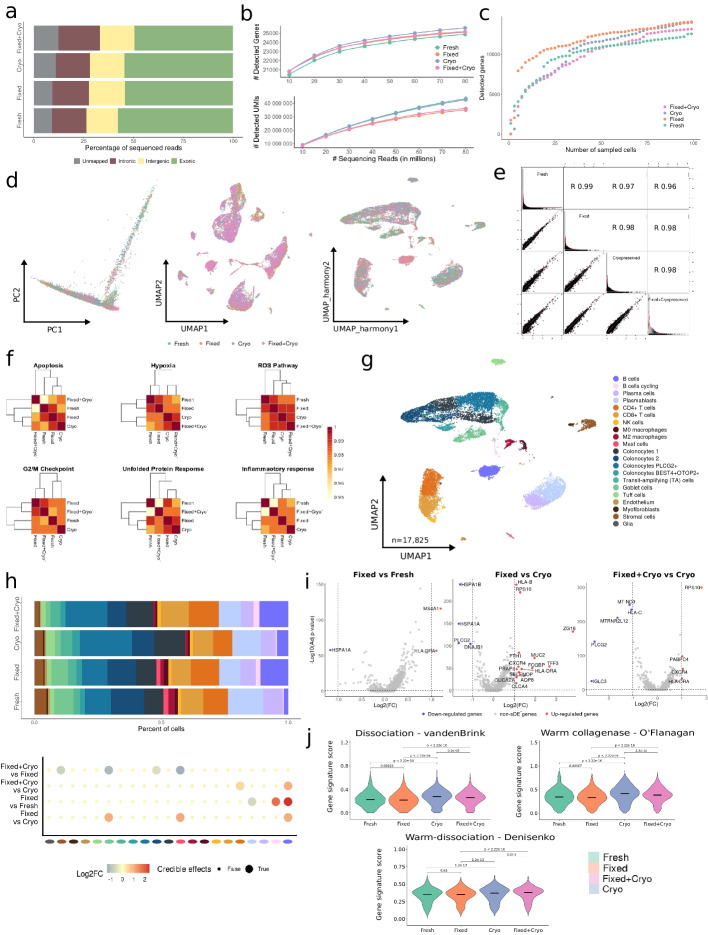
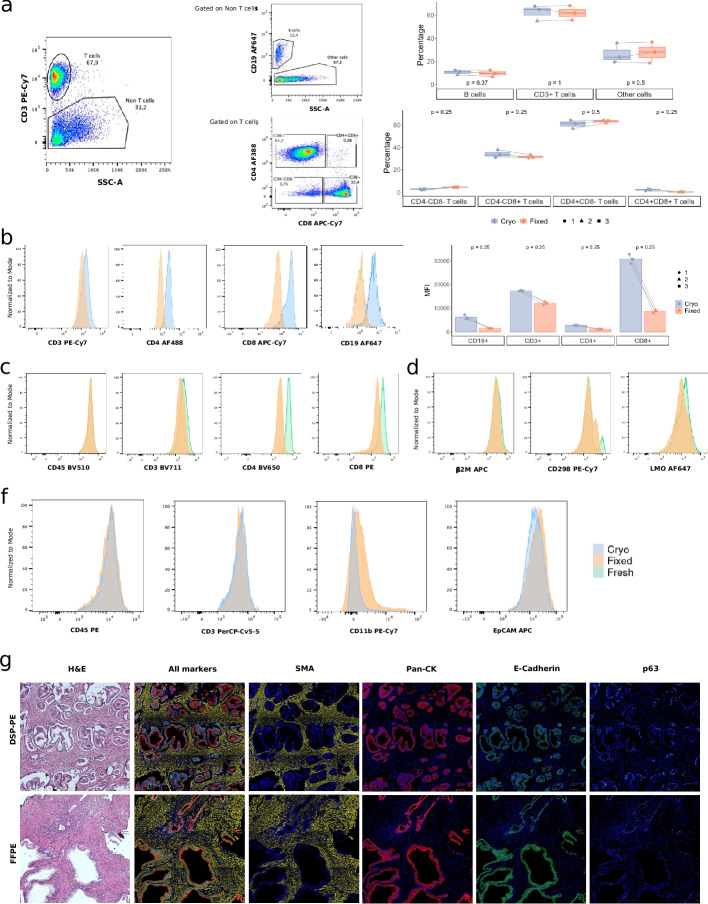
The use of single-cell technologies for clinical applications requires disconnecting sampling from downstream processing steps. Early sample preservation can further increase robustness and reproducibility by avoiding artifacts introduced during specimen handling. We present FixNCut, a methodology for the reversible fixation of tissue followed by dissociation that overcomes current limitations. We applied FixNCut to human and mouse tissues to demonstrate the preservation of RNA integrity, sequencing library complexity, and cellular composition, while diminishing stress-related artifacts. Besides single-cell RNA sequencing, FixNCut is compatible with multiple single-cell and spatial technologies, making it a versatile tool for robust and flexible study designs.

Keywords: Cellular stress; RNA sequencing; Sample fixation; Single-cell genomics; Tissue dissociation.


Conflict of interest statement

H.H. is a co-founder and shareholder of Omniscope, a scientific advisory board member of MiRXES and Nanostring, and a consultant to Moderna and Singularity. L.G.M is an advisor and shareholder of Omniscope and advisor for ArgenTAG, Millenium Sciences, and Truckee Applied Genomics. J.C.N. is a consultant of Omniscope. M.C.N. has received grants (unrestricted) from GSK, the European Commission, and Lung Foundation Netherlands. M.v.d.B. has received grants (unrestricted) from AstraZeneca, Novartis, GlaxoSmithKline, Roche, Genentech, and Sanofi. F.T. received speaker’s fees from Falk, Janssen, and AbbVie. S.S. has been a consultant for AbbVie, Bristol Myers Squibb, Boehringer Ingelheim, Ferring, Genentech/Roche, Janssen, Lilly, Novartis, Merck Sharp Dohme, Medimmune/AstraZeneca, Pfizer, Protagonist, Sanofi, Takeda, Theravance, and UCB and is a paid speaker for AbbVie, Ferring, Janssen, Merck Sharp Dohme, Novartis, Takeda, and UCB. P.R. has been a consultant for Takeda and Omass. I.A.P. holds current research grants with AstraZeneca and BMS. Omniscope has filed a patent related to the application of the FixNCut protocol. All other authors declare no competing interests.

Figures

Fig. 1
Fig. 1
FixNCut protocol in human peripheral blood mononuclear cells (PBMCs). a Mapping analysis of sequencing reads within a genomic region. b Comparative analysis of the number of detected genes (top) and UMIs (bottom) across various sequencing depths. c Cumulative gene counts analyzed using randomly sampled cells. d Principal component analysis (PCA) and uniform manifold approximation and projection (UMAP) representation of gene expression profile variances of fresh and fixed samples. e, f Linear regression model comparing average gene expression levels of expressed genes (e) and main biological hallmarks, including apoptosis, hypoxia, reactive oxygen species (ROS), cell cycle G2/M checkpoint, unfolded protein response (UPR), and inflammatory response genes (f). The coefficient of determination (R2) computed with Pearson correlation and the corresponding p-value are indicated. g UMAP visualization of 17,483 fresh and fixed PBMCs, colored by 19 cell populations. h Comparison of cell population proportions between fresh (n = 9754) and fixed (n = 7729) PBMCs with the Bayesian model scCODA. Asterisks (*) indicate credible changes. i Differential gene expression analysis between fresh and fixed samples. The top differentially expressed genes (DEGs) with significant adjusted p-values (FDR) < 0.05, upregulated (red), and downregulated (blue) with Log2FC > |1| are indicated. j Violin plot of ex-vivo blood handling gene signature score [19] for fresh and fixed human PBMCs. Statistical analysis between fixed and fresh cells was performed using the Wilcoxon signed-rank test. k Dotplot showing the average expression of sampling-time DEGs for Fresh (y-axis) for all 19 cell types (x-axis) split by protocol. The dot size reflects the percentage of cells in a cluster expressing each gene, and the color represents the average expression level
Fig. 2
Fig. 2
FixNCut protocol tested in mouse lung samples. a Mapping analysis of sequencing reads within a genomic region. b Comparative analysis of the number of detected genes (top) and UMIs (bottom) across various sequencing depths. c Cumulative gene counts analyzed using randomly sampled cells. d Principal component analysis (PCA) and uniform manifold approximation and projection (UMAP) representation of gene expression profile variances of fresh and fixed samples. e Linear regression model comparing average gene expression levels of expressed genes between protocols. The coefficient of determination (R2) computed with Pearson correlation is indicated. f Hierarchical clustering of coefficient of determination (R2) obtained for all pair comparisons between protocols for biological hallmarks, including apoptosis, hypoxia, reactive oxygen species (ROS), cell cycle G2/M checkpoint, unfolded protein response (UPR), and inflammatory response genes. g UMAP visualization of 19,606 fresh and fixed mouse lung cells, colored by 20 cell populations. h Comparison of cell population proportions between fresh (n = 10,289) and fixed cells (n = 9317). The top figure shows the difference in cell population proportions between fresh and fixed samples, and the bottom figure shows the results of the compositional cell analysis using the Bayesian model scCODA. Asterisks (*) indicate credible changes, upregulated for the fresh sample. i Differential gene expression analysis between fresh and fixed samples. The top differentially expressed genes (DEGs) with significant adjusted p-values (FDR) < 0.05, upregulated (red), and downregulated (blue) with Log2FC > |1| are indicated
Fig. 3
Fig. 3
FixNCut protocol tested in mouse colon samples. a Mapping analysis of sequencing reads within a genomic region. b Comparative analysis of the number of detected genes (top) and UMIs (bottom) across various sequencing depths. c Cumulative gene counts analyzed using randomly sampled cells. d Principal component analysis (PCA), uniform manifold approximation and Projection (UMAP) prior data integration, and harmony integrated UMAP representation of gene expression profile variances of fresh and fixed samples. e, f Linear regression model comparing average gene expression levels of expressed genes (e) and biological hallmarks, including apoptosis, hypoxia, reactive oxygen species (ROS), cell cycle G2/M checkpoint, unfolded protein response (UPR), and inflammatory response genes (f). The coefficient of determination (R2) computed with Pearson correlation and the corresponding p-values are indicated. g UMAP visualization of 14,387 fresh and fixed mouse colon cells, colored by 16 cell populations. h Comparison of cell population proportions between fresh (n = 6009) and fixed (n = 8378) mouse colon samples with the Bayesian model scCODA. Asterisks (*) indicate credible changes, upregulated for the fixed sample. i Differential gene expression analysis between fresh and fixed samples. The top differentially expressed genes (DEGs) with significant adjusted p-values (FDR) < 0.05, upregulated (red), and downregulated (blue) with Log2FC > |1| are indicated
Fig. 4
Fig. 4
Long-term storage of fixed mouse lung samples. a Mapping analysis of sequencing reads within a genomic region. b Comparative analysis of the number of detected genes (top) and UMIs (bottom) across various sequencing depths. c Cumulative gene counts analyzed using randomly sampled cells. d Principal component analysis (PCA) and uniform manifold approximation and projection (UMAP) representation of gene expression profile variances of fixed, cryopreserved, and fixed/cryopreserved samples. e Linear regression model comparing average gene expression levels of expressed genes across protocols used. The coefficient of determination (R2) computed with Pearson correlation is indicated. f Hierarchical clustering of coefficient of determination (R2) obtained for all pair comparisons across protocol for biological hallmarks, including apoptosis, hypoxia, reactive oxygen species (ROS), cell cycle G2/M checkpoint, unfolded protein response (UPR), and inflammatory response genes. g UMAP visualization of 24,291 fixed, cryo, and fixed/cryo mouse lung cells, colored by 20 cell populations. h Comparison of cell population proportions between fixed (n = 10,256), cryopreserved (n = 8609), and fixed/cryopreserved cells (n = 5426). The top figure shows the difference in cell population proportions between fixed, cryo, and fixed/cryo samples, and the bottom figure shows the results of the compositional cell analysis using the Bayesian model scCODA. Credible changes and Log2FC are indicated. i Differential gene expression analysis across conditions: fixed vs cryo (top-left), fixed/cryo vs cryo (top-right), and fixed/cryo vs fixed (bottom). The top differentially expressed genes (DEGs) with significantly adjusted p-values (FDR) < 0.05, upregulated (red), and downregulated (blue) with Log2FC > |1| are indicated
Fig. 5
Fig. 5
Minimization of technical artifacts using FixNCut protocol on mouse tissues. This figure shows the impact of various dissociation-induced gene signature scores, including dissociation on mouse muscle stem cells [22], warm dissociation on mouse kidney samples [3], and warm collagenase dissociation on mouse primary tumors and patient-derived mouse xenografts [2], across mouse tissues and processing protocols used. All statistical analyses between protocols were performed using the Wilcoxon signed-rank test; significance results are indicated with the adjusted p-value, either with real value or approximate result (ns, p > 0.05, *p ≤ 0.05, **p ≤ 0.01, ***p ≤ 0.001, ****p ≤ 0.0001). a Violin plots of dissociation-induced gene signatures scores for fresh and fixed mouse lung. b Score of warm collagenase gene signature for fresh and fixed mouse lung samples across cell populations. c Overlap of differentially expressed genes in the fresh and fixed mouse lung sample with genes from the three dissociation-induced signatures. d Violin plots of dissociation-induced gene signatures scores for fresh and fixed mouse colon. e Score of warm collagenase gene signature for fresh and fixed mouse colon samples across cell populations. f Overlap of differentially expressed genes in the fresh and fixed mouse colon sample with genes from the three dissociation-induced signatures. g Violin plots of dissociation-induced gene signatures scores for cryo and fixed/cryo mouse lung. h Score of warm collagenase gene signature for cryo and fixed/cryo mouse lung samples across cell populations. i Overlap of differentially expressed genes in the cryopreserved and Fixed/Cryo mouse lung sample with genes from the three dissociation-induced signatures
Fig. 6
Fig. 6
FixNCut protocol tested in human colon biopsies. a Mapping analysis of sequencing reads within a genomic region. b Comparative analysis of the number of detected genes (top) and UMIs (bottom) across various sequencing depths. c Cumulative gene counts analyzed using randomly sampled cells. d Principal component analysis (PCA) and uniform manifold approximation and projection (UMAP) representation of gene expression profile variances prior data integration, and harmony integrated UMAP representation of gene expression profile variances of fresh, fixed, cryopreserved, and fixed/cryopreserved samples. e Linear regression model comparing average gene expression levels of expressed genes across protocols used. The coefficient of determination (R2) computed with Pearson correlation is indicated. f Hierarchical clustering of coefficient of determination (R2) obtained for all pair comparisons across protocols for biological hallmarks, including apoptosis, hypoxia, reactive oxygen species (ROS), cell cycle G2/M checkpoint, unfolded protein response (UPR), and inflammatory response genes. g UMAP visualization of 17,825 fresh, fixed, cryopreserved, and fixed/cryopreserved human colon cells, colored by 21 cell populations. h Comparison of cell population proportions between fresh (n = 5759), fixed (n = 4250), cryo (n = 3489), and fixed/cryo (n = 4327) cells. The bottom figure shows the results of compositional cell analysis using the Bayesian model scCODA. Credible changes and Log2FC are indicated. i Differential gene expression analysis across conditions: fixed vs fresh (top-left), fixed vs cryo (top-right), fixed/cryo vs cryo (bottom-left), and fixed/cryo vs fixed (bottom-right). Significant adjusted p-values (FDR) < 0.05, upregulated (red), and downregulated (blue) genes with Log2FC > |1| are indicated. The top DE genes are included in the plot. j Violin plots for stress-related gene signature score [2, 3, 22] for human colon biopsies across protocols. Statistical analysis between protocols was performed using the Wilcoxon signed-rank test
Fig. 7
Fig. 7
Fluorescent antibody labeling of membrane proteins in fixed cells and tissues in mouse and human. a Representative gating strategy of one experiment analyzed by flow cytometry with cryopreserved and cryopreserved+fixed PBMCs from healthy donors (n  =  3). PBMCs were stained with anti-human CD45, CD3, CD19, CD4, and CD8 monoclonal antibodies (mAbs). T cells were selected by the positive expression of CD3, whereas B cells were selected from the CD3-negative fraction (Non T cells) and by the positive expression of CD19. CD4-positive and CD8-positive T cells were selected from CD3-positive T cells. Box plots show the percentage of positive cells in each subpopulation for cryo (blue) and cryo+fixed (orange) PBMCs analyzed by flow cytometry. b Representative histograms of the mean fluorescent intensity (MFI) with cryopreserved and cryopreserved+fixed PBMCs from healthy donors (n = 3) stained with anti-human CD45, CD3, CD19, CD4, and CD8 mAbs. Bar plots show the MFI expression for three fresh and fixed PBMC samples analyzed by flow cytometry. c, d Representative histograms of MFI of fresh and fixed PBMCs from healthy donors (n = 4) stained with anti-human CD45, CD3, CD4, and CD8 mAbs, anti-β2M, anti-CD298, and LMOs analyzed by flow cytometry. f Representative histograms of the MFI from cryopreserved (blue) and cryopreserved+fixed (orange) human colon samples processed and stained with anti-human CD45, CD3, CD11b, and EpCAM mAbs and analyzed by flow cytometry. g Multiplex fluorescence tissue imaging of a human prostate cancer section, DSP-fixed (top) or formalin-fixed (bottom) paraffin-embedded, captured using Phenocycler. Images show hematoxylin and eosin staining, five-color overlay, and individual SMA, Pan-CK, E-cadherin, and p63 antibody staining

Similar articles

Cited by

References

    1. Ziegenhain C, Vieth B, Parekh S, Hellmann I, Enard W. Quantitative single-cell transcriptomics. Brief Funct Genomics. 2018;17:220–232. doi: 10.1093/bfgp/ely009. - DOI - PMC - PubMed
    1. O’Flanagan CH, Campbell KR, Zhang AW, Kabeer F, Lim JLP, Biele J, et al. Dissociation of solid tumor tissues with cold active protease for single-cell RNA-seq minimizes conserved collagenase-associated stress responses. Genome Biol. 2019;20:210. doi: 10.1186/s13059-019-1830-0. - DOI - PMC - PubMed
    1. Denisenko E, Guo BB, Jones M, Hou R, de Kock L, Lassmann T, et al. Systematic assessment of tissue dissociation and storage biases in single-cell and single-nucleus RNA-seq workflows. Genome Biol. 2020;21:130. doi: 10.1186/s13059-020-02048-6. - DOI - PMC - PubMed
    1. Massoni-Badosa R, Iacono G, Moutinho C, Kulis M, Palau N, Marchese D, et al. Sampling time-dependent artifacts in single-cell genomics studies. Genome Biol. 2020;21:112. doi: 10.1186/s13059-020-02032-0. - DOI - PMC - PubMed
    1. Marsh SE, Walker AJ, Kamath T, Dissing-Olesen L, Hammond TR, de Soysa TY, et al. Dissection of artifactual and confounding glial signatures by single-cell sequencing of mouse and human brain. Nat Neurosci. 2022;25:306–316. doi: 10.1038/s41593-022-01022-8. - DOI - PMC - PubMed

Publication types