. 2024 Jul;13(17):e2304150.
doi: 10.1002/adhm.202304150. Epub 2024 Mar 30.

MANNosylation of Mesoporous Silica Nanoparticles Modifies TLR4 Localization and NF-κB Translocation in T24 Bladder Cancer Cells

Affiliations

MANNosylation of Mesoporous Silica Nanoparticles Modifies TLR4 Localization and NF-κB Translocation in T24 Bladder Cancer Cells

Mariam Hohagen et al. Adv Healthc Mater. 2024 Jul.

Abstract

D-mannose is widely used as non-antibiotic treatment for bacterial urinary tract infections. This application is based on a well-studied mechanism of binding to the type 1 bacterial pili and, therefore, blocking bacteria adhesion to the uroepithelial cells. To implement D-mannose into carrier systems, the mechanism of action of the sugar in the bladder environment is also relevant and requires investigation. Herein, two different MANNosylation strategies using mesoporous silica nanoparticles (MSNs) are described. The impact of different chemical linkers on bacterial adhesion and bladder cell response is studied via confocal microscopy imaging of the MSN interactions with the respective organisms. Cytotoxicity is assessed and the expression of Toll-like receptor 4 (TLR4) and caveolin-1 (CAV-1), in the presence or absence of simulated infection with bacterial lipopolysaccharide (LPS), is evaluated using the human urinary bladder cancer cell line T24. Further, localisation of the transcription factor NF-κB due to the MANNosylated materials is examined over time. The results show that MANNosylation modifies bacterial adhesion to the nanomaterials and significantly affects TLR4, caveolin-1, and NF-κB in bladder cells. These elements are essential components of the inflammatory cascade/pathogens response during urinary tract infections. These findings demonstrate that MANNosylation is a versatile tool to design hybrid nanocarriers for targeted biomedical applications.

Keywords: Caveolin 1; MSNs; TLR4; UTIs; bladder cells; immunomodulation; mannose.


Conflict of interest statement

The authors declare no conflict of interest.

Figures

Figure 1
Figure 1
A) Reaction scheme for the two different MANNosylation methods. B) TEM images of the non‐functionalized native DMSNs (i,ii), DMSN‐NCO‐man (iii,iv), and DMSN‐phenyl‐man (v,vi).
Figure 2
Figure 2
A,C) Solid‐state 29Si CP/MAS NMR spectra of MANNosylated materials DMSN‐NCO‐man and DMSN‐phenyl‐man, respectively. B,D) Solid‐state 13C CP/MAS NMR spectra of DMSN‐NCO‐man and DMSN‐phenyl‐man, respectively. The signals marked in green correspond to the units of the mannose molecule and those in red correspond to the silane linker, and in blue, for the spacer in the case of the DMSN‐phenyl‐man material. The particles are represented much smaller than their actual size for space reasons.
Figure 3
Figure 3
Cell viability assay in the presence of different MANNosylated particles as measured by metabolic activity (cell titer blue assay) in T24 cells after incubation for 24 h. Experiments were performed in technical quadruplicates in at least three independent cell preparations. * Indicates significant difference in comparison to controls (Ctrl.) (* p < 0.05; ** p < 0.01; *** p < 0.001). Data are expressed as T/C.
Figure 4
Figure 4
Quantification of the signal intensity of A) TLR4 and B) CAV‐1 performed after 24 h of incubation with free mannose, DMSN‐NCO‐man, and DMSN‐phenyl‐man in the concentrations of 0.1–10 µm [mannose] and non‐modified DMSNs (equivalent to 0.1 µm [mannose]) (2.57 µg mL−1). Data were obtained by the quantification of n > 25 regions of interest (ROIs) obtained from at least three independent cell preparations and expressed as mean fluorescence of relative fluorescence units (r.f.u.). * indicates significant difference in comparison to DMSNs in the concentration of 0.1 µm (* p < 0.05; ** p < 0.01; *** p < 0.001) and § indicates significant difference in comparison to the control (§ p < 0.05; §§ p < 0.01; §§§ p < 0.001). The complete statistical evaluation among the conditions can be found in Figure S9, Supporting Information. The significance was determined via one‐way ANOVA with Fisher LSD.
Figure 5
Figure 5
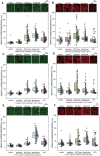
Representative images collected during the immunofluorescence experiments (TLR4, [A,C,E] in green and CAV‐1, [B,D,F] in red). Quantification of the signal intensity of TLR4 and CAV‐1 performed after 24 h of incubation with DMSN‐NCO‐man, DMSN‐phenyl‐man, free mannose, LPS, and controls. Characterization of the differential behaviors mimicking the presence of the infection via co‐incubation (material + LPS) (A,B), the presence of the material followed by the pro‐inflammatory treatment: 1. Material, 2. LPS (C,D), and finally, 1. LPS and 2. Material (E,F). Data were obtained by the quantification of n > 25 regions of interest (ROIs) obtained from at least three independent cell preparations and expressed as mean fluorescence of relative fluorescence units (r.f.u.). * indicates significant difference in comparison to the control (* p < 0.05; ** p < 0.01; *** p < 0.001). The complete statistical evaluation can be viewed in Figure S12, Supporting information. The significance was determined via one‐way ANOVA with Fisher LSD.
Figure 6
Figure 6
Representative images collected during the experiments of NF‐κB localization (in red); incubation with free mannose as the control, DMSN‐NCO‐man, DMSN‐phenyl‐man in a concentration of 10 µm [mannose], LPS (1 ng mL−1), and non‐modified DMSNs (equivalent to 0.1 µm [mannose]) (2.57 µg mL−1) for A) 3 h, B) 6 h, and C) 24 h.
Figure 7
Figure 7
Quantification of the signal intensity of the NF‐κB transcription factor, in A,C,E) cytoplasm and in B,D,F) nucleus, was performed after 3 h (A,B), 6 h (C,D), and 24 h (E,F) of incubation with the control free mannose, DMSN‐NCO‐man, and DMSN‐phenyl‐man in a concentration of 10 µm [mannose], LPS (1 ng mL−1), and non‐modified DMSNs (equivalent to 0.1 µm [mannose]) (2.57 µg mL−1). The data were obtained by the quantification of n > 25 regions of interest (ROIs) obtained from at least three independent cell preparations and expressed as mean fluorescence of relative fluorescence units (r.f.u.). * indicates significant difference in comparison to the control (*p <0.05; **p <0.01; ***p <0.001). The complete statistical evaluation can be viewed in Figure S13, Supporting Information. The significance was determined via one‐way ANOVA with Fisher LSD.
Figure 8
Figure 8
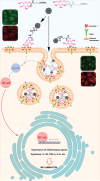
Schematic overview of particle functionalization and stimulation of the TLR4 receptor where the stimulation of DMSN‐phenyl‐man materials causes the formation of small vesicle‐like structures, possibly related to the uptake or increased turnover of the receptor. Whereas, when treated with DMSN‐NCO‐man, the signal pattern is rather evenly distributed. TLR4 translocation through the MANNosylated materials leads to the activation of NF‐κB proteins. The NF‐κB transcription factor in its inactive form is found in the cytosol and moves throughout activation into the nucleus, where the transcription of cytokines, responsible for activation of immune responses, is taking place.
Figure 9
Figure 9
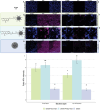
Representative fluorescence images of S. enterica expressing A) type 1 fimbrae alone, B) incubated with DMSN‐NCO‐man‐FITC, C) incubated with DMSN‐phenyl‐man‐FITC, and D) incubated with DMSN‐FITC, and E) S. enterica cells not expressing type 1 fimbrae alone, F) fimbriated bacteria incubated with DMSN‐NCO‐man‐FITC, G) DMSN‐phenyl‐man‐FITC, and H) DMSN‐FITC. Bacterial cells are represented in blue (SYTO 62) and DMSNs in magenta (FITC). Scale bars represent 25 µm. I) Attachment of DMSNs to fimbriated and non‐fimbriated bacteria measured by fluorescence spatial correlation. Bars represent the mean value of the ratio of fluorescence intensity between FITC signal co‐localized with SYTO 62 signal and FITC background signal. Error bars correspond to 95% confidence intervals. Letters (a–d) represent significantly different groups (p value < 0.05). Biological duplicates were used, and incubations were conducted in technical triplicates.
Figure 10
Figure 10
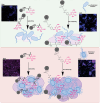
A) Schematic overview of the attachment of MANNosylated DMSNs to non‐fimbriated (light green [top]) and fimbriated (light red [bottom]) bacteria. The magnitude of adhesion is visualized by the size and the color intensity of a purple cloud. Incubation with DMSN‐NCO‐man shows a selective attachment to fimbriated bacteria whereas for the DMSN‐phenyl‐man material no selectivity is observed.

Similar articles

Cited by

References

    1. Fan E., Dashti M., Fuentes J., Reitzer L., Christie A. L., Zimmern P. E., Neurourol. Urodyn. 2022, 42, 49. - PubMed
    1. Kranjcec B., Papes D., Altarac S., World J. Urol. 2013, 32, 79. - PubMed
    1. Konesan J., Liu L., Mansfield K. J., Pathogens 2022, 11, 1471. - PMC - PubMed
    1. Barea B. M., Veeratterapillay R., Harding C., Curr. Opin. Urol. 2020, 30, 845. - PubMed
    1. Foo L. Y., Lu Y., Howell A. B., Vorsa N., J. Nat. Prod. 2000, 63, 1225. - PubMed