. 2024 Aug 5;26(8):1509-1525.
doi: 10.1093/neuonc/noae066.

The oncolytic adenovirus Delta-24-RGD in combination with ONC201 induces a potent antitumor response in pediatric high-grade and diffuse midline glioma models

Affiliations

The oncolytic adenovirus Delta-24-RGD in combination with ONC201 induces a potent antitumor response in pediatric high-grade and diffuse midline glioma models

Daniel de la Nava et al. Neuro Oncol. .

Abstract

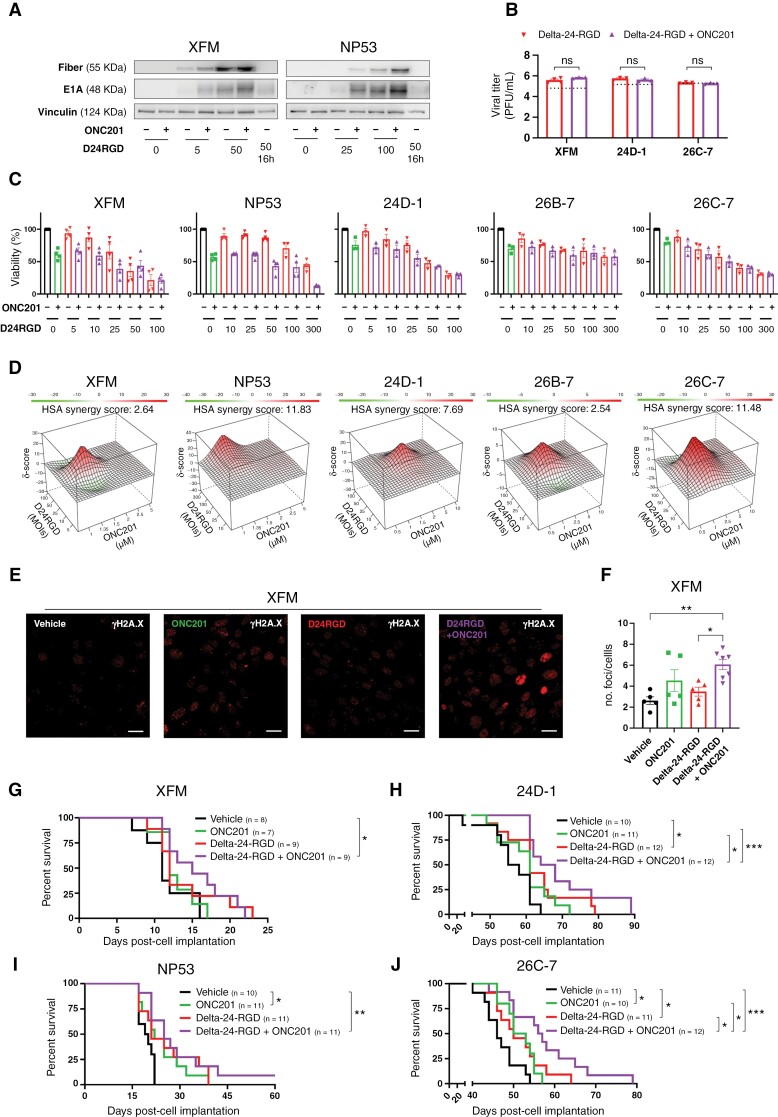
Background: Pediatric high-grade gliomas (pHGGs), including diffuse midline gliomas (DMGs), are aggressive pediatric tumors with one of the poorest prognoses. Delta-24-RGD and ONC201 have shown promising efficacy as single agents for these tumors. However, the combination of both agents has not been evaluated.

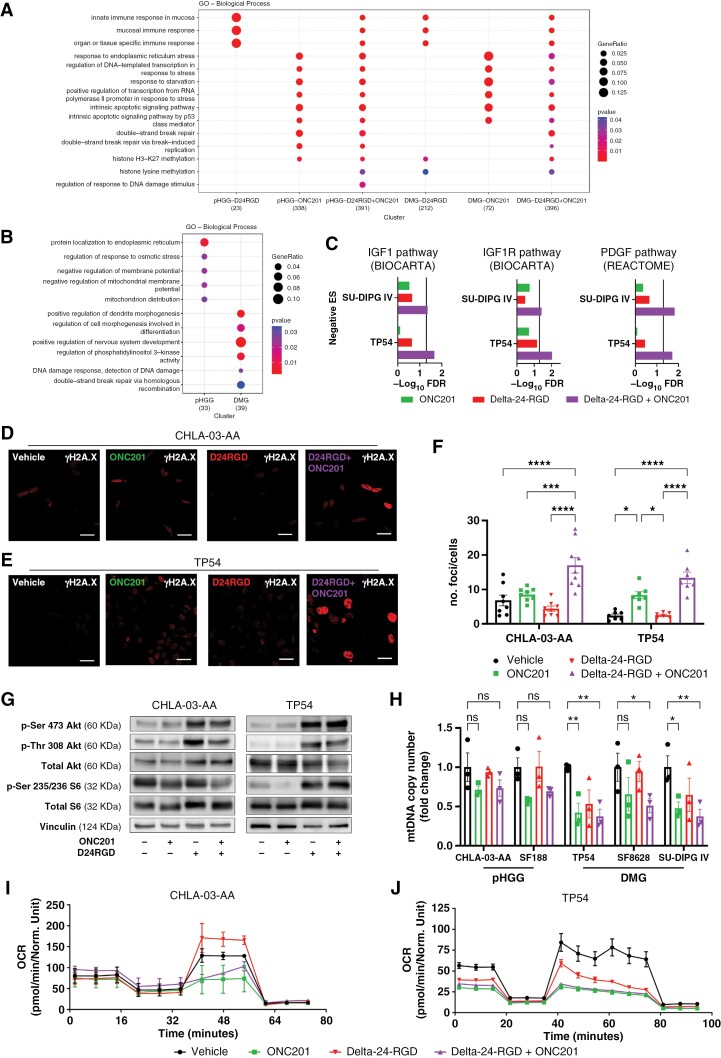
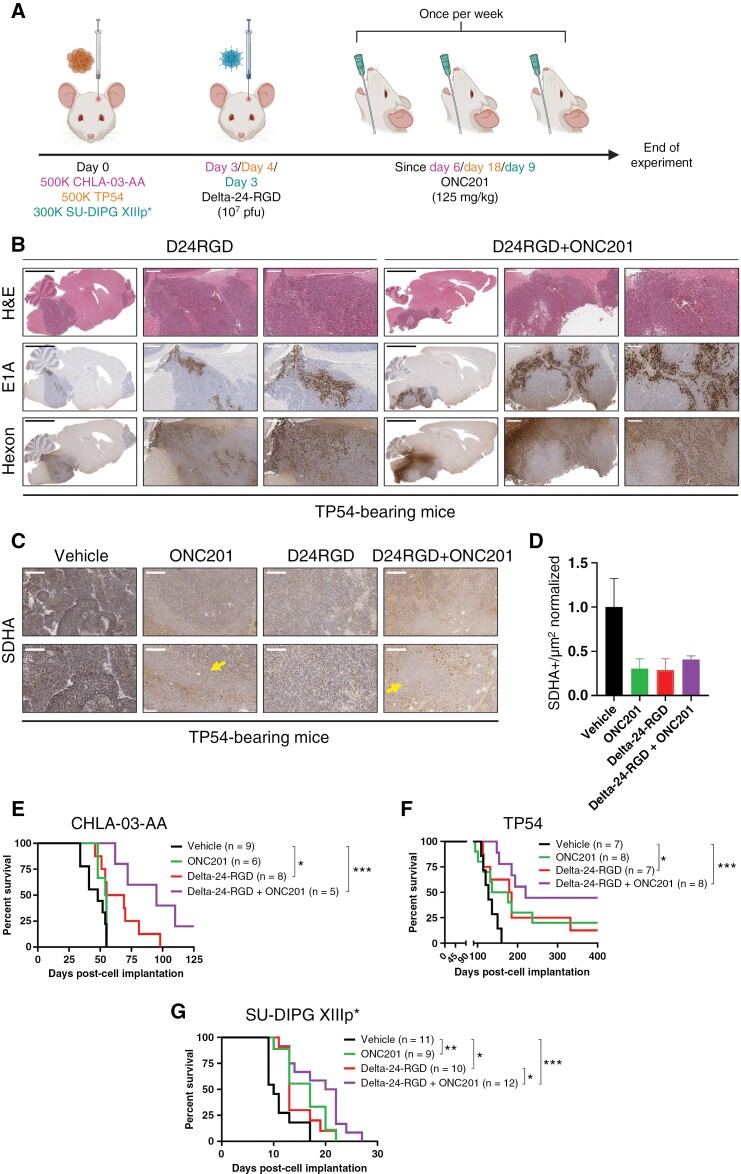
Methods: The production of functional viruses was assessed by immunoblotting and replication assays. The antitumor effect was evaluated in a panel of human and murine pHGG and DMG cell lines. RNAseq, the seahorse stress test, mitochondrial DNA content, and γH2A.X immunofluorescence were used to perform mechanistic studies. Mouse models of both diseases were used to assess the efficacy of the combination in vivo. The tumor immune microenvironment was evaluated using flow cytometry, RNAseq, and multiplexed immunofluorescence staining.

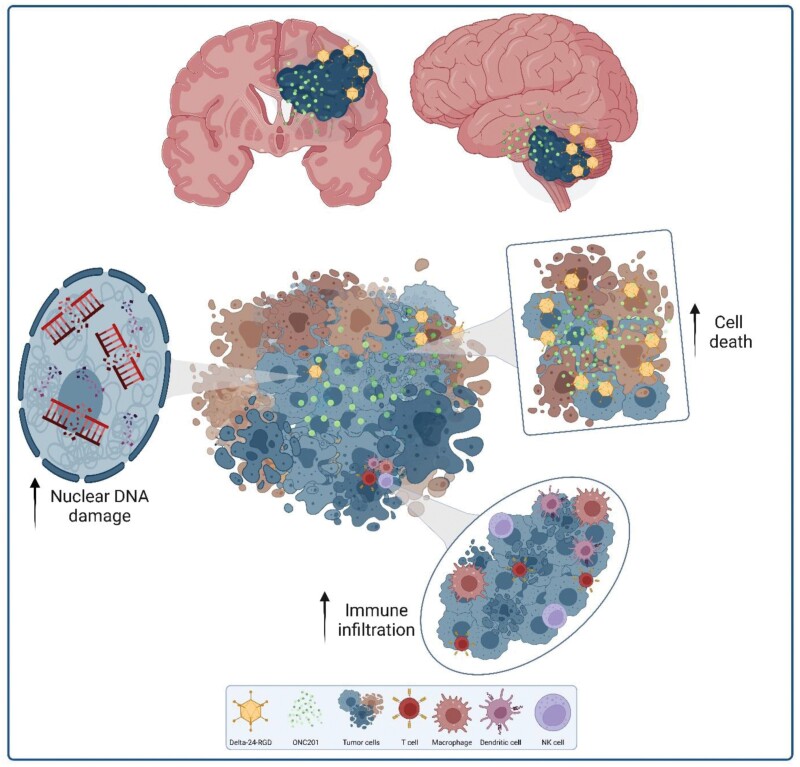
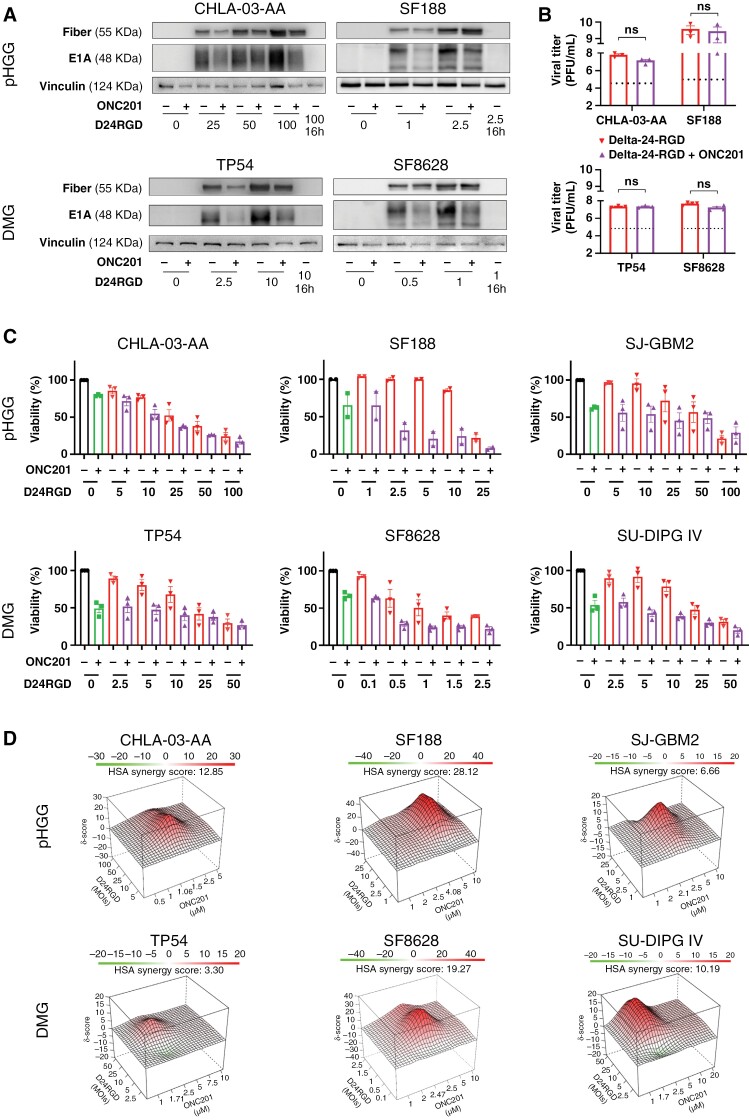
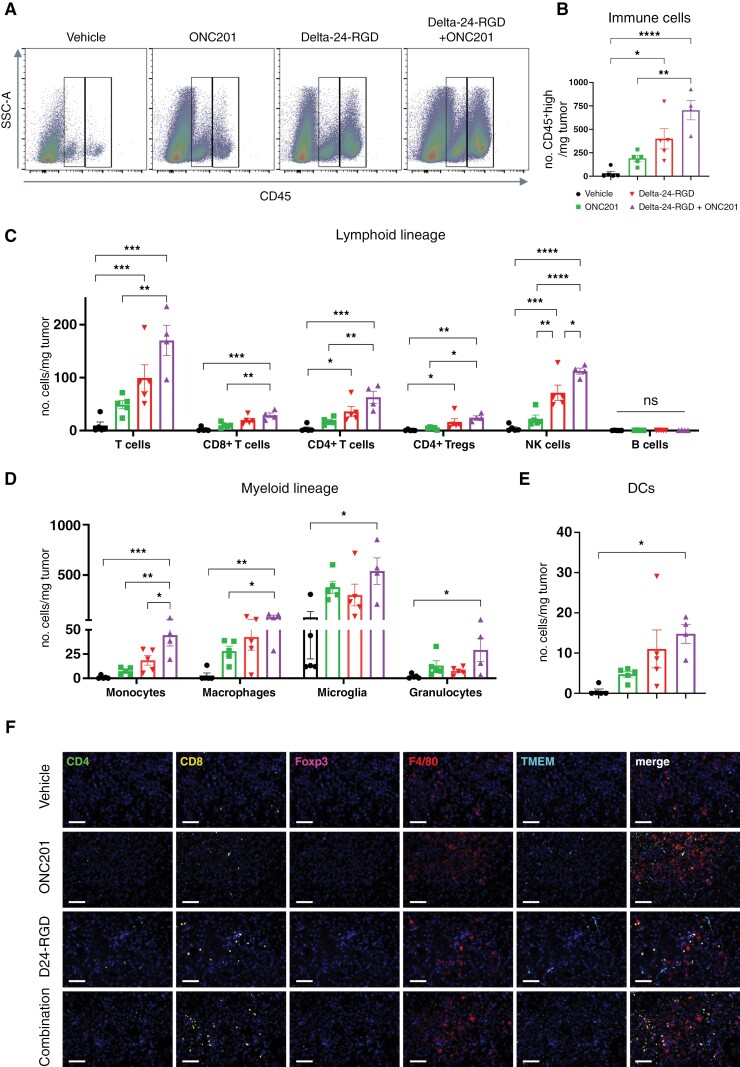
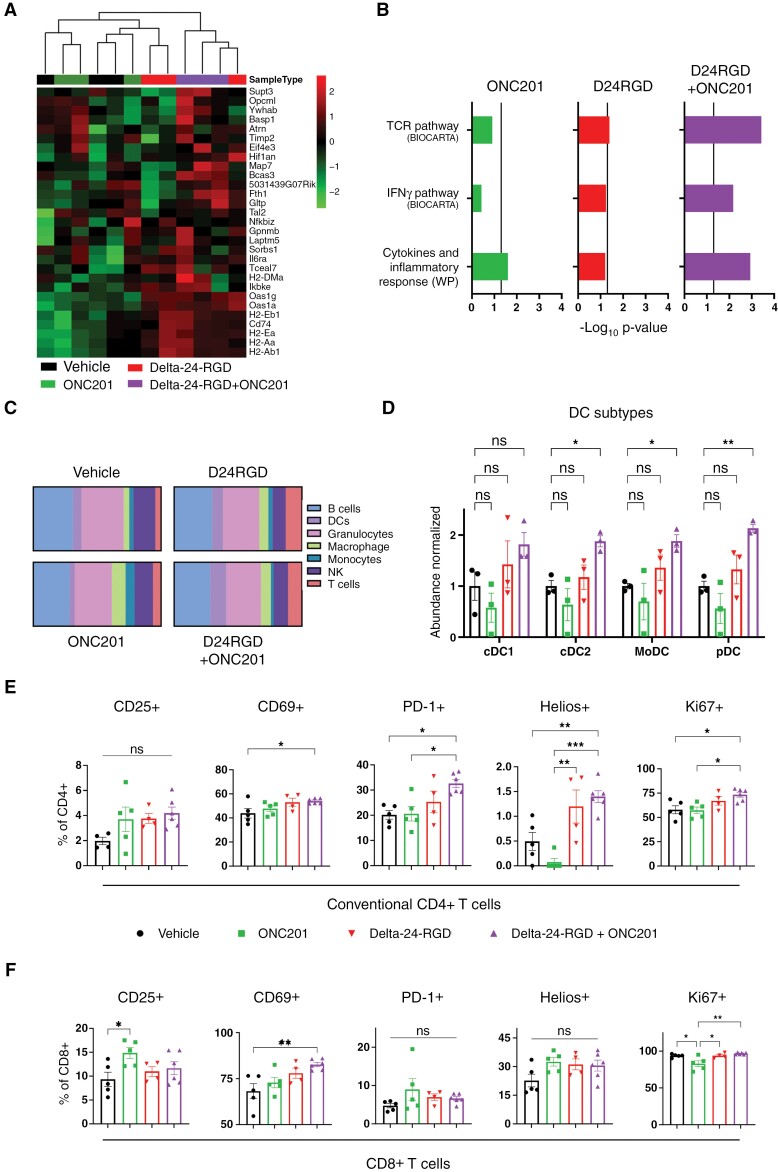
Results: The Delta-24-RGD/ONC201 combination did not affect the virus replication capability in human pHGG and DMG models in vitro. Cytotoxicity analysis showed that the combination treatment was either synergistic or additive. Mechanistically, the combination treatment increased nuclear DNA damage and maintained the metabolic perturbation and mitochondrial damage caused by each agent alone. Delta-24-RGD/ONC201 cotreatment extended the overall survival of mice implanted with human and murine pHGG and DMG cells, independent of H3 mutation status and location. Finally, combination treatment in murine DMG models revealed a reshaping of the tumor microenvironment to a proinflammatory phenotype.

Conclusions: The Delta-24-RGD/ONC201 combination improved the efficacy compared to each agent alone in in vitro and in vivo models by potentiating nuclear DNA damage and in turn improving the antitumor (immune) response to each agent alone.

Keywords: DMGs; Delta-24-RGD; ONC201; immunovirotherapy; pHGGs.


Conflict of interest statement

JEA is an employee and shareholder of Chimerix and has ownership (including patents) regarding ONC201. The rest of the authors do not have potential conflicts of interest to disclose.

Figures

Graphical Abstract
Graphical Abstract
Figure 1.
Figure 1.
(A) The levels of early (E1A) and late (Fiber) viral proteins in the absence/presence of ONC201 and Delta-24-RGD in human pHGG (CHLA-03-AA, SF188) and DMG (TP54, SF8628) cells were assessed by immunoblotting 72 hours after treatment. Delta-24-RGD numbers indicate the multiplicity of infection (MOI) used. ONC201 treatment was given at the IC50 dosage. (B) Total infection titers of Delta-24-RGD in the absence/presence of ONC201 72 hours after treatment in pHGG (CHLA-03-AA, SF188) and DMG (TP54, SF8628) cells were quantified by an anti-hexon staining-based method. Cells were treated at the following Delta-24-RGD dosages: CHLA-03-AA: 5 PFU/cell; SF188: 2.5 PFU/cell; TP54: 10 PFU/cell; and SF8628: 0.5 PFU/cell. ONC201 treatment was given at the IC50 dosage. Horizontal dotted lines indicate the input virus. Data are shown in logarithm format and as the mean ± SEM. At least 3 biological replicates were performed for each condition. The Mann–Whitney test was performed for statistical analysis. ns, not significant. (C) Effects on viability of Delta-24-RGD ± ONC201 in human pHGG (CHLA-03-AA, SF188, and SJ-GBM2) and DMG (TP54, SF8628, and SU-DIPG IV) cells. Cells were treated with increasing MOIs of Delta-24-RGD in the absence or presence of ONC201 (at IC75-50). At least 2 biological replicates were performed for each cell line. (D) 3D-synergy maps of data from C, analyzed by the Highest Single Agent (HSA) logarithm. An HSA overall score > 10 represents strong synergy; a 0 < HSA overall score < 10 represents additivity.
Figure 2.
Figure 2.
(A) Gene ontology families enriched in the human pHGG and DMG cell lines following Delta-24-RGD, ONC201, and combination treatment compared with vehicle. The results were obtained from RNAseq data (GSE255972). (B) Gene ontology families enriched in the Delta-24-RGD/ONC201 combination group compared with each individual treatment group in human pHGG and DMG cell lines. (C) GSEA (negative enriched) of transcriptomic signatures in human DMG cell lines after ONC201 and/or Delta-24-RGD treatment. Vertical line indicates statistical significance (−Log10 0.05). (D) and (E) Representative immunofluorescence images of γH2AX levels in CHLA-03-AA (D) and TP54 (E) cells 48 hours after Delta-24-RGD and/or ONC201 treatment. Scale bars: 25 μm. (F) Quantification of no. foci/no. cells from D and E. Data are shown as the mean ± SEM. At least 6 independent images were quantified from 2 experimental replicates. One-way ANOVA was performed for statistical analysis. *P < .05, ***P < .001, ****P < .0001. G. Assessment of the mTORC1 pathway in pHGG (CHLA-03-AA) and DMG (TP54) cell lines 48 hours after Delta-24-RGD, ONC201 or combination treatment. H. Relative mtDNA level in pHGG (CHLA-03, SF188) and DMG (TP54, SF8628, SU-DIPG IV) cells for 24 hours after ONC201 and/or Delta-24-RGD treatment. Data are shown normalized versus “vehicle” and as the mean ± SEM. Three biological replicates were performed for each cell line. Two-way ANOVA was performed for statistical analysis. *P < .05, **P < .01. Cells were treated with Delta-24-RGD at the IC50 of ONC201 and 10 PFU/cell for Figure 2D to H. I and J. Seahorse extracellular flux analysis showing the OCR in CHLA-03-AA (I) and TP54 (J) cells 24 hours after ONC201 and/or Delta-24-RGD treatment. Three experimental replicates were performed for each condition. The Delta-24-RGD dosage was 25 PFU/cell (CHLA-03-AA) or 15 PFU/cell (TP54), and ONC201 was given at the IC50 for both cell lines.
Figure 3.
Figure 3.
(A) Treatment schedule for immunosuppressed, human orthotopic-bearing mouse models (CHLA-03-AA, TP54, and SU-DIPG-XIIIp*). (B) Representative immunostaining images of brain samples from TP54-bearing mice at the sacrifice time. H&E was used to confirm tumor presence, and E1A and Hexon were used as adenovirus markers. Scale bars: 3 mm, 500 µm and 250 µm. (C) Representative images of SDHA staining from TP54-bearing mice at the sacrifice time. Scale bars: 300 µm (upper panels), and 150 µm (bottom panels). D. Quantification of SDHA staining in TP54-bearing mice and represented as SDHA+/µm2 normalized ratio. Arrows indicate regions without SDHA staining. Scale bar: 200 µm. (E), (F) and (G). Survival curve analysis after cell implantation following the sacrifice of CHLA-03-AA (E), TP54 (F), and SU-DIPG-XIIIp*(G)-bearing mice. The log-rank (Mantel–Cox) test was performed for statistical analysis. The numbers of mice in each group appear in brackets. *P < .05, **P < .01, ***P < .001.
Figure 4.
Figure 4.
(A) Assessment of the levels of early (E1A) and late (Fiber) viral proteins in murine DMG (XFM or NP53) cells in the absence/presence of ONC201 following Delta-24-RGD treatment by immunoblotting. Delta-24-RGD numbers indicate the multiplicity of infections used. ONC201 treatment was given at the IC50 dosage. (B) Quantification of total infection titers of Delta-24-RGD in XFM, 24D-1, and 26C-7 cells by an anti-hexon staining-based method in the absence/presence of ONC201. Cells were treated with the IC50 of ONC201 and 100 PFU/cell Delta-24-RGD. The horizontal dotted line indicates the input virus. Data are shown in logarithm format and as the mean ± SEM. At least 3 biological replicates were performed for each condition. The Mann–Whitney test was performed for statistical analysis. ns, not significant. (C) Effects on viability of Delta-24-RGD ± ONC201 in murine DMG (XFM, NP53, 24D-1, 26B-7, and 26C-7) cells. Cells were treated with an increasing PFU/cell Delta-24-RGD in the absence and presence of ONC201 (at IC75-50). At least 3 biological replicates were performed for each cell line. (D) 3D-synergy maps of data from C, as analyzed by the HSA logarithm. An HSA overall score > 10 represents strong synergy; 0 < HSA overall score < 10 represents additivity. (E) Representative immunofluorescence images of γH2AX in XFM cells 48 hours after Delta-24-RGD and/or ONC201 treatment. The Delta-24-RGD dosage was 10 PFU/cell, and ONC201 was given at the IC50. Scale bars: 25 μm. (F) Quantification of no. foci/no. cells from (E) Data are shown as the mean ± SEM. At least 5 independent images were quantified from 2 experimental replicates. One-way ANOVA was performed for statistical analysis. *P < .05, **P < .01. G, H, I, and J. Survival curve analysis after cell implantation following the sacrifice of XFM-(G), 24D-1-(H) NP53-(I), and 26C-7-(J) mice, respectively. The log-rank (Mantel–Cox) test was performed for statistical analysis. The numbers of mice in each group is shown in brackets. *P < .05, **P < .01, ***P < .001.
Figure 5.
Figure 5.
(A) Dot plot examples of CD45+middle (ie, microglia, left box) and CD45+high (remaining immune cells, right box) stained cells 7 days after each treatment in XFM-bearing mice, analyzed by flow cytometry. (B) Quantification of CD45+high stained cells 7 days after each treatment in XFM-bearing mice. (C) Quantification of lymphoid lineage (B cells, total T cells, NK cells, CD4+ T cells, CD8+ T cells, and CD4+ Treg cells). (D) Quantification of myeloid lineage (monocytes, macrophages, microglia, and granulocytes). (E) Quantification of dendritic cells. For B–E, data are shown as the mean ± SEM and expressed as the number of cells/mg tumor. At least 4 animals were included per group. One-way ANOVA was performed for statistical analysis. *P < .05, **P < .01, ***P < .001, ****P < .0001, ns, not significant. (F) Representative micrographs of multiplexed immunofluorescence in XFM-bearing mice tumors 7 days after each treatment immunofluorescence analysis to detect the following cell markers: CD4, CD8, Foxp3, F4/80 and TMEM119. The nuclei were counterstained with DAPI. Scale bars: 100 µm.
Figure 6.
Figure 6.
(A) Heatmap and hierarchical clustering represent the differential expression in genes that are downregulated in glioma stem cells and upregulated in oligodendrocyte differentiation., Transcriptomic data were obtained from XFM-bearing mice tumors after 7 days of each treatment. Three mice were included per group. (B) GSEA of transcriptomic signatures in treated XFM-bearing mice tumors compared with vehicle-bearing mice. Vertical line indicates statistical significance (−Log10 0.05). (C) Relative abundances (in percentages) of the different immune populations were determined by analysis of RNAseq data through the online tool ImmuCellAI-mouse. (D) Normalized abundance of type-1 and 2 conventional DCs (cDC1/2), monocyte-derived DCs (moDC), and plasmacytoid DCs (pDC). E and F. Percentage of positive populations of the indicated markers in conventional CD4+ T cells (E) and CD8+ cells (F). Immune cells were analyzed 7 days after each treatment in XFM-bearing mice and measured by flow cytometry. For D, E, and F, data are shown as the mean ± SEM, and at least 3 animals were included per group. One-way ANOVA was performed for statistical analysis. *P < .05, **P < .01, ***P < .001, ns, not significant.

References

    1. Ostrom QT, Price M, Neff C, et al.. CBTRUS statistical report: Primary brain and other central nervous system tumors diagnosed in the United States in 2015-2019. Neuro Oncol. 2022;24(5):v1–v95. - PMC - PubMed
    1. Cooney T, Lane A, Bartels U, et al.. Contemporary survival endpoints: An international diffuse intrinsic pontine glioma registry study. Neuro Oncol. 2017;19(9):1279–1280. - PMC - PubMed
    1. Kline C, Felton E, Allen IE, Tahir P, Mueller S.. Survival outcomes in pediatric recurrent high-grade glioma: Results of a 20-year systematic review and meta-analysis. J Neurooncol. 2018;137(1):103–110. - PMC - PubMed
    1. Pfister SM, Reyes-Múgica M, Chan JKC, et al.. A summary of the inaugural WHO classification of pediatric tumors: Transitioning from the optical into the molecular era. Cancer Discov. 2022;12(2):331–355. - PMC - PubMed
    1. Mackay A, Burford A, Carvalho D, et al.. Integrated molecular meta-analysis of 1,000 pediatric high-grade and diffuse intrinsic pontine glioma. Cancer Cell. 2017;32(4):520–537.e5. - PMC - PubMed

Publication types