. 2024 Jun 24;52(11):6596-6613.
doi: 10.1093/nar/gkae220.

The RNA secondary structure of androgen receptor-FL and V7 transcripts reveals novel regulatory regions

Affiliations

The RNA secondary structure of androgen receptor-FL and V7 transcripts reveals novel regulatory regions

Warren B Rouse et al. Nucleic Acids Res. .

Abstract

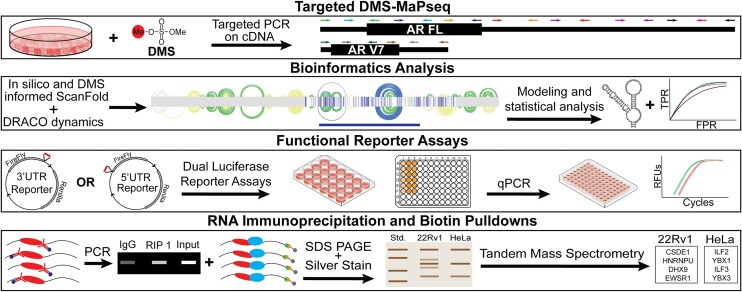
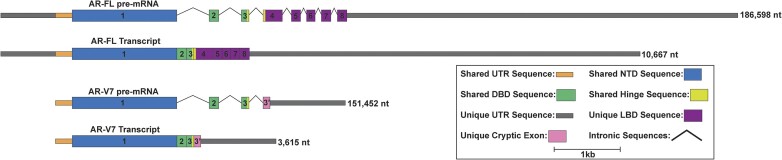
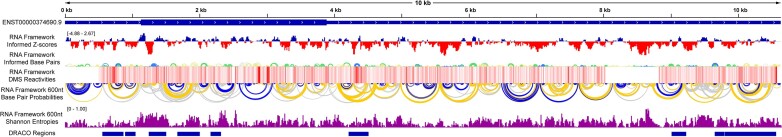
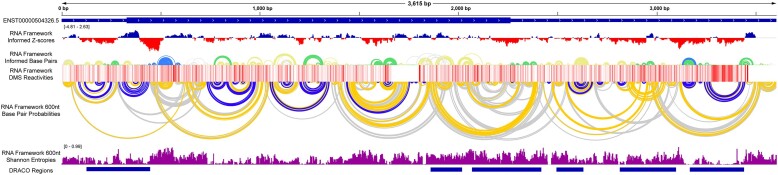
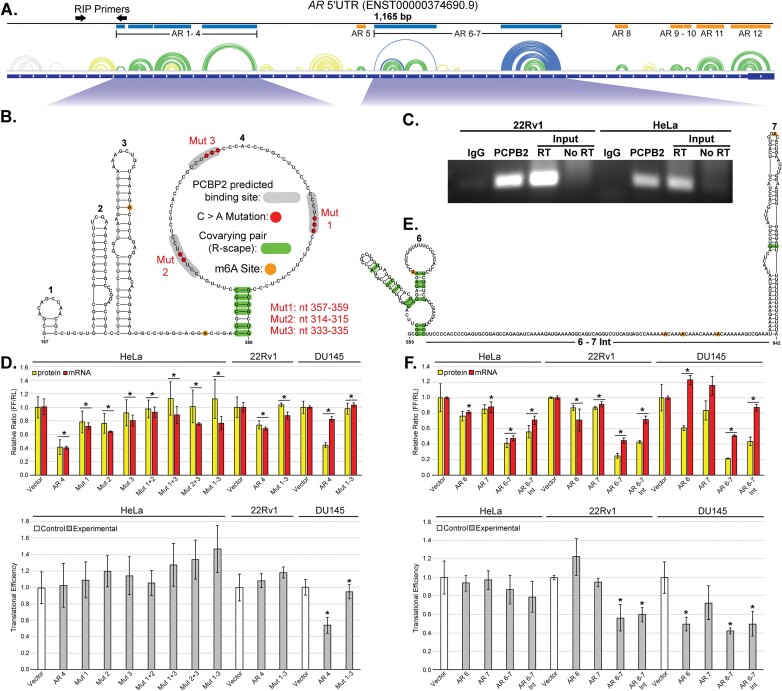
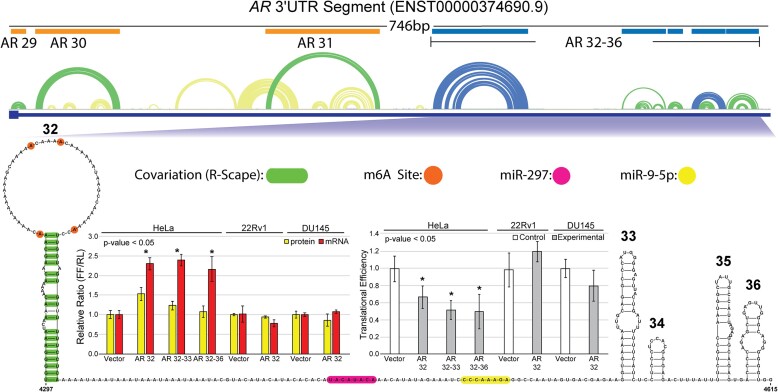
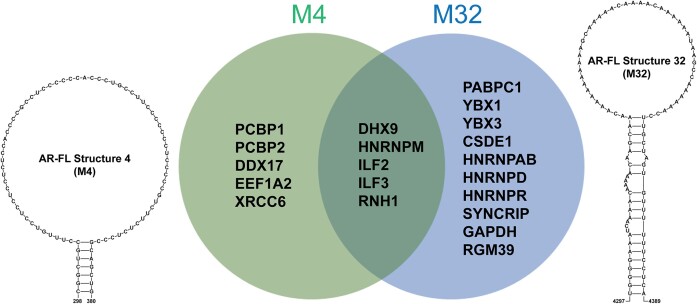
The androgen receptor (AR) is a ligand-dependent nuclear transcription factor belonging to the steroid hormone nuclear receptor family. Due to its roles in regulating cell proliferation and differentiation, AR is tightly regulated to maintain proper levels of itself and the many genes it controls. AR dysregulation is a driver of many human diseases including prostate cancer. Though this dysregulation often occurs at the RNA level, there are many unknowns surrounding post-transcriptional regulation of AR mRNA, particularly the role that RNA secondary structure plays. Thus, a comprehensive analysis of AR transcript secondary structure is needed. We address this through the computational and experimental analyses of two key isoforms, full length (AR-FL) and truncated (AR-V7). Here, a combination of in-cell RNA secondary structure probing experiments (targeted DMS-MaPseq) and computational predictions were used to characterize the static structural landscape and conformational dynamics of both isoforms. Additionally, in-cell assays were used to identify functionally relevant structures in the 5' and 3' UTRs of AR-FL. A notable example is a conserved stem loop structure in the 5'UTR of AR-FL that can bind to Poly(RC) Binding Protein 2 (PCBP2). Taken together, our results reveal novel features that regulate AR expression.


Figures

Graphical Abstract
Graphical Abstract
Figure 1.
Figure 1.
AR-FL and V7 pre-mRNA transcript diagrams drawn to scale. These diagrams show the differences in size and sequence/functional domains between the two isoforms. AR-FL pre-mRNA and mature transcript (ENST00000374690.9) are displayed on top and AR-V7 pre-mRNA and mature transcript (ENST00000504326.5) are displayed on the bottom. The AR-FL pre-mRNA is 186598 nt long, and the mature transcript is 10667 nt long, consisting of a 1126 nt 5′UTR, a 2763 nt CDS, and a 6778 nt 3′UTR. The AR-V7 pre-mRNA is 151452 nt long and the mature transcript is 3615 nt long, consisting of a 327 nt 5′UTR, 1935 nt CDS, and a 1353 nt 3′UTR. Although much shorter, the V7 isoform encodes a constitutively active version of the AR protein caused by a truncated ligand binding domain. Here, shared UTR sequences are displayed in orange and shared CDS sequences are displayed in blue, green, yellow, and purple. Unique UTR sequences are displayed in gray and unique CDS sequences are displayed in pink.
Figure 2.
Figure 2.
All displayed data tracks were generated from RNA Framework informed predictions of AR-FL and are presented as seen in the Integrative Genomics Viewer (IGV). The AR-FL transcript cartoon is displayed at the top for spatial orientation of all other data. Below the transcript cartoon is the RNA Framework informed ScanFold z-scores with positive values in blue and negative values in red. Below the z-scores, the first arc diagram represents the RNA Framework informed ScanFold predicted base pairs with z-score > 0, >–1, >–2 and ≤2 color in white/gray, yellow, green and blue respectively. Below the ScanFold arc diagram, the DMS reactivities are shown as a heat map on a scale of 0–1 where 0 is white, 1 is dark red, and intermediate values are shades of red. Below the DMS reactivity heat map, the second arc diagram represents the base pair probabilities calculated from an minimum free energy fold using RNA Framework reactivities and a 600 nt max base pair span constraint, with probabilities >80%, 30–80% and 10–30% displayed in blue, gold and gray respectively. Comparison of the ScanFold and base pair probability arc diagrams demonstrates the general agreement between low z-score structures and highly probable base pairings. Below the base pair probability arc diagram, the purple bar graph represents the Shannon entropies calculated using RNA Framework reactivities and a 600 nt max base pair span constraint. The blue bars at the bottom represent dynamic regions identified by DRACO.
Figure 3.
Figure 3.
All displayed data tracks were generated from RNA Framework informed predictions of AR-V7 and are presented as seen in the Integrative Genomics Viewer (IGV). The AR-V7 transcript cartoon is displayed at the top for spatial orientation of all other data. Below the transcript cartoon is the RNA Framework informed ScanFold z-scores with positive values in blue and negative values in red. Below the z-scores, the first arc diagram represents the RNA Framework informed ScanFold predicted base pairs with z-score >0, >–1, >–2 and ≤2 color in white/gray, yellow, green and blue respectively. Below the ScanFold arc diagram, the DMS reactivities are shown as a heat map on a scale of 0–1 where 0 is white, 1 is dark red, and intermediate values are shades of red. Below the DMS reactivity heat map, the second arc diagram represents the base pair probabilities calculated from an minimum free energy fold using RNA Framework reactivities and a 600 nt max base pair span constraint, with probabilities >80%, 30–80% and 10–30% displayed in blue, gold and gray respectively. Comparison of the ScanFold and base pair probability arc diagrams demonstrates the general agreement between low z-score structures and highly probable base pairings. Below the base pair probability arc diagram, the purple bar graph represents the Shannon entropies calculated using RNA Framework reactivities and a 600 nt max base pair span constraint. The blue bars at the bottom represent dynamic regions identified by DRACO.
Figure 4.
Figure 4.
AR-FL 5′UTR functional assay results. Structure function data for AR-FL 5′UTR structures 1–4 and 6–7 in HeLa, 22Rv1, and DU145 cell lines. (A) The entire AR-FL 5′UTR is shown at the top with ScanFold predicted structures represented as an arc diagram above the gene cartoon. Low z-score structures (blue and green arcs) are annotated with their number and a blue or orange box. Structures annotated with blue boxes are expanded and represented below the arcs as 2D models. Black arrows represent the location of RIP primers. (B) The individual structures of AR 1–4 are numbered and annotated with all relevant data including two m6A modifications (orange circles), six covarying base pairs (green bars) and three predicted PCBP2 binding sites (gray highlight). Within the predicted PCBP2 binding sites, C > A mutations (red nucleotides) were made to ablate the potential interaction for functional testing. Mutant 1–3 were made at transcript positions 357–359, 314–315 and 333–335, respectively. (C) Results of semi-quantitative PCR on RIP samples from 22Rv1 and HeLa cells. Primers targeted a 141 nt region of the FL 5′UTR, near structure 4 (top diagram). On the left, the results from 22Rv1 cells shows an enrichment in PCBP2 protein binding compared to the IgG control at 25 cycles. On the right, the results from HeLa cells shows an enrichment in PCBP2 protein binding compared to the IgG control at 30 cycles. In both cases the intensity of the PCBP2 band was far greater than that of IgG and similar to that of the 5% Input (total lysate) sample. (D) Dual luciferase, and translational efficiency results for structures 1–4 in HeLa, 22Rv1, and DU145 cells. Changes in protein (yellow) and mRNA (red) levels compared to vector or WT control can be seen in the top bar graphs. Here, AR 4 was compared to vector and all mutants were compared to the WT AR 4. Changes in translational efficiency seen in the lower bar graphs following the same comparisons as protein and mRNA. Here, vector controls are represented in white and experimental constructs are in gray. Asterisks represent a P-value <0.05 determined using a two-tailed Student's t-test. (E) The individual components of structure 6–7 are numbered and annotated with all relevant data including five m6A modifications (orange circles) and 13 covarying base pairs (green bars). (F) Dual luciferase, and translational efficiency results for structures 6–7 in HeLa, 22Rv1 and DU145 cells. Changes in protein (yellow) and mRNA (red) levels compared to vector can be seen in the top bar graphs. Changes in translational efficiency compared to vector are seen in the lower bar graphs. Here, vector controls are represented in white and experimental constructs are in gray. Asterisks represent a P-value <0.05 determined using a two-tailed Student's t-test.
Figure 5.
Figure 5.
AR-FL 3′UTR functional assay results. Structure function data for AR-FL 3′UTR structures 32–36. A 746 nt fragment at the beginning of the AR-FL 3′UTR is shown with ScanFold predicted structures represented as an arc diagram above the gene cartoon. Low z-score structures (blue and green arcs) are annotated with their number and a blue or orange box. Structures annotated with blue boxes are expanded and represented below the arcs as 2D models. The individual hairpins of the 2D model are numbered and annotated with all relevant data including four m6A modifications (orange circles) and eighteen covarying base pairs (green bars) on structure 32, and a miR-297 site (pink) and a miR-9-5p site (yellow) for the single stranded region between structure 32 and 33. These structures were tested for function via dual luciferase assays and qPCR in HeLa, 22Rv1 and DU145 cells. The changes in protein (yellow) and mRNA (red) levels compared to vector control can be seen in the left bar graph. Using the protein and mRNA levels, translational efficiency was calculated and plotted in the right bar graph. Asterisks represent a P-value <0.05 determined using a two-tailed student T-test.
Figure 6.
Figure 6.
The strongest identified proteins (Mascot scores 3X > background for each sample) from biotin RNA pulldowns using synthetic AR-FL structure 4 WT and structure 32 in 22Rv1 cell lysates are compared using a Venn diagram. Unique proteins for structure 4 WT are within the light green circle, unique proteins for structure 32 are in the light blue circle, and common proteins identified in both are in the dark green intersecting region. The secondary structure models of structure 4 and structure 32 are on the left and right side of Venn diagram, respectively.

Similar articles

Cited by

References

    1. Tsai M.J., O’Malley B.W Molecular mechanisms of action of steroid/thyroid receptor superfamily members. Annu. Rev. Biochem. 1994; 63:451–486. - PubMed
    1. Chang C., Lee S.O., Wang R.S., Yeh S., Chang T.M. Androgen receptor (AR) physiological roles in male and female reproductive systems: lessons learned from AR-knockout mice lacking AR in selective cells. Biol. Reprod. 2013; 89:21. - PMC - PubMed
    1. Yeh S., Tsai M.Y., Xu Q., Mu X.M., Lardy H., Huang K.E., Lin H., Yeh S.D., Altuwaijri S., Zhou X. et al. . Generation and characterization of androgen receptor knockout (ARKO) mice: an in vivo model for the study of androgen functions in selective tissues. Proc. Natl. Acad. Sci. U.S.A. 2002; 99:13498–13503. - PMC - PubMed
    1. Giovannelli P., Di Donato M., Galasso G., Di Zazzo E., Bilancio A., Migliaccio A. The Androgen Receptor in Breast Cancer. Front. Endocrinol. (Lausanne). 2018; 9:492. - PMC - PubMed
    1. Likos E., Bhattarai A., Weyman C.M., Shukla G.C. The androgen receptor messenger RNA: what do we know?. RNA Biol. 2022; 19:819–828. - PMC - PubMed