. 2024 May 8;52(8):4556-4574.
doi: 10.1093/nar/gkae209.

RNA polymerase SI3 domain modulates global transcriptional pausing and pause-site fluctuations

Affiliations

RNA polymerase SI3 domain modulates global transcriptional pausing and pause-site fluctuations

Yu Bao et al. Nucleic Acids Res. .

Abstract

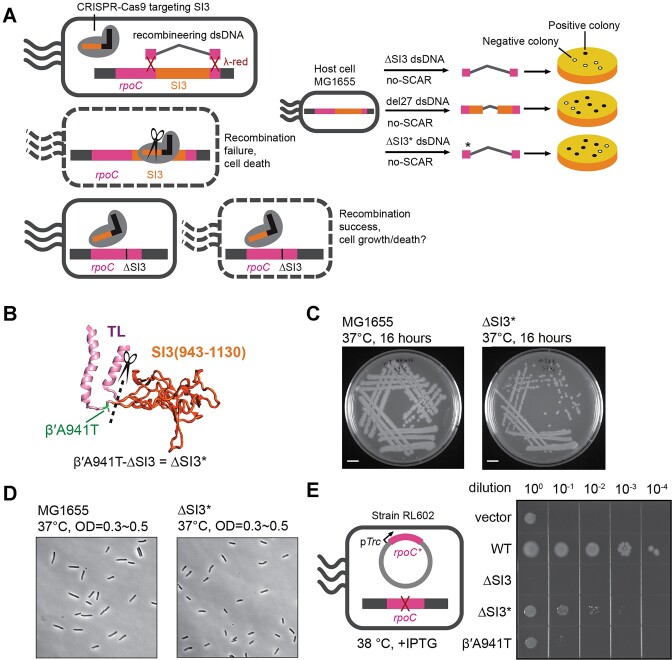
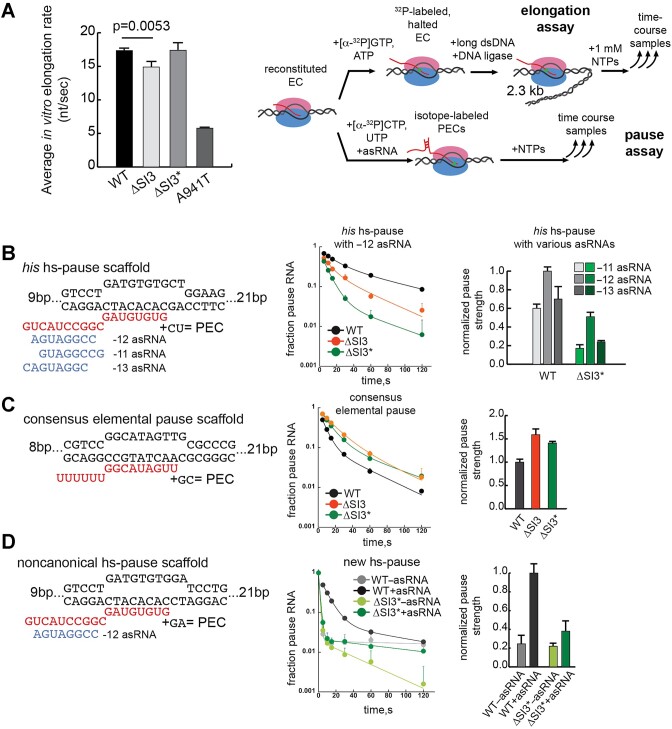
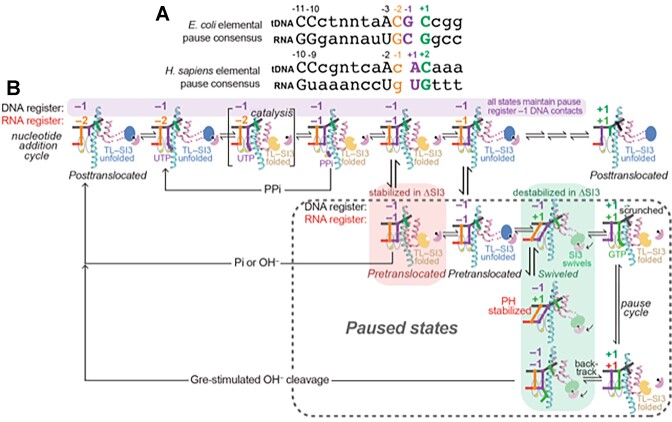
Transcriptional pausing aids gene regulation by cellular RNA polymerases (RNAPs). A surface-exposed domain inserted into the catalytic trigger loop (TL) of Escherichia coli RNAP, called SI3, modulates pausing and is essential for growth. Here we describe a viable E. coli strain lacking SI3 enabled by a suppressor TL substitution (β'Ala941→Thr; ΔSI3*). ΔSI3* increased transcription rate in vitro relative to ΔSI3, possibly explaining its viability, but retained both positive and negative effects of ΔSI3 on pausing. ΔSI3* inhibited pauses stabilized by nascent RNA structures (pause hairpins; PHs) but enhanced other pauses. Using NET-seq, we found that ΔSI3*-enhanced pauses resemble the consensus elemental pause sequence whereas sequences at ΔSI3*-suppressed pauses, which exhibited greater association with PHs, were more divergent. ΔSI3*-suppressed pauses also were associated with apparent pausing one nucleotide upstream from the consensus sequence, often generating tandem pause sites. These '-2 pauses' were stimulated by pyrophosphate in vitro and by addition of apyrase to degrade residual NTPs during NET-seq sample processing. We propose that some pauses are readily reversible by pyrophosphorolysis or single-nucleotide cleavage. Our results document multiple ways that SI3 modulates pausing in vivo and may explain discrepancies in consensus pause sequences in some NET-seq studies.


Figures

Graphical Abstract
Graphical Abstract
Figure 1.
Figure 1.
Changes in SI3 position modulate transcriptional elongation and pausing. SI3 occupies two major positions during the nucleotide addition cycle (NAC, panel in lower right): closed when the TL is folded and open when the TL is unfolded, also called in and out SI3 positions (top panels; pdb 6rh3 and 6rin, respectively) (75). TL folding occurs upon cognate NTP binding to the active center. Different pause states can form offline from the NAC as illustrated by the pathway to the left. The swiveled, hairpin-stabilized PEC is shown on the left in front and top views (pdb 6asx) (15). Swiveling of SI3 (pink contour in top view) is mediated by jaw–SI3 interaction (upper left panel). The consensus elemental pause sequence derived from genome-scale pause analysis (4) in E. coli is shown in the lower left.
Figure 2.
Figure 2.
Construction of an SI3-deleted E. coli strain. (A) Left panel, No-SCAR method to construct SI3 deletion. The genomic sequence encoding SI3 was targeted using CRISPR-Cas9 and recombined with a ΔSI3 DNA fragment lacking the targeted sequence using λ-Red-mediated recombination. Right panel, schematic comparison of outcomes for different DNA fragments recombined with SI3 region. Only one colony was obtained with ΔSI3 and this colony encoded a spontaneous β′A941T substitution (ΔSI3 plus β′A941T, called ΔSI3*). DNA fragments encoding ΔSI3* or del27 (42) yielded large numbers of positive colonies (black dots). (B) The location of β′A941T in the TL. (C) Colony size comparison for WT and ΔSI3* strains. (D) Microscopy images of WT and ΔSI3* cells in log-phase, bar representing 5 μm. (E) Complementation of rpoC(temperature-sensitive) by various rpoC genes. Plasmids harboring IPTG-inducible rpoC gene variants were expressed in E. coli strain RL602 (23), in which rpoC expression is suppressed at ≥38°C.
Figure 3.
Figure 3.
ΔSI3* RNAP exhibits average elongation rate similar to WT but pause kinetics similar to ΔSI3 RNAP. (A) Left panel, average elongation rates of various RNAPs determined by in vitro transcription assay. Results are mean ± SD (n = 3); P value is from a two-tailed t-test. Right panel, schematic diagram of the in vitro elongation and pause assays. For elongation assays, the 32P-labeled, halted EC was ligated to a 2.3 kb DNA template before re-initiating elongation by addition of all 4 NTPs (1 mM each). Elongation rates were calculated from the average change in RNA lengths over time. For pause assays, the PEC was reconstituted on pause scaffolds and the kinetics of pause escape were measured. Representative gel images for panels (A)–(D) are shown in Supplementary Figure S7. (B) ΔSI3* RNAP his hs-pause assay. From left to right: the pause scaffold sequence and location of PH mimics formed with asRNAs; change in fraction paused RNA vs. time for WT, ΔSI3, and ΔSI3* RNAPs; and comparison of pause strengths for WT and ΔSI3* RNAPs for different PH mimic locations relative to the pause RNA 3′ end. (C) ΔSI3* RNAP ce-pause assay with panels as described for (B). (D) ΔSI3* RNAP pause assay using a hs-, non-consensus pause sequence (pause RNA 3′ rA) with panels as described for (B).
Figure 4.
Figure 4.
ΔSI3*-induced changes in global pause profiles determined by NET-seq. (A) Pipeline for quantitative NET-seq library preparation and data analysis. To enable quantitative comparisons of pausing between WT and ΔSI3* strains, a B. subtilis strain was used as spike-in control (∼6.2 × 108B. subtilis colony forming units per apparent OD600E. coli). (B) The consistency of NET-seq reads in non-rRNA region and rRNA region between datasets represented by Pearson's coefficient (r). (C) Comparison of NET-seq reads between ΔSI3* and WT datasets in the his operon leader region. Numbers 1 to 6 represent alternatively pairing RNA segments in the attenuation control region (1:2–3:4–5:6 forming the termination configuration and 1–2:3–4:5–6 forming the antitermination configuration). (D) Schematic diagram of pause site detection and numbers of pause signals in WT and ΔSI3* datasets. Overlapping region represents pause sites detected in both datasets.
Figure 5.
Figure 5.
Compasion of pause strengths between WT and ΔSI3* datasets using pause indices. (A) Calculation of pause indices. Dark colored squares represent 3′ ends of the mapped reads. (B) 3′-end pause index comparisons between WT biological replicates and between WT and ΔSI3* datasets. (C) 3′-end pause index comparisons between WT and ΔSI3* datasets in non-rRNA regions and in the rRNA region. (D–G) Top panels, volcano plots of false-discovery rate (FDR)-adjusted P values versus pause index ratios of the WT and ΔSI3* datasets at WT-specific pause sites, all WT pause sites, all ΔSI3* pause sites and ΔSI3*-specific sites, respectively. Blue dots represent pause sites with statistically significant decreased pause indices in ΔSI3* versus WT. Orange dots represent pause sites with statistically significant increased pause indices in ΔSI3* versus WT. Index change thresholds are marked with vertical dotted lines and the P value threshold (10, 4) is marked with the horizontal dotted line. Middle panels, Venn diagrams of pause sites represented in the volcano plots (slashed regions). Bottom panels, sequence logos of the corresponding regions in the volcano plots.
Figure 6.
Figure 6.
SI3 exerts opposite effects on different types of pauses in vivo. (A) The sequence logos of WT pauses enhanced by ΔSI3* (corresponding to Figure 5E enhanced pauses), ΔSI3*-specific pauses (corresponding to Figure 5G pauses), all WT pauses, and the previously reported consensus elemental pause sequence (4). The four sequence elements contributing to elemental pause strength (5) are shown as colored bars above the logos and the relative information contribution of these elements to the overall pause consensus is shown in the bar graphs on the right. (B) Relative fractions of predicted PHs at ΔSI3*-suppressed pauses, at ΔSI3*-enhanced pauses, and at random genomic sites (shown as percentages). PHs positions are as shown in the diagram above the bar graphs. (C) In vitro transcription templates encoding putative hs-pause signals from NET-seq analyses. The predicted PHs of the putative hs-pause candidates. (D) In vitro transcription assays of the putative hs-pause candidates with WT and ΔSI3* RNAPs. The asterisk in the yfaSanti gel indicates a missing sample. (E) In vitro transcription assay of the putative hs-pause candidates by WT RNAP with NusA. (F) In vitro transcription assay of the putative hs-pause candidates by WT RNAP with PH-disrupting asDNAs.
Figure 7.
Figure 7.
Genome distributions and in vivo tests of ΔSI3*-enhanced pauses and putative hs-pauses. (A) Distribution of ΔSI3*-enhanced pauses and putative hs-pauses in different genome locations. (B) Densities of pauses in various genome regions. (C) Cumulative probability distributions of distances of pauses from gene starts (AUG codons) for WT pauses (grey), ΔSI3*-enhanced pauses (orange) and putative hs-pauses (blue). The approximate difference in cumulative probability at 250 bp for all pauses and putative hs-pauses is shown by horizontal dotted lines. (D) Designs of the lacZ reporters fused with N-terminal peptide sequences and the fabH and rpoH hs-pause signals along with their PH-mutants (PH). Altered bases in PH constructs are shown in white letters. (E) Expression comparisons of the lacZ reporters for hs-pause candidates and their mutants. Plot represents 6 biological replicates and their mean values.
Figure 8.
Figure 8.
Tandem pauses found in NET-seq analyses. (A) Top, number of tandem pauses found in the WT strain. Bottom, the sequence logo of all –1 pauses in tandem pause pairs. (B) Fractions of tandem pauses for which both registers were ΔSI3*-enhanced or ΔSI3*-suppressed among all ΔSI3*-enhanced or -suppressed pauses found in the WT strain (shown as percentages); P values are from Z-proportion test. (C) Effects of ΔSI3* on all –2 and –1 registers among tandem pauses. P values are from Z-proportion test. (D) Sequence logos of all ΔSI3*-suppressed pauses and of ΔSI3*-suppressed pauses in the –1 and –2 registers of tandem pauses. (E) The tandem pause observed early in hisG. (F) Possible routes interconversion of –1 and –2 pauses by nucleotide addition, pyrophosphorolysis, hydrolysis, and phosphorolysis (60).The hisG pause sequence is shown. (G) In vitro transcription of hisG tandem pauses at various concentrations of PPi. Bottom bar graph shows the relative amount of –1 and –2 pauses at 3 time points after transcription restart at various PPi concentrations. (H) Ratios of tandem pause registers in WT NET-seq samples +/–apyrase treatment. Bar graph on the left shows the 3′-end changes for hisG tandem pauses. Scatter plot on the right shows 3′-end changes for tandem pause registers for WT NET-seq samples. Pause sites shown correspond to the WT samples depicted in panel A.
Figure 9.
Figure 9.
SI3 in interconverting PECs and transcription cleavage. (A) the consensus elemental pause sequence logos from E. coli and H. sapiens (4,8). These similar logos differ by 1 nt in the assigned positions of pause RNA 3′ ends (numbered here as –1 to match the published consensus sequences). Our results suggest the discrepancy between pauses sites detected by NET-seq relative to the consensus sequence could be due to changes in RNA 3′ ends during the NET-seq library preparation (e.g. by PPi/Pi/OH-induced RNA cleavage). (B) routes of interconversion of EC/PEC states from the –2 species at the post-translocated register to the –1 species at the post-translocated register showing translocation registers and TL/SI3 states. SI3 is shown in different colors to indicate its position (blue, open; yellow, closed; green, swiveled). Note that –2 and –1 pause states maintain the same DNA contacts with the consensus pause sequence. For example, PPi may generate apparent –2 pauses from –1 pauses even though DNA contacts remain unchanged. Colored boxes, the effects of ΔSI3* on different pause states. Red box, ΔSI3* increases near consensus–sequence pauses that reside primarily in the pre-translocated state (16) because SI3 destabilizes the pre-translocated register. Green boxes, ΔSI3* decreases hs-pauses that reside primarily in the swiveled state (15) because SI3 stabilizes swiveling.

Similar articles

Cited by

References

    1. Landick R. Transcriptional pausing as a mediator of bacterial gene regulation. Annu. Rev. Microbiol. 2021; 75:291–314. - PubMed
    1. Mayer A., Landry H.M., Churchman L.S.. Pause & go: from the discovery of RNA polymerase pausing to its functional implications. Curr. Opin. Cell Biol. 2017; 46:72–80. - PMC - PubMed
    1. Blombach F., Fouqueau T., Matelska D., Smollett K., Werner F.. Promoter-proximal elongation regulates transcription in archaea. Nat. Commun. 2021; 12:5524. - PMC - PubMed
    1. Larson M.H., Mooney R.A., Peters J.M., Windgassen T., Nayak D., Gross C.A., Block S.M., Greenleaf W.J., Landick R., Weissman J.S.. A pause sequence enriched at translation start sites drives transcription dynamics in vivo. Science. 2014; 344:1042–1047. - PMC - PubMed
    1. Saba J., Chua X.Y., Mishanina T.V., Nayak D., Windgassen T.A., Mooney R.A., Landick R.. The elemental mechanism of transcriptional pausing. eLife. 2019; 8:e40981. - PMC - PubMed

Publication types

MeSH terms

Substances